

Abstract
Macrophage phagocytosis is required for effective clearance of invading bacteria and other microbes. Coordinated phosphoinositide signaling is critical both for phagocytic particle engulfment and subsequent phagosomal maturation to a degradative organelle. Phosphatidylinositol 3-phosphate (PtdIns(3)P) is a phosphoinositide that is rapidly synthesized and degraded on phagosomal membranes, where it recruits FYVE domain– and PX motif–containing proteins that promote phagosomal maturation. However, the molecular mechanisms that regulate PtdIns(3)P removal from the phagosome have remained unclear. We report here that a myotubularin PtdIns(3)P 3-phosphatase, myotubularin-related protein-4 (MTMR4), regulates macrophage phagocytosis. MTMR4 overexpression reduced and siRNA-mediated Mtmr4 silencing increased levels of cell-surface immunoglobulin receptors (i.e. Fcγ receptors (FcγRs)) on RAW 264.7 macrophages, associated with altered pseudopodal F-actin. Furthermore, MTMR4 negatively regulated the phagocytosis of IgG-opsonized particles, indicating that MTMR4 inhibits FcγR-mediated phagocytosis, and was dynamically recruited to phagosomes of macrophages during phagocytosis. MTMR4 overexpression decreased and Mtmr4-specific siRNA expression increased the duration of PtdIns(3)P on phagosomal membranes. Macrophages treated with Mtmr4-specific siRNA were more resistant to Mycobacterium marinum–induced phagosome arrest, associated with increased maturation of mycobacterial phagosomes, indicating that extended PtdIns(3)P signaling on phagosomes in the Mtmr4-knockdown cells permitted trafficking of phagosomes to acidic late endosomal and lysosomal compartments. In conclusion, our findings indicate that MTMR4 regulates PtdIns(3)P degradation in macrophages and thereby controls phagocytosis and phagosomal maturation.
Keywords: phagocytosis, phosphatidylinositol phosphatase, Fc-gamma receptor, macrophage, mycobacteria, innate immunity, myotubularin-related protein-4 (MTMR4), phagosome, phosphatidylinositol 3-phosphate (PtdIns(3)P)
Introduction
Macrophages contribute to immune control of infection, tissue remodeling, and inflammation by undergoing a selective pathogen removal process, phagocytosis, which is critical for the clearance of apoptotic bodies and invading microorganisms (1, 2). Phagocytosis includes the internalization of a particle followed by its subsequent processing within a membrane-bound organelle. The phagocytosis of IgG-opsonized particles is initiated when Fcγ receptors (FcγRs)4 on the macrophage cell surface recognize the Fc portion of host IgG on microorganisms or cells. This induces FcγR clustering leading to localized actin polymerization that, in turn, propels the elaboration of pseudopods, which internalize the target into a membrane-bound vacuole called the phagosome (3). The phagosome is trafficked in a series of orchestrated interactions with other membrane-bound organelles and proteins, termed phagosomal maturation (3).
Phosphoinositides are membrane-bound signaling molecules involved in numerous cellular processes, including intracellular trafficking. In many eukaryotic cells, phosphatidylinositol 3-phosphate (PtdIns(3)P) predominantly localizes to the cytoplasmic face of endosomal and phagosomal membranes (4, 5). PtdIns(3)P regulates endosomal and phagosomal maturation into degradative organelles that fuse with lysosomes. PtdIns(3)P recruits effector proteins, such as early endosome antigen 1 (EEA1) and hepatocyte growth factor–regulated tyrosine kinase substrate (Hrs), via their FYVE domains and phox (PX) motifs to endosomal and phagosomal membranes, where they regulate membrane fusion, sorting of cargo, and trafficking to subcellular compartments (5, 6). PtdIns(3)P is dynamically turned over on phagosomes and rapidly appears and then disappears within a 10-min time frame (4). However, although the generation of PtdIns(3)P by the Class III phosphoinositide 3-kinase (PI3K) is well-described in mammalian cells (7), the molecular mechanisms underlying the removal of PtdIns(3)P from phagosomal membranes in macrophages are still unclear.
Myotubularin-related protein-4 (MTMR4) is a member of the myotubularin family of phosphoinositide phosphatases that selectively degrade the 3-position phosphate from the inositol ring of PtdIns(3)P and phosphatidylinositol 3,5-bisphosphate (PtdIns(3,5)P2) (8–10). MTMR4 contains a FYVE domain, suggesting its potential to interact with PtdIns(3)P on endosomal and phagosomal membranes. Accordingly, MTMR4 was demonstrated to localize to early and recycling endosomes, where it regulates early endosomal sorting and recycling (11–14).
We have previously reported that MTMR4 regulates the endocytosis of transferrin and restricts the sorting of transferrin out of early endosomes (12). Intriguingly, MTMR4 also regulates the distribution of recycling endosomes and the degradation of several surface growth factor receptors, including epidermal growth factor receptor and transforming growth factor β receptor (11, 12, 15, 16). Murine macrophages express the cell-surface stimulatory receptors FcγRI, -III, and -IV and the inhibitory FcγRIIb (17, 18). Following ligand binding, stimulatory FcγRs undergo cross-linking with phosphorylation of associated immunoreceptor tyrosine-based activation motifs, thereby initiating signaling via tyrosine kinases and Class I PI3K to promote pseudopodal extension, which is required for phagocytosis via actin polymerization (19). Accordingly, initiation of phagocytosis depends on the presence of FcγRs at the cell surface, which is highly regulated by endocytic recycling and degradation. However, whether MTMR4 regulates FcγR levels at the cell surface is unknown, and a potential role for MTMR4 in regulating phagosomal PtdIns(3)P and thereby phagosomal maturation has yet to be determined.
Here, we investigated whether MTMR4 regulates phagosomal PtdIns(3)P and plays a role in phagosomal internalization and maturation in mammalian macrophages. MTMR4 overexpression decreased the surface expression of FcγRs and pseudopodal actin formation in RAW 264.7 macrophage cells, indicating that MTMR4 plays a role in phagocytosis initiation. Interestingly, MTMR4 overexpression was associated with a decreased efficiency of phagocytosis. We found that MTMR4 was dynamically recruited to the forming phagosome and negatively regulated the duration and amplitude of PtdIns(3)P signals on phagosomes. Finally, MTMR4 depletion accelerated the maturation of phagosomes containing pathogenic mycobacteria. These results identify MTMR4 as a novel regulator of macrophage phagocytosis that directs phagosomal PtdIns(3)P turnover.
Results
MTMR4 negatively regulates the presence of FcγR on the macrophage cell surface
Endogenous MTMR4 expression in macrophages was assessed by immunoblotting of RAW 264.7 cell lysates using a polyclonal antibody against MTMR4 (12), which detected an immunoreactive polypeptide migrating at 165 kDa consistent with its predicted molecular mass (Fig. 1Ai). Similarly, RAW 264.7 cells transfected with recombinant HA-MTMR4 expressed a 165-kDa polypeptide detected by anti-HA antibodies (Fig. 1Aii). At steady state, FcγRs undergo cycles of endocytosis and recycling back to the plasma membrane, whereas ligand-bound FcγRs are diverted away from the recycling compartment to the degradative pathway (20). As MTMR4 is reported to regulate the trafficking of transferrin and epidermal growth factor receptor (12), we next assessed whether MTMR4 can regulate the cell-surface expression of FcγRI and FcγRII/III at steady state. RAW 264.7 cells showed intense FcγRI and FcγRII/III immunofluorescence staining at the cell membrane, whereas cells expressing HA-MTMR4 showed less intense staining of FcγRI, but not FcγRII/III, when compared with nontransfected cells and the HA-vector control (Fig. 1B). Quantification of FcγRI immunofluorescence intensity showed 20% less surface FcγRI in cells expressing HA-MTMR4 compared with vector controls (Fig. 1C), whereas no significant difference in surface FcγRII/III was observed (Fig. S1A). In a similar experiment, siRNA targeting Mtmr4 was used to generate Mtmr4-knockdown RAW 264.7 cells. The efficiency of Mtmr4 knockdown was confirmed by quantitative RT-PCR (Fig. 1D), and decreased protein expression was confirmed by Western blotting (Fig. 1E). RAW 264.7 cells treated with Mtmr4 siRNA showed increased surface expression of extracellular FcγRI and FcγRII/III as assessed by flow cytometry (Fig. 1F). This was not a consequence of altered total cellular levels of FcγRs, as this difference was not observed when intracellular receptors were included in immunostaining of permeabilized cells (Fig. S1B). This result was confirmed by immunofluorescence microscopy (Fig. 1G), which revealed a significant increase in immunofluorescent staining of FcγRI and FcγRII/III in cells treated with Mtmr4 siRNA (Fig. 1H). To confirm the specificity of this effect, RAW 264.7 cells were treated with Mtmr4 siRNA and subsequently transfected with HA-MTMR4 or HA-vector as a control before fixation and immunofluorescent assessment of FcγRI. Rescue of Mtmr4 knockdown by HA-MTMR4 overexpression, but no change in HA-vector control samples, verified the specific regulation of FcγR surface levels by MTMR4 (Fig. 1I).
Figure 1.

MTMR4 regulates surface levels of FcγR on RAW 264.7 macrophages. A, lysates of nontransfected (i) and HA-vector– or HA-MTMR4–transfected (ii) RAW 264.7 macrophages were subjected to SDS-PAGE and immunoblotted using a polyclonal antibody raised against recombinant MTMR4 or an anti-HA antibody for the detection of endogenous MTMR4 (arrowhead) and recombinant HA-MTMR4 (arrow), respectively. An anti-GAPDH antibody was used as loading control. B, cells were transfected with HA-vector or HA-MTMR4 as indicated and fixed. Unpermeabilized cells were stained with anti-FcγRI (red) and anti-FcγRII/III (green) antibodies and were thereafter permeabilized and stained again using an anti-HA antibody (blue) to detect transfected cells (marked with an asterisk). C, the FcγRI fluorescence signal in B was quantified in three independent experiments with 30 cells analyzed per condition. Within experiments, the fluorescence was normalized to that of the control condition, which was arbitrarily assigned a value of 100. D, RAW 264.7 cells were treated with negative control or Mtmr4 siRNA for 72 h (siRNA 1) or 48 h (siRNA 2 and siRNA 3), after which Mtmr4 mRNA levels were quantitated by RT-PCR analysis relative to Gapdh. mRNA levels were normalized to that of control siRNA cells, which was arbitrarily assigned a value of 1. E, siRNA-mediated knockdown of MTMR4 in lysates from control or Mtmr4 siRNA 1–treated cells was assessed by Western blotting using a polyclonal anti-MTMR4 antibody and anti-GAPDH antibody as loading control. F, cells were treated with control or Mtmr4 siRNA 3, and FcγRI and FcγRII/III signal fluorescence was quantified by flow cytometry in six independent experiments with >1000 cells analyzed. Fluorescence was normalized to that of control siRNA cells, which was arbitrarily assigned a value of 100. G, immunofluorescent micrographs of cells transfected with control siRNA or Mtmr4 siRNA 3, as indicated, and immunostained using anti-FcγRI and -FcγRII/III antibodies. H, the FcγRI signal fluorescence of cells transfected with control siRNA or Mtmr4 siRNA 2 or 3 was quantified in three independent experiments with 30 cells analyzed per condition. Within experiments, the fluorescence was normalized to that of the control condition, which was arbitrarily assigned a value of 100. I, the relative FcγRI fluorescence signal intensity of cells transfected with HA-vector or HA-MTMR4 and control or Mtmr4 siRNA 3 was quantified. Within experiments, the fluorescence was normalized to that of the control condition, which was arbitrarily assigned a value of 100. *, p < 0.05, two-tailed paired t test. Scale bars, 10 μm. Error bars, S.E. Images are representative of at least three independent experiments.
One of the critical events initiated via clustered FcγR signaling is the local remodeling of the submembranous actin cytoskeleton (21), which contributes to the growth of pseudopods around the particle (22, 23). We next assessed the presence of F-actin at phagocytic cups in cells overexpressing HA-MTMR4. RAW 264.7 cells transfected with either HA-vector or HA-MTMR4 were incubated with 6-μm IgG-opsonized latex beads (bIgG-6μm) to facilitate FcγR-mediated phagocytosis. Immunofluorescent assessment showed the distinct presence of phalloidin-stained F-actin at the phagocytic cups in control cells as well as HA-MTMR4–expressing cells (Fig. 2A). However, quantification revealed that cells expressing HA-MTMR4 showed a 20% reduction in the intensity of F-actin at phagocytic cups compared with vector controls (Fig. 2B). In contrast, cells treated with Mtrm4 siRNA showed a 57% increase in F-actin intensity at phagocytic cups (Fig. 2C). Therefore, MTMR4 overexpression decreases FcγRI at the cell surface and is associated with decreased phagocytic cup F-actin.
Figure 2.

MTMR4 regulates pseudopodal F-actin during IgG-mediated phagocytosis. A, RAW 264.7 cells were transfected with HA-vector or HA-MTMR4, allowed to commence phagocytosis of bIgG-6μm, fixed, and stained with phalloidin (green) and anti-HA antibodies (red) to detect F-actin and transfected cells, respectively. Immunofluorescent micrographs of transfected cells as well as merged and bright-field images are shown. Arrows, phagocytic cups. Scale bars, 5 μm. B, phalloidin fluorescence was quantified on phagocytic cups in HA-vector– or HA-MTMR4–transfected cells undergoing phagocytosis of bIgG-6μm, after which they were fixed and stained as in A. 27–34 phagosomes were examined in three independent experiments, and fluorescence was normalized to the control condition, which was arbitrarily assigned a value of 100. C, quantification of pseudopodal phalloidin signal in cells treated with control or Mtrm4 siRNA 1 undergoing phagocytosis, fixed and stained as described in A. 176–200 phagosomes were examined in four independent experiments, and fluorescence was normalized to the control condition, which was arbitrarily assigned a value of 100. Error bars, S.E. *, p < 0.05, two-tailed paired t test. Images are representative of at least three independent experiments.
MTMR4 negatively regulates phagocytosis
One possible functional outcome of altered FcγR surface expression and actin polymerization is altered phagocytosis induction (1). Therefore, we next investigated whether MTMR4 regulates the efficiency of phagocytosis in macrophages. RAW 264.7 cells expressing HA-MTMR4 or HA-vector as a control were incubated with bIgG-6μm, and the phagocytic index was determined as the number of fully internalized beads per 100 cells normalized to HA-vector control. The phagocytic index was reduced in cells expressing HA-MTMR4 compared with vector controls (Fig. 3A). Because a similar effect was observed using 9-μm (Fig. 3B) and 3-μm (Fig. 3C) IgG beads, this effect was not dependent on bead size, suggesting that MTMR4 does not regulate phagocytosis by restriction of membrane delivery to the phagocytic cup (24). The catalytic activity of MTMR4 was required for phagocytosis regulation, as no difference in the phagocytic index was observed in cells transfected with catalytically inactive HA-MTMR4(C407A) (Fig. S2). Mtmr4 siRNA–treated cells showed a 16–22% increase in the phagocytosis of bIgG-6μm compared with control siRNA cells (Fig. 3D). To evaluate the extent to which MTMR4 negative regulation of phagocytosis depended on PI3K signaling, phagocytosis assays were carried out in cells pretreated with the PI3K inhibitor LY294002, which inhibits both phosphatidylinositol 3,4,5-trisphosphate (PtdIns(3,4,5)P3) and PtdIns(3)P generation by Class I, II, and III PI3Ks (with the exception of Class IIα) (7). LY294002 treatment resulted in significant inhibition of phagocytosis with no observed effect of Mtmr4 knockdown compared with control cells under these conditions (Fig. 3E). This result is consistent with the contention that MTMR4 negative regulation of phagocytosis occurs in part via a PI3K-dependent mechanism.
Figure 3.
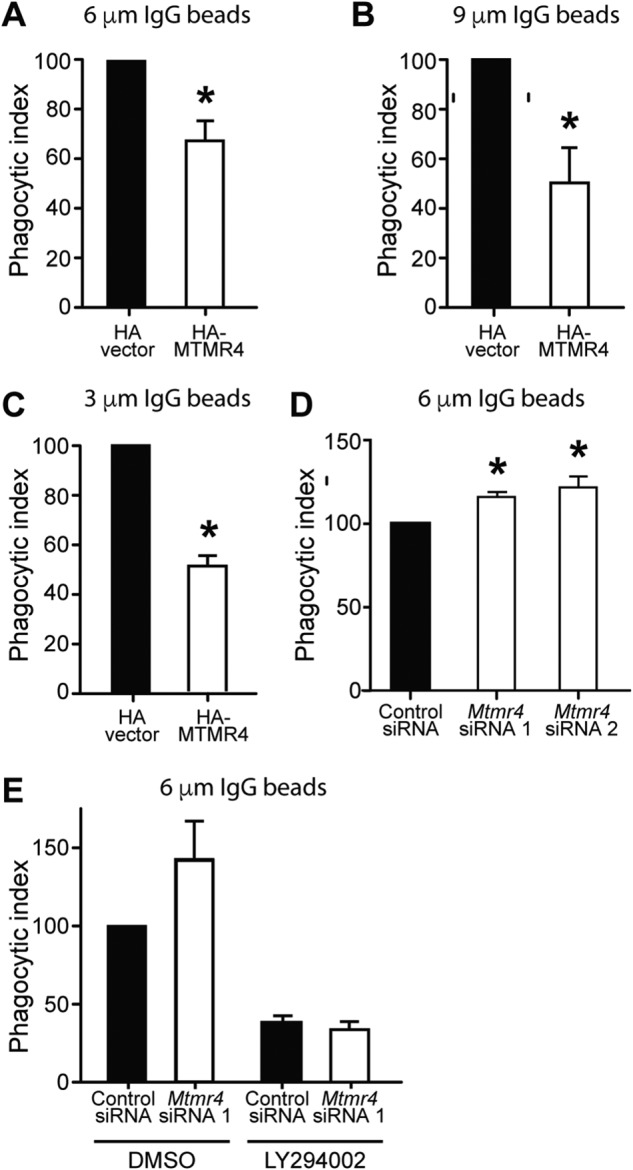
MTMR4 negatively regulates phagocytotic engulfment. 24 h post-transfection with HA-vector or HA-MTMR4, RAW 264.7 cells underwent synchronized phagocytosis of IgG-opsonized latex beads for 15 min. The phagocytic index was calculated as the number of beads fully internalized per 100 cells and normalized to the control condition, which was arbitrarily assigned a value of 100. A, phagocytic index upon phagocytosis of bIgG-6μm in n = 5 independent experiments; B, bIgG-9μm in n = 4 independent experiments; C, bIgG-3μm in n = 3 independent experiments. D, RAW 264.7 cells were transfected with control or Mtmr4 siRNA 1 or Mtmr4 siRNA 2, prior to phagocytosis of bIgG-6μm in n = 4 and 5 independent experiments, respectively. E, RAW 264.7 cells were transfected with control or Mtmr4 siRNA 1, incubated with vehicle (DMSO) or 100 μm LY294002 for 30 min, and then allowed to phagocytose bIgG-6μm in the presence of LY294002 for 15 min, and the phagocytic index was scored in n = 3 independent experiments. *, p < 0.05, two-tailed paired t test. Error bars, S.E.
MTMR4 localizes to phagosomes in macrophages
To assess MTMR4 subcellular localization during phagocytosis, HA-MTMR4–expressing RAW 264.7 cells were examined by immunofluorescence when phagocytosing bIgG-6μm particles. HA-MTMR4 was found to be enriched on punctate and vesicular structures and on phagosomes with cytosolic signal also present (Fig. 4A), revealing that MTMR4 is recruited to phagosomes during FcγR-mediated phagocytosis.
Figure 4.

MTMR4 is recruited to phagosomes in a time-dependent fashion. A, RAW 264.7 cells were transfected with HA-MTMR4 and allowed to phagocytose bIgG-6μm before fixation, staining (anti-HA in green and anti-IgG in red), and confocal imaging. HA-MTMR4 punctate signals were observed in a perinuclear distribution and on the phagosome (arrows) containing internalized IgG beads. Scale bars, 10 μm. B, RAW 264.7 cells were cotransfected with YFP-MTMR4 and CFP and imaged live during the phagocytosis of bIgG-6μm. Time = 00:00 was defined as the time of the first extension of pseudopods onto the bead. Shown are YFP, CFP, and divided (YFP/CFP) fluorescent images. Magnified images at 01:00 min and 03:00 min in the fluorescent channels are shown. Arrows, YFP-MTMR4 vesicles mobilizing toward the phagocytic cup. Arrowheads, YFP-MTMR4 on perinuclear vesicles. Scale bars, 5 μm. C, average fluorescence ratios of Rp (phagosomal YFP signal/phagosomal CFP signal)/Rc (cell YFP signal/cell CFP signal) analyzed for n = 5 cells (10 phagosomes). Measurements at the phagosome (Rp) and of the cell (Rc) were taken from the divided cell image. Error bars, S.E. Images are representative of at least three independent experiments.
We noted that phagosomal MTMR4 levels varied between phagosomes, consistent with the transient pattern of phagosomal PtdIns(3)P signal appearance and disappearance (4). To evaluate the spatiotemporal recruitment of MTMR4 to individual phagosomes, cells expressing YFP-MTMR4 were imaged live during phagocytosis of bIgG-6μm (Fig. 4B and Movie S1). As an experimental control, cells were cotransfected with CFP, a cytoplasmic marker, to ensure that YFP signal detected at the phagosome was the result of YFP-MTMR4 recruitment and not a consequence of morphometric changes due to pseudopodia and membrane ruffling (25, 26). Under these conditions, mobilization of YFP-MTMR4-positive vesicles toward the base of the phagocytic cup was observed at the 1-min time point (Fig. 4B, arrows). Following engulfment, increased YFP-MTMR4 signal was detected around the phagosome (Fig. 4B). MTMR4 was also observed on motile structures with transient contacts made with each other and the phagosome, a pattern reminiscent of endosomal “kiss and run” behavior (Fig. 4B (arrowheads) and Movie S1) (4). Similar changes were not observed in the cytoplasmic CFP signal, which remained evenly distributed over the entire time course (Fig. 4B). To quantify the recruitment of MTMR4 to the phagosome, the ratio of YFP-MTMR4 fluorescence to CFP fluorescence in the region of the phagosome (Rp) was calculated, and this was normalized to the corresponding YFP/CFP fluorescence of the entire cell (Rc) to control for variation in construct expression. The early recruitment of YFP-MTMR4 to the phagosome during engulfment was reflected by a steep increase in the Rp/Rc ratio, followed by a decline in YFP-MTMR4 fluorescence on the phagosome over a time scale of 5–10 min (Fig. 4C). Hereafter, the signal showed increased variability but remained above cellular background for >30 min in some cells. These results indicate a dynamic pattern of time-dependent recruitment of MTMR4 to the phagosome.
MTMR4 regulates the duration of PtdIns(3)P signaling on phagosomes
MTMR4 dephosphorylates PtdIns(3)P and PtdIns(3,5)P2 in vitro and regulates endosomal PtdIns(3)P in vivo (12). However, whether MTMR4 plays a role in regulating the removal of phagosomal PtdIns(3)P is unknown. The temporal relationship between PtdIns(3)P and MTMR4 phagosomal recruitment was therefore assessed by cotransfecting cells with the PtdIns(3)P biosensor mCherry-2xFYVE (2xFYVE) and YFP-MTMR4, followed by live imaging during the phagocytosis of bIgG-6μm. The 2xFYVE probe was enriched on the formed phagosome with peak signal and then a decline in signal within the first 10 min as reported (Fig. 5Ai) (4). YFP-MTMR4 recruitment to the phagosome occurred after 2xFYVE enrichment and coincided with the decline in 2xFYVE signal (Fig. 5Aii). This was supported by quantification of 2xFYVE and YFP-MTMR4 signals on phagosomes, indicating a decrease in phagosomal PtdIns(3)P immediately after recruitment of YFP-MTMR4 to the phagosome (Fig. 5B). To characterize the role of MTMR4 in PtdIns(3)P phagosome kinetics, we assessed the accumulation of mCherry-2xFYVE during phagocytosis in cells coexpressing HA-vector control (Fig. 5C), HA-MTMR4 (Fig. 5D), or a catalytically inactive mutant HA-MTMR4(C407A) (Fig. 5E) that we have described previously (12). Again, the 2xFYVE signal around the phagosome was quantified in each experiment. In cells expressing HA-MTMR4, phagosomal PtdIns(3)P signals initially rose at a similar rate relative to HA-vector–transfected cells, but they peaked and declined more rapidly with MTMR4 expression (Fig. 5F and Movies S2 and S3). In contrast, cells expressing HA-MTMR4(C407A) showed increased phagosomal PtdIns(3)P levels and longer signal duration compared with controls (Fig. 5F and Movie S4).
Figure 5.

MTMR4 negatively regulates the duration of PtdIns(3)P signaling on phagosomes. A, RAW 264.7 cells were cotransfected with MTMR4-YFP and 2xFYVE and imaged live during the phagocytosis of bIgG-6μm. Time = 00:00 was defined as the time of pseudopod closure around the first internalized bead. Scale bars, 10 μm. B, average mCherry-2xFYVE and MTMR4-YFP fluorescence ratios of Rp (phagosomal fluorescence signal)/Rc (cell fluorescence signal) of bIgG-6μm phagosomes in cotransfected RAW 264.7 cells. n = 5 beads from two experiments combined. C–E, cells were cotransfected with mCherry-2xFYVE and HA-vector (C), HA-MTMR4 (D), or HA-MTMR4(C407A) (E) at a 1:10 ratio, and time-lapse imaging was conducted during the phagocytosis of bIgG-6μm, with recording of mCherry fluorescence at 30-s intervals. Time = 00:00 was defined as the time of pseudopod closure around the first internalized bead. Scale bars, 10 μm. F, average mCherry fluorescence was quantitated and Rp (phagosomal mCherry fluorescence)/Rc − p (total cellular mCherry fluorescence-phagosomal mCherry fluorescence) was calculated at each time point with n = 15 beads (HA), 11 beads (HA-MTMR4), and 22 beads (HA-MTMR4(C407A)). Error bars, S.E. Images are representative of at least three independent experiments.
In a similar experiment investigating the effect of Mtmr4 depletion on PI(3)P levels during phagocytosis, phagosomal PtdIns(3)P signals were assessed live in cells cotransfected with mCherry-2xFYVE and control (Fig. 6A and Movie S5) or Mtmr4 siRNA (Fig. 6B and Movie S6). The results were quantified and showed prolonged phagosomal 2xFYVE signal in Mtmr4 siRNA cells as compared with control (Fig. 6C). Therefore, overexpression of MTMR4 does not abolish PtdIns(3)P recruitment to the phagosome but attenuates its peak amplitude and accelerates its decline, whereas expression of a catalytically inactive MTMR4 variant delays the dephosphorylation of PtdIns(3)P on phagosomes, a result also observed using Mtmr4 siRNA. These results are consistent with the contention that MTMR4 is recruited to phagosomes and degrades PtdIns(3)P on phagosomal membranes.
Figure 6.
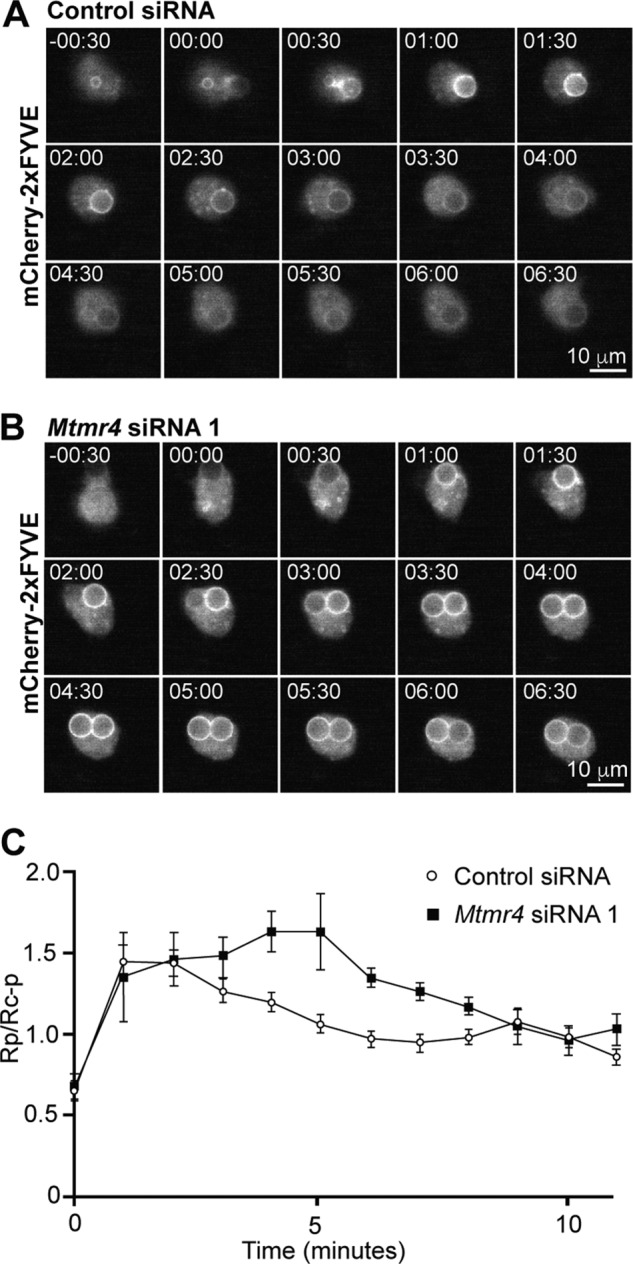
siRNA knockdown of Mtmr4 results in sustained phagosomal PtdIns(3)P signaling. A and B, RAW 264.7 cells were treated with control siRNA (A) or Mtmr4 siRNA 1 (B) for 48 h and then transfected with mCherry-2xFYVE and the following day imaged live during the phagocytosis of bIgG-6μm, with recording of mCherry fluorescence at 30-s intervals. Time = 00:00 was defined as the time of pseudopod closure around the first internalized bead. Scale bars, 10 μm. C, average mCherry fluorescence was quantitated, and Rp (phagosomal mCherry fluorescence)/Rc − p (total cellular mCherry fluorescence-phagosomal mCherry fluorescence) was calculated at each time point with n = 6–10 cells for each condition. Error bars, S.E. Images are representative of at least three independent experiments.
MTMR4 regulates the maturation of phagosomes containing pathogenic mycobacteria
As MTMR4 appears to regulate key components of the early phagocytic pathway, including the surface expression of FcγRs and phagosomal PtdIns(3)P levels, we also investigated whether MTMR4 is required for normal phagosomal maturation, which includes the acquisition of an acidic lumen and late endosome/lysosome markers (5, 6). Pathogenic mycobacteria secrete 3-phosphatases that degrade PtdIns(3)P and thus arrest phagosomal maturation and the lysosomal degradation of the bacteria (27, 28). Blockage of phagosomal maturation is observed with Mycobacterium tuberculosis or Mycobacterium marinum infection, but not Mycobacterium smegmatis, the latter a nonpathogenic mycobacteria (29, 30). As MTMR4 suppresses phagosomal PtdIns(3)P association, we examined whether Mtmr4 knockdown, which leads to prolonged phagosomal PtdIns(3)P signaling, alters the maturation of phagosomes containing M. marinum. To this end, RAW 264.7 cells transfected with control or Mtmr4 siRNA were infected with live GFP-M. marinum, and LysoTracker Red was used to detect acidic organelles (Fig. 7A). Maturation of phagosomes was assessed by scoring the percentage of engulfed GFP-expressing mycobacteria that colocalized with LysoTracker-positive compartments, as reported (30). In control siRNA cells, 38% of GFP-M. marinum phagosomes colocalized with LysoTracker Red after 2 h of chase, indicating that the majority of GFP-M. marinum resided in a nonacidic, immature phagosome (not colocalized), suggesting mycobacterial phagosomal arrest (Fig. 7B). Conversely, Mtmr4 knockdown resulted in 53% colocalization (p < 0.05, Fisher's exact test), suggesting increased phagosomal maturation (Fig. 7B). These results were confirmed by quantifying the colocalization of GFP-M. marinum with an alternative marker for maturation that detects late endosomes and lysosomes. In this experiment, mature phagosomes were detected by preload and chase of transfected RAW 264.7 cells with Alexa Fluor 555–dextran, which is incorporated into late endosomes and lysosomes (Fig. 7C) (31). In control siRNA cells, only 21% of GFP-M. marinum colocalized with dextran compartments, consistent with mycobacterial block of phagosome maturation, whereas Mtmr4 siRNA cells showed 36% colocalization of GFP-M. marinum with dextran compartments (p < 0.05, Fisher's exact test) (Fig. 7D). In control experiments, transfected RAW 264.7 cells were treated with either killed GFP-M. marinum (Fig. 7E) or nonpathogenic GFP-M. smegmatis (Fig. 7F), which do not arrest phagosomal maturation. The majority of killed GFP-M. marinum or GFP-M. smegmatis was trafficked to a mature phagosome, and depletion of MTMR4 did not further enhance phagosome maturation. Thus, prolongation of PtdIns(3)P signaling on phagosomes in Mtmr4-knockdown cells overcomes mycobacteria-induced phagosomal arrest, permitting traffic to acidic late endosomal and lysosomal compartments.
Figure 7.

siRNA knockdown of Mtmr4 results in increased maturation of phagosomes containing pathogenic M. marinum. A, RAW 264.7 cells were treated with control siRNA or Mtmr4 siRNA 1 for 72 h. Cells underwent synchronized phagocytosis of GFP-M. marinum for 2 h, after which they were incubated with LysoTracker Red to stain acidic compartments, prior to fixation and confocal microscopy. B, quantification of mycobacterial colocalization with acidic compartments in cells treated with control or Mtmr4 siRNA 1 as shown by the percentage of GFP-positive phagosomes not colocalizing or colocalizing with LysoTracker Red–positive compartments. Results are pooled from three independent experiments with 120 phagosomes analyzed for each condition. C, RAW 264.7 cells were treated with control or Mtmr4 siRNA 1 for 72 h. Late endosomal and lysosomal compartments were labeled by incubation with Alexa Fluor 555–dextran for 2 h prior to mycobacterial exposure. Cells underwent synchronized phagocytosis of live GFP-M. marinum for 2 h, prior to fixation and visualization by confocal microscopy. D, quantification of colocalization of M. marinum with late endosomal and lysosomal compartments as shown by the percentage of GFP-positive phagosomes not colocalizing or colocalizing with Alexa Fluor 555–dextran–positive compartments. Results are pooled from two independent experiments with 100–107 phagosomes analyzed for each condition. E and F, RAW 264.7 cells were treated with control or Mtmr4 siRNA 1 for 72 h prior to synchronized mycobacterial phagocytosis and 2-h chase and incubated with LysoTracker Red to label acidic compartments prior to fixation. E, quantification of LysoTracker Red colocalization with paraformaldehyde-killed GFP-M. marinum. Results are pooled from three independent experiments with 91–93 phagosomes analyzed for each condition. F, quantification of LysoTracker Red colocalization with nonpathogenic M. smegmatis. Results are pooled from two independent experiments with 60 phagosomes analyzed for each condition. *, p < 0.05, Fisher's exact test. Scale bars, 10 μm. Images are representative of at least three independent experiments.
Discussion
This is the first report describing the regulation of phagocytosis and phagocytic maturation in macrophages by the myotubularin PtdIns(3)P 3-phosphatase MTMR4. MTMR4 decreases macrophage surface levels of FcγRs, which are critical for the initiation of FcγR-mediated phagocytosis. Accordingly, MTMR4 depletion increases the efficiency of FcγR-mediated phagocytosis. Using live-cell imaging, we observed that phagosomal PtdIns(3)P formation precedes recruitment of MTMR4 to the phagosome, and MTMR4 temporally regulates the duration and amplitude of phagosomal PtdIns(3)P and, as a consequence, directs the maturation of the forming phagosome.
We were intrigued by previous findings that MTMR4 regulates the trafficking of transferrin in HeLa cells (12). Overexpression of MTMR4 blocks the sorting of transferrin out of early endosomes, and MTMR4 regulates the distribution of recycling endosomes (12). In resting cells, ligand-free FcγRs undergo constitutive cycles of endocytosis from the plasma membrane into early endosomes and sorting back to the plasma membrane via recycling endosomes (20). In this current study, surface levels of FcγRI were decreased in cells overexpressing HA-MTMR4. We did not see a significant change in the level of surface FcγRII/III in HA-MTMR4–expressing cells, possibly because of experimental limitations making the microscopic observation of subtle changes in immunofluorescent staining challenging. Conversely, we found that surface levels of both FcγRI and FcγRII/III were increased in cells treated with Mtmr4 siRNA. There is an emerging function for PtdIns(3)P in regulating the transfer of cargo from the early endosomes into recycling compartments (8, 32). One possible mechanism is via the sorting nexins, such as SNX4 and SNX17, and the interaction of their PX domains with early endosomal PtdIns(3)P to generate recycling tubules (8, 33, 34). Perturbed sorting of FcγRs out of early endosomes would, in turn, reduce the recycling of FcγR back to the plasma membrane. The polymerization of F-actin is essential for pseudopod extension and particle engulfment. As further evidence of reduced receptor expression at the cell surface, we observed that MTMR4-overexpressing cells showed lower levels of F-actin at phagocytic cups, presumably as a consequence of decreased FcγR signaling. It is thus possible that MTMR4, which colocalizes with early and recycling endosomes (12), reduces phagocytosis initiation by decreasing surface FcγR levels and therefore signaling through regulation of endocytic recycling, thereby compromising the ability of macrophages to form phagocytic cups (see proposed model, Fig. 8A).
Figure 8.

MTMR4 potentially regulates phagocytosis by two mechanisms. A, recycling of FcγRs under conditions of low and high levels of MTMR4 (shown in blue). MTMR4 associates with early and recycling endosomes (EE/RE) where it dephosphorylates PtdIns(3)P, potentially resulting in reduced recycling and therefore reduced FcγR surface levels. B, FcγR-mediated phagocytosis of a pathogen under conditions of low and high levels of MTMR4. High levels of MTMR4 reduce FcγR surface levels, resulting in reduced initiation of phagocytosis. MTMR4 also localizes to the phagosome, where PtdIns(3)P dephosphorylation potentially reduces phagosome maturation and fusion with lysosomes. PtdIns(3)P-dependent phagosomal arrest induced by pathogenic mycobacteria may thus be overcome by MTMR4 depletion, which prolongates PtdIns(3)P signaling on phagosomes.
Although our results were generated using the widely used RAW 264.7 cell line as a representative for mammalian macrophages, validation using multiple cell lines would be of interest in future studies. Our finding that MTMR4 negatively regulates phagocytosis in RAW 264.7 macrophages is concordant with experiments in C. elegans demonstrating that the myotubularin, MTM-1, negatively regulates the internalization of apoptotic cells (35, 36). The observed negative effect of MTMR4 on internalization may be mediated through regulation of PtdIns(3)P, and consistent with this, pretreatment with the PI3K inhibitor LY294002 abrogated the enhanced phagocytosis observed in Mtmr4 siRNA cells compared with controls. In the C. elegans model, Zou et al. (36) proposed that MTM-1 may regulate a pool of phagosomal PtdIns(3)P on the plasma membrane. However, although plasma membrane PtdIns(3)P has been noted in muscle cells and adipocytes during insulin signaling, we and other studies have found that the 2xFYVE probe does not localize to phagocytic pseudopods but appears at later time points on internalized phagosomal membranes (4, 5, 26, 37–39). Together, these observations indicate a PtdIns(3)P-dependent process determining phagocytic ability early in particle engulfment. Our presented results suggest that one such process might be the endocytic recycling of FcγRs. Whether PtdIns(3)P also plays a direct role in the early stages of phagocytosis is unclear; however, its presence at the phagosome has been shown here and elsewhere (4).
Phagosomal PtdIns(3)P regulates phagosomal maturation and inhibition of the Class III PI3K disrupts phagosomal maturation (5, 28). Mycobacteria subvert their own degradation as they reside in an immature phagosome and reduce phagosomal PtdIns(3)P via the secretion of bacterial 3-phosphatases, such as SapM and MptpB (28, 40). As shown here, Mtmr4 siRNA cells exhibited increased maturation of M. marinum–containing phagosomes. This suggests that the delay in turnover of phagosomal PtdIns(3)P in Mtmr4 siRNA–treated cells is able to partially overcome the maturation block induced by mycobacteria and counteract the effect of the pathogen-secreted 3-phosphatase virulence factors. Inhibition of phagosomal maturation may thus represent a second mechanism by which MTMR4 regulates phagocytosis (Fig. 8B). Prolonged phagosomal PtdIns(3)P as observed in Mtmr4 siRNA cells may increase the recruitment of effectors such as EEA1 and Hrs to the phagosome cytosol interface, to promote membrane fusion and the development of multivesicular bodies, respectively (6, 41). Additionally, there is evidence that some phagosomes have cyclic alterations in PtdIns(3)P (42, 43). It is of interest to speculate that interruption of regulated turnover of PtdIns(3)P on phagosomes may alter the ordered recruitment of effectors or the conversion of early to mature Rab effectors (8).
During phagocytosis, there is a highly regulated temporal and spatial restriction of various phosphoinositides at the phagocytic cup and phagosome generated by distinct phosphoinositide kinases and phosphatases at the cytosolic/membrane interface (4, 5, 8, 44, 45). Ectopically expressed MTM1, which has a catalytic 3-phosphatase domain and a PH-GRAM domain, but lacks a FYVE domain, is recruited to the phagosome in RAW 264.7 macrophages and PLB-985 myeloid leukemia cells (28, 46). Knockdown of MTM1 in PLB-985 cells led to increased magnitude and duration of phagosomal PtIns(3)P (46). Although this study did not examine phagocytosis in macrophages, the potential redundancy of certain myotubularin family members in the subcellular regulation of membrane PtdIns(3)P would be interesting to investigate further. Hazeki et al. (47) reported that FYVE finger-containing phosphoinositide kinase (PIKfyve) and phosphatase and tensin homolog (PTEN), but not MTMR2, regulated phagosomal PtdIns(3)P. PIKfyve acts in a multiprotein complex to generate PtdIns(3,5)P2 from PtdIns(3)P (48), and it has been reported that decreasing PIKfyve decreases phagocytosis and phagosomal maturation (49). The tumor suppressor PTEN exhibits a 1000-fold greater activity toward PtdIns(3,4,5)P3 than PtdIns(3)P, and notably PTEN does not localize to the phagosome (50, 51). It is possible that PTEN knockdown cells have increased PtdIns(3,4,5)P3 at the phagocytic pseudopods, with sequential 5-phosphatase and 4-phosphatase action leading to increased PtdIns(3,4)P2 and phagosomal PtdIns(3)P, respectively (47, 50, 52). Of interest, Src homology 2 domain–containing inositol polyphosphate 5-phosphatase (SHIP1), a PtdIns(3,4,5)P3 5-phosphatase, regulates PtdIns(3)P levels indirectly. Ship1 knockout mice also exhibit prolonged phagosomal PtdIns(3)P potentially by a process similar to that in PTEN knockdown cells (53). Such alternate mechanisms for the removal of PtdIns(3)P from the phagosome are consistent with our observation that the phagosomal PtdIns(3)P presence was prolonged, yet PtdIns(3)P was eventually degraded in cells treated with Mtmr4 siRNA. In future experiments, it would be of interest to study PtdIns(3)P kinetics in cells depleted of more than one phosphoinositide phosphatase.
In summary, we have demonstrated the dynamic recruitment of a myotubularin 3-phosphatase, MTMR4, to the phagosome in RAW 264.7 macrophages and demonstrated MTMR4 regulation of FcγR levels and phagosomal PtdIns(3)P contributes to the regulation of phagosomal initiation and maturation. Therefore, our studies identify a novel mechanism for the coordinated termination of PtdIns(3)P signaling on macrophage phagosomes.
Experimental procedures
Materials
All reagents were from Sigma-Aldrich (Castle Hill, New South Wales, Australia) unless specified. DMEM and fluorescent conjugates were from Invitrogen (Mt. Waverley, Victoria, Australia). Anti-MTMR4 polyclonal antibody has been described previously (12). Anti-HA was from Covance (Princeton, NJ), anti-FcγR I and II/III were from BD (North Ryde, New South Wales, Australia), and 6–9-μm beads were from Bangs Laboratories (Carmel, IN).
Constructs
HA-MTMR4 and HA-MTMR4(C407A) have been described (12). YFP- MTMR4 was a gift from Jocelyn Laporte (Strasbourg, France) (54). mCherry-2xFYVE was provided by Harald Stenmark (Institute for Cancer Research, Oslo, Norway).
Cell culture and transfection
RAW 264.7 cells (ATCC, Manassas, VA) were grown in DMEM supplemented with 10% FCS and 2 mm l-glutamine. Cells were seeded onto glass coverslips (#1.5, 0.17 mm) or 0.01% poly-l-lysine–coated 8-well microslides (Ibidi, Munich, Germany) and transfected using Lipofectamine-LTX (Invitrogen) at a DNA/Plus reagent/LTX reagent ratio of 1:0.5:1.5. For siRNA knockdown, Accell Mtmr4 siRNA (siRNA 1) (Thermo Fisher Scientific) target sequence CUCUCUACCUGGAUGAUGA targeting Mtmr4 exon 16 (catalog no. 040162-15-0050) or Accell negative control sequence (catalog no. 001910-01-50) was added at 1 μm in serum-free Accell delivery medium for 72 h. Before experiments, serum-free delivery medium was removed and replaced with DMEM containing 5% FCS. Alternative Mtmr4 siRNA 2 and 3 were from Ambion (Austin, TX); siRNA 2 GGAUGACUUUACGUGUUUA targeting Mtmr4 exons 16–17 (catalog no. s100732), siRNA 3 CGCAACAUCUAUAAACGGA targeting exon 14 (catalog no. s100733), or negative control siRNA (catalog no. SIO3650318, AllStars, Qiagen, Germantown, MD) was transfected at 10 nm using Lipofectamine or Lipofectamine RNAiMAX (Invitrogen) according to the manufacturer's protocol for 48–72 h.
Immunoblotting
To assess endogenous MTMR4 or recombinant HA-MTMR4 expression in macrophages, RAW 264.7 cells were lysed at 4 °C in lysis buffer (50 mm Tris, 2 mm EDTA, 1% Triton X-100, 150 mm NaCl, protease inhibitor mixture (Roche Applied Science, catalog no. 11836153001)). After centrifugation, proteins in the Triton X-100–soluble fraction were resuspended in SDS-PAGE sample buffer (62.5 mm Tris-HCl, pH 6.8, 2% SDS, 10% glycerol, 50 mm DTT, 0.01% bromphenol blue) and separated by 7.5% SDS-PAGE under reducing conditions, transferred onto a nitrocellulose membrane, blocked in Tris-buffered saline (TBS: 20 mm Tris, 150 mm NaCl, pH 7.4) supplemented with 5% skim milk, and then detected by incubation for 16 h at 4 °C with a rabbit polyclonal antibody raised against a purified recombinant MTMR4 peptide (1:4) or a mouse monoclonal anti-HA antibody (0.1 μg/ml), respectively. The blots were incubated for 1 h at room temperature with secondary antibodies (polyclonal anti-mouse IgG-horseradish peroxidase (Chemicon, Temecula, CA). All washing between the steps was carried out with 0.05% Tween 20 in TBS. Blots were developed using Enhanced Chemiluminescence reagent (Western Lightning Plus, PerkinElmer Life Sciences) and exposure to X-ray film for the appropriate times, and films were developed.
Immunofluorescence staining
RAW 264.7 cells were fixed in 3% paraformaldehyde, permeabilized with 0.1% Triton X-100 in PBS for 2 min and blocked with 5% goat serum or 3% BSA prior to incubation with primary and then secondary antibodies with PBS washes in between antibody incubation steps. Coverslips were mounted with Slowfade gold reagent (Invitrogen), and imaging was conducted by confocal or wide-field microscopy.
In experiments carried out to detect FcγRs on transfected cells, unpermeabilized cells were first stained with mouse Alexa 647–conjugated anti-FcγRI (CD64) (catalog no. 558539, BD Pharmingen) and/or rat anti-FcγRII/III IgG2b (clone 2.4G2; catalog no. 553141, BD Pharmingen). Cells were further stained with a fluorescent conjugated secondary chicken anti-mouse-647 and/or donkey anti-rat-488 antibody. In experiments where cells were transfected with HA-vector or HA-MTMR4, cells were permeabilized after FcγR staining and stained again with mouse monoclonal anti-HA (Covance, Princeton, NJ) and then anti-mouse IgG-Alexa Fluor 594 to detect transfected cells.
In experiments carried out to image and quantify phagocytosis using IgG-opsonized latex beads, fixed, unpermeabilized samples were first blocked then incubated with anti-human IgG-Alexa Fluor 594 secondary antibodies for 10 min to identify noninternalized beads. Samples were then washed, permeabilized, and reblocked before incubation with primary and secondary antibodies with fluorophores other than 594. The primary mouse anti-HA antibody was detected by secondary anti-mouse IgG Alexa Fluor 488, unless F-actin was assessed using Alexa 488-phalloidin, in which case the primary anti-HA antibody was detected by secondary anti-mouse IgG Alexa Fluor 594.
Quantitation of external FcγRs in RAW 264.7 cells using immunofluorescent microscopy
RAW 264.7 cells stained with anti-FcγR antibodies were imaged with a Leica SP5 5 channel confocal microscope PL APO ×100 objective oil immersion NA 1.4, using LASAF software. Images were analyzed using ImageJ (National Institutes of Health), using the line tool. For overexpression studies, where cell numbers were limited by transfection, 50 lines were placed haphazardly transecting the plasma membrane, and the maximum fluorescence per line was recorded and averaged for each cell. For siRNA studies, where many more cells could be analyzed, four lines were placed per cell transecting the plasma membrane, and the maximum fluorescence was calculated and averaged for each cell.
RNA isolation and relative quantitative RT-PCR
For RT-PCR analysis, cells were lysed and RNA was purified using an RNeasy RNA extraction kit according to the manufacturer's instructions (Qiagen catalog no. 74104). RT-PCR was conducted on samples containing 10 ng of RNA in a two-step reaction using a Quantitect SYBR Green PCR kit (Qiagen) in 20-ml reactions run in triplicate in a Rotorgene 3000 real-time cycler (Corbett, Monash Biochemistry Imaging Facility). Primers were used to amplify mouse Mtmr4 and Gapdh cDNA (Quantitect Qiagen catalog nos. QT00148757 and QT01658692, respectively). The -fold difference in Mtmr4 mRNA in control versus Mtmr4 siRNA cells was calculated as described (55), using Gapdh as internal control.
Flow cytometry analysis of FcγRI and FcγRII/III in Mtmr4-knockdown cells
For cell-surface staining, Mtmr4 siRNA– and control siRNA–transfected cells were detached with 0.5 mm EDTA, 1% fetal bovine serum in PBS, pelleted by centrifugation, and then washed in PBS followed by one wash in stain buffer (2% BSA, 0.1% sodium azide in PBS). After centrifugation and aspiration of the supernatant, the cell pellet was gently resuspended in stain buffer at 1 × 10⁶ cells/100 μl. 100-μl aliquots of cells were then stained with Alexa Fluor 647-mouse anti-mouse FcγRI IgG1 (clone X54–5/7.1; 558539, BD Pharmingen), rat anti-mouse FcγRII/III IgG2b (also called mouse BD Fc block; clone 2.4G2; 553141, BD Pharmingen), Alexa Fluor 647-mouse IgG1 isotype control (clone MOPC-21; 557732, BD Pharmingen), or 647-rat IgG control (Thermo Fisher Scientific, catalog no. A-21247) on ice for 45 min away from light. Cells were then washed in stain buffer, centrifuged, and resuspended in 0.1% PFA, 2% glucose solution. FcγRII/III-stained cells were further stained with a fluorescent conjugated secondary anti-rat-647 antibody on ice for 45 min away from light. Cells were washed in stain buffer, centrifuged, and resuspended in 0.1% PFA, 2% glucose solution. Cells remained on ice away from light until analysis by flow cytometry. For intracellular staining, transfected cells were washed in PBS followed by fixation in 4% PFA for 10–15 min at room temperature. After several washes in stain buffer, cells were resuspended in ice-cold 100% methanol and permeabilized for 20 min on ice. Cells were then washed several times in stain buffer and resuspended in stain buffer at 1 × 10⁶ cells/100 μl. Staining was then performed as described for cell-surface staining. 10,000 cells from controls and test samples were analyzed using a Cyan ADP analyzer and Summit version 4.3.1 software (Beckman Coulter, Lane Cove, New South Wales, Australia). Gates were set around unstained cells and cells stained with isotype controls based on their forward/sideward light scatter pattern. FcγRI and FcγRIII/II cell-surface and intracellular expression levels (median fluorescence intensity) for Mtmr4 siRNA transfected cells were expressed relative to control cells. Data analysis was performed using FlowJo version 10.1 data analysis software (FlowJo LLC, Ashland, OR).
Phagocytosis of IgG-opsonized beads
3-, 6-, and 9-μm latex beads were opsonized in human IgG by resuspension in thawed aliquots of 1 mg/ml human IgG with a volume ratio of 1:2.5 (45). RAW 264.7 cells were incubated with IgG-opsonized latex beads in 5% DMEM (for Accell siRNA experiments) or 10% FCS (for overexpression and Ambion siRNA experiments) on ice for 5 min and then at 37 °C for 15 min. Cells were then fixed and stained with Alexa Fluor 594 anti-IgG to detect external beads. Internalized beads were identified by a combination of bright-field and fluorescence microscopy, and the phagocytic index was scored as the number of beads internalized per 100 cells. For the inhibition of PI3K signaling, cells were pretreated with 100 μm LY294002 for 30 min. All results within independent experiments were normalized to that of the control condition (45). Cells were examined on an Olympus Provis wide-field microscope using UPLAN ×20 oil immersion objective NA 0.8 and UPLAN ×40 oil immersion objectives NA 1, acquired with an FView2 camera and Olympus analaSIS software, and images were analyzed using ImageJ.
Quantitation of actin in transfected cells
RAW 264.7 cells stained with Alexa Fluor 488-phalloidin were imaged using a Leica SP5 five-channel confocal microscope PL APO ×100 objective oil immersion NA 1.4, using LASAF software. For quantitation of phagosomal actin, only pseudopods that were extending parallel to the plane of the coverslip and had not yet fused circumferentially were measured, to ensure similar temporal stages between phagosomes. The ImageJ freehand tool was used to outline the pseudopods, and the average fluorescence in this region of interest was recorded.
Live-cell imaging of YFP-MTMR4 during phagocytosis
RAW 264.7 cells were grown on glass coverslips and transfected with 3 μg of YFP-MTMR4 and 2 μg of CFP empty vector (used as a cytoplasmic fluorescent control). 24 h later, cells were washed, and medium was replaced with DMEM HEPES containing 10% FCS and bIgG-6μm added before live visualization. Imaging was performed using a Leica LX6000 wide-field microscope, 37 °C humidified chamber, PL APO ×63 water immersion objective NA 1.2, using LASAF software. Quantitation of YFP-MTMR4 and CFP at the phagosome was performed using Metamorph software as described previously (26). The fluorescent images were each subjected to background subtraction. A binary mask was made by the addition of both fluorescent images and application of a manual threshold. The YFP image was multiplied by 1000 and divided by the CFP image to give a divided image. Binary and divided images were combined using the AND process, so that extracellular signal was excluded, and only signal in the divided channel present was within the mask. A square-shaped region of interest was placed around the phagosome and another slightly larger square around this for particle tracking in the bright-field channel using the cross-correlation centroid-tracking algorithm. Manual readjustment was performed where automatic tracking became erroneous. Regions tracked in the bright-field channel were transferred to the divided image, and measurements were taken of 1000 × YFP/CFP signal in the phagosomal region (Rp). At each time point, the entire cell fluorescence in the divided image was also measured to give 1000 × YFP/CFP (Rc). The phagosomal fluorescence at each time point was normalized to cellular fluorescence by calculating Rp/Rc.
Live-cell imaging of mCherry-2xFYVE during phagocytosis
For quantification of PtdIns(3)P during phagocytosis, cells on 25-mm glass coverslips were cotransfected with 5 μg of HA-vector, HA-MTMR4, or HA-MTMR4(C407A) together with 0.5 μg of mCherry-2xFYVE. Cells were resuspended in DMEM-HEPES plus 10% FCS and imaged live following the addition of bIgG-6μm. Time-lapse imaging was conducted with recording of mCherry fluorescence at 15-s intervals using a Leica LX6000 wide-field microscope, 37 °C humidified chamber, PL APO ×63 water immersion objective NA 1.2, and LASAF software. Alternatively, cells seeded to poly-l-lysine–coated microchamber slides were transfected with Mtmr4 or control siRNA for 48 h in manufacturer-supplied serum-free media, followed by transfection with mCherry-2xFYVE for an additional 24 h. Cells were resuspended in 5% DMEM 1 h prior to experiments and then imaged live during phagocytosis suspended in DMEM-HEPES plus 5% FCS as above, using a LX6000 wide-field microscope, 37 °C humidified chamber, and FLUOTAR ×40 oil immersion objective NA 1.0, with images acquired at 30-s intervals.
Phagosomal mCherry-2xFYVE was quantified using ImageJ by measuring the average fluorescence in a circular region of interest manually placed around the phagosome at each time point. This was normalized for probe expression within the rest of the cell by dividing by the average cellular fluorescence less the average phagosomal fluorescence (region cell minus region phagosome (Rc − p)), to give Rp/Rc − p at each time point.
Bacterial culture
GFP-M. marinum and GFP-M. smegmatis were a gift from Dr. Nick Tobias (Monash University) (56). GFP-M. marinum and GFP-M. smegmatis were cultured by inoculation of glycerol stocks into Middlebrook 7H9 broth (Difco, catalog no. 271310) supplemented with 0.05% Tween 80 (Sigma-Aldrich, catalog no. P4780) and 10% OADC (0.06% oleic acid, 5% bovine albumin fraction V, 5% dextrose, 2% catalase (Difco BD BBL, catalog no. 211886)) at 30 and 37 °C, respectively. For experiments using killed mycobacteria, mycobacterial cultures were pelleted by centrifugation and resuspended in 3% paraformaldehyde for 20 min, followed by three washes in PBS.
Analysis of mycobacterial phagosomal maturation in Mtmr4-knockdown cells
RAW 264.7 cells were incubated on ice for 20 min with 1 × 10⁷ mycobacteria, washed, and chased for 2 h at 37 °C. 30 min prior to fixation, cells were incubated with LysoTracker Red at 1:5000. Alternatively, to label late endosomal/lysosomal compartments, cells were first incubated with 42 μg/ml fluorescent dextran 10,000 Mr for 1 h and chased for 2 h, prior to infection as above. The number of GFP-mycobacteria that colocalized with LysoTracker Red or, in alternative experiments, dextran was scored using a Leica SP5 five-channel confocal microscope, PL APO ×63 oil immersion objective NA 1.4, acquired with LASAF software.
Statistical analyses
Statistical tests were performed using GraphPad Prism version 5 (GraphPad software, La Jolla, CA) and are detailed in each figure legend. p < 0.05 was considered significant.
Image presentation
For image presentation, brightness/contrast adjustments were kept constant between different conditions and applied to the entire image, and no nonlinear adjustments were performed.
Author contributions
D. A. S. and C. A. M. conceptualization; D. A. S. data curation; D. A. S., M. R. J., S. J. F., and C. A. M. formal analysis; D. A. S., R. L. C., and C. A. M. funding acquisition; D. A. S. and M. R. J. validation; D. A. S., S. J. F., A. S., and M. J. N. investigation; D. A. S., M. R. J., and S. J. F. visualization; D. A. S., R. L. C., and C. A. M. methodology; D. A. S. writing-original draft; D. A. S. and M. R. J. writing-review and editing; M. C. B., A. S., J. M. D., and R. L. C. resources; R. L. C. and C. A. M. supervision.
Supplementary Material
Acknowledgment
We acknowledge the facilities, scientific and technical assistance of Monash Micro Imaging (Monash University, Clayton, Victoria, Australia).
This work was supported by National Health and Medical Research Council Australia (NHMRC) Project Grant 545989 and Cancer Council Victoria (Australia) Grant APP1143557. The authors declare that they have no conflicts of interest with the contents of this article.
This article contains Figs. S1 and S2 and Movies S1–S6.
- FcγR
- Fcγ receptor
- PtdIns(3)P
- phosphatidylinositol 3-phosphate
- PtdIns(3,5)P2
- phosphatidylinositol 3,5-bisphosphate
- PtdIns(3,4,5)P3
- phosphatidylinositol 3,4,5-trisphosphate
- bIgG-6μm
- -3μm, and 9μm, 6-, 3-, and 9-μm IgG-opsonized latex beads, respectively
- EEA1
- early endosome antigen 1
- Hrs
- hepatocyte growth factor–regulated tyrosine kinase substrate
- PX
- phox
- PI3K
- phosphoinositide 3-kinase
- MTMR4
- myotubularin-related protein-4
- CFP
- cyan fluorescent protein
- YFP
- yellow fluorescent protein
- 2xFYVE
- mCherry-2xFYVE
- PIKfyve
- FYVE finger-containing phosphoinositide kinase
- PTEN
- phosphatase and tensin homolog
- SHIP1
- Src homology 2 domain–containing inositol polyphosphate 5-phosphatase
- DMEM
- Dulbecco's modified Eagle's medium
- FCS
- fetal calf serum
- NA
- numeric aperture
- GAPDH
- glyceraldehyde-3-phosphate dehydrogenase
- PFA
- paraformaldehyde.
References
- 1. Flannagan R. S., Cosío G., and Grinstein S. (2009) Antimicrobial mechanisms of phagocytes and bacterial evasion strategies. Nat. Rev. Microbiol. 7, 355–366 10.1038/nrmicro2128 [DOI] [PubMed] [Google Scholar]
- 2. Poon I. K., Hulett M. D., and Parish C. R. (2010) Molecular mechanisms of late apoptotic/necrotic cell clearance. Cell Death Differ. 17, 381–397 10.1038/cdd.2009.195 [DOI] [PubMed] [Google Scholar]
- 3. Yeung T., Ozdamar B., Paroutis P., and Grinstein S. (2006) Lipid metabolism and dynamics during phagocytosis. Curr. Opin. Cell Biol. 18, 429–437 10.1016/j.ceb.2006.06.006 [DOI] [PubMed] [Google Scholar]
- 4. Ellson C. D., Anderson K. E., Morgan G., Chilvers E. R., Lipp P., Stephens L. R., and Hawkins P. T. (2001) Phosphatidylinositol 3-phosphate is generated in phagosomal membranes. Curr. Biol. 11, 1631–1635 10.1016/S0960-9822(01)00447-X [DOI] [PubMed] [Google Scholar]
- 5. Vieira O. V., Botelho R. J., Rameh L., Brachmann S. M., Matsuo T., Davidson H. W., Schreiber A., Backer J. M., Cantley L. C., and Grinstein S. (2001) Distinct roles of class I and class III phosphatidylinositol 3-kinases in phagosome formation and maturation. J. Cell Biol. 155, 19–25 10.1083/jcb.200107069 [DOI] [PMC free article] [PubMed] [Google Scholar]
- 6. Vieira O. V., Harrison R. E., Scott C. C., Stenmark H., Alexander D., Liu J., Gruenberg J., Schreiber A. D., and Grinstein S. (2004) Acquisition of Hrs, an essential component of phagosomal maturation, is impaired by mycobacteria. Mol. Cell. Biol. 24, 4593–4604 10.1128/MCB.24.10.4593-4604.2004 [DOI] [PMC free article] [PubMed] [Google Scholar]
- 7. Marat A. L., and Haucke V. (2016) Phosphatidylinositol 3-phosphates: at the interface between cell signalling and membrane traffic. EMBO J. 35, 561–579 10.15252/embj.201593564 [DOI] [PMC free article] [PubMed] [Google Scholar]
- 8. Cullen P. J., and Carlton J. G. (2012) Phosphoinositides in the mammalian endo-lysosomal network. Subcell. Biochem. 59, 65–110 10.1007/978-94-007-3015-1_3 [DOI] [PMC free article] [PubMed] [Google Scholar]
- 9. Davies E. M., Sheffield D. A., Tibarewal P., Fedele C. G., Mitchell C. A., and Leslie N. R. (2012) The PTEN and myotubularin phosphoinositide 3-phosphatases: linking lipid signalling to human disease. Subcell. Biochem. 58, 281–336 10.1007/978-94-007-3012-0_8 [DOI] [PubMed] [Google Scholar]
- 10. Laporte J., Bedez F., Bolino A., and Mandel J.-L. (2003) Myotubularins, a large disease-associated family of cooperating catalytically active and inactive phosphoinositides phosphatases. Hum. Mol. Genet. 12, R285–R292 10.1093/hmg/ddg273 [DOI] [PubMed] [Google Scholar]
- 11. Lorenzo O., Urbé S., and Clague M. J. (2006) Systematic analysis of myotubularins: heteromeric interactions, subcellular localisation, and endosome-related functions. J. Cell Sci. 119, 2953–2959 10.1242/jcs.03040 [DOI] [PubMed] [Google Scholar]
- 12. Naughtin M. J., Sheffield D. A., Rahman P., Hughes W. E., Gurung R., Stow J. L., Nandurkar H. H., Dyson J. M., and Mitchell C. A. (2010) The myotubularin phosphatase MTMR4 regulates sorting from early endosomes. J. Cell Sci. 123, 3071–3083 10.1242/jcs.060103 [DOI] [PubMed] [Google Scholar]
- 13. Plant P. J., Correa J., Goldenberg N., Bain J., and Batt J. (2009) The inositol phosphatase MTMR4 is a novel target of the ubiquitin ligase Nedd4. Biochem. J. 419, 57–63 10.1042/BJ20081866 [DOI] [PMC free article] [PubMed] [Google Scholar]
- 14. Taguchi-Atarashi N., Hamasaki M., Matsunaga K., Omori H., Ktistakis N. T., Yoshimori T., and Noda T. (2010) Modulation of local Ptdins3P levels by the PI phosphatase MTMR3 regulates constitutive autophagy. Traffic 11, 468–478 10.1111/j.1600-0854.2010.01034.x [DOI] [PubMed] [Google Scholar]
- 15. Pedersen N. M., Raiborg C., Brech A., Skarpen E., Roxrud I., Platta H. W., Liestøl K., and Stenmark H. (2012) The PtdIns3P-binding protein Phafin 2 mediates epidermal growth factor receptor degradation by promoting endosome fusion. Traffic 13, 1547–1563 10.1111/j.1600-0854.2012.01400.x [DOI] [PubMed] [Google Scholar]
- 16. Yu J., Pan L., Qin X., Chen H., Xu Y., Chen Y., and Tang H. (2010) MTMR4 attenuates transforming growth factor β (TGFβ) signaling by dephosphorylating R-Smads in endosomes. J. Biol. Chem. 285, 8454–8462 10.1074/jbc.M109.075036 [DOI] [PMC free article] [PubMed] [Google Scholar]
- 17. Bruhns P. (2012) Properties of mouse and human IgG receptors and their contribution to disease models. Blood 119, 5640–5649 10.1182/blood-2012-01-380121 [DOI] [PubMed] [Google Scholar]
- 18. van der Poel C. E., Spaapen R. M., van de Winkel J. G., and Leusen J. H. (2011) Functional characteristics of the high affinity IgG receptor, FcγRI. J. Immunol. 186, 2699–2704 10.4049/jimmunol.1003526 [DOI] [PubMed] [Google Scholar]
- 19. Swanson J. A., and Hoppe A. D. (2004) The coordination of signaling during Fc receptor-mediated phagocytosis. J. Leukoc. Biol. 76, 1093–1103 10.1189/jlb.0804439 [DOI] [PubMed] [Google Scholar]
- 20. Mellman I. S., Plutner H., Steinman R. M., Unkeless J. C., and Cohn Z. A. (1983) Internalization and degradation of macrophage Fc receptors during receptor-mediated phagocytosis. J. Cell Biol. 96, 887–895 10.1083/jcb.96.3.887 [DOI] [PMC free article] [PubMed] [Google Scholar]
- 21. Greenberg S., el Khoury J., di Virgilio F., Kaplan E. M., and Silverstein S. C. (1991) Ca2+-independent F-actin assembly and disassembly during Fc receptor-mediated phagocytosis in mouse macrophages. J. Cell Biol. 113, 757–767 10.1083/jcb.113.4.757 [DOI] [PMC free article] [PubMed] [Google Scholar]
- 22. Bajno L., Peng X. R., Schreiber A. D., Moore H. P., Trimble W. S., and Grinstein S. (2000) Focal exocytosis of VAMP3-containing vesicles at sites of phagosome formation. J. Cell Biol. 149, 697–706 10.1083/jcb.149.3.697 [DOI] [PMC free article] [PubMed] [Google Scholar]
- 23. Niedergang F., Colucci-Guyon E., Dubois T., Raposo G., and Chavrier P. (2003) ADP ribosylation factor 6 is activated and controls membrane delivery during phagocytosis in macrophages. J. Cell Biol. 161, 1143–1150 10.1083/jcb.200210069 [DOI] [PMC free article] [PubMed] [Google Scholar]
- 24. Huynh K. K., Kay J. G., Stow J. L., and Grinstein S. (2007) Fusion, fission, and secretion during phagocytosis. Physiology (Bethesda) 22, 366–372 10.1152/physiol.00028.2007 [DOI] [PubMed] [Google Scholar]
- 25. Dewitt S., Darley R. L., and Hallett M. B. (2009) Translocation or just location? Pseudopodia affect fluorescent signals. J. Cell Biol. 184, 197–203 10.1083/jcb.200806047 [DOI] [PMC free article] [PubMed] [Google Scholar]
- 26. Henry R. M., Hoppe A. D., Joshi N., and Swanson J. A. (2004) The uniformity of phagosome maturation in macrophages. J. Cell Biol. 164, 185–194 10.1083/jcb.200307080 [DOI] [PMC free article] [PubMed] [Google Scholar]
- 27. Beresford N. J., Mulhearn D., Szczepankiewicz B., Liu G., Johnson M. E., Fordham-Skelton A., Abad-Zapatero C., Cavet J. S., and Tabernero L. (2009) Inhibition of MptpB phosphatase from Mycobacterium tuberculosis impairs mycobacterial survival in macrophages. J. Antimicrob. Chemother. 63, 928–936 10.1093/jac/dkp031 [DOI] [PubMed] [Google Scholar]
- 28. Vergne I., Chua J., Lee H. H., Lucas M., Belisle J., and Deretic V. (2005) Mechanism of phagolysosome biogenesis block by viable Mycobacterium tuberculosis. Proc. Natl. Acad. Sci. U.S.A. 102, 4033–4038 10.1073/pnas.0409716102 [DOI] [PMC free article] [PubMed] [Google Scholar]
- 29. Anes E., Peyron P., Staali L., Jordao L., Gutierrez M. G., Kress H., Hagedorn M., Maridonneau-Parini I., Skinner M. A., Wildeman A. G., Kalamidas S. A., Kuehnel M., and Griffiths G. (2006) Dynamic life and death interactions between Mycobacterium smegmatis and J774 macrophages. Cell. Microbiol. 8, 939–960 10.1111/j.1462-5822.2005.00675.x [DOI] [PubMed] [Google Scholar]
- 30. Tan T., Lee W. L., Alexander D. C., Grinstein S., and Liu J. (2006) The ESAT-6/CFP-10 secretion system of Mycobacterium marinum modulates phagosome maturation. Cell. Microbiol. 8, 1417–1429 10.1111/j.1462-5822.2006.00721.x [DOI] [PubMed] [Google Scholar]
- 31. Sun J., Deghmane A. E., Soualhine H., Hong T., Bucci C., Solodkin A., and Hmama Z. (2007) Mycobacterium bovis BCG disrupts the interaction of Rab7 with RILP contributing to inhibition of phagosome maturation. J. Leukoc. Biol. 82, 1437–1445 10.1189/jlb.10.1189 [DOI] [PubMed] [Google Scholar]
- 32. Jean S., Cox S., Schmidt E. J., Robinson F. L., and Kiger A. (2012) Sbf/MTMR13 coordinates PI(3)P and Rab21 regulation in endocytic control of cellular remodeling. Mol. Biol. Cell 23, 2723–2740 10.1091/mbc.e12-05-0375 [DOI] [PMC free article] [PubMed] [Google Scholar]
- 33. Lauffer B. E., Melero C., Temkin P., Lei C., Hong W., Kortemme T., and von Zastrow M. (2010) SNX27 mediates PDZ-directed sorting from endosomes to the plasma membrane. J. Cell Biol. 190, 565–574 10.1083/jcb.201004060 [DOI] [PMC free article] [PubMed] [Google Scholar]
- 34. Traer C. J., Rutherford A. C., Palmer K. J., Wassmer T., Oakley J., Attar N., Carlton J. G., Kremerskothen J., Stephens D. J., and Cullen P. J. (2007) SNX4 coordinates endosomal sorting of TfnR with dynein-mediated transport into the endocytic recycling compartment. Nat. Cell Biol. 9, 1370–1380 10.1038/ncb1656 [DOI] [PubMed] [Google Scholar]
- 35. Neukomm L. J., Nicot A. S., Kinchen J. M., Almendinger J., Pinto S. M., Zeng S., Doukoumetzidis K., Tronchère H., Payrastre B., Laporte J. F., and Hengartner M. O. (2011) The phosphoinositide phosphatase MTM-1 regulates apoptotic cell corpse clearance through CED-5-CED-12 in C. elegans. Development 138, 2003–2014 10.1242/dev.060012 [DOI] [PubMed] [Google Scholar]
- 36. Zou W., Lu Q., Zhao D., Li W., Mapes J., Xie Y., and Wang X. (2009) Caenorhabditis elegans myotubularin MTM-1 negatively regulates the engulfment of apoptotic cells. PLoS Genet. 5, e1000679 10.1371/journal.pgen.1000679 [DOI] [PMC free article] [PubMed] [Google Scholar]
- 37. Falasca M., Hughes W. E., Dominguez V., Sala G., Fostira F., Fang M. Q., Cazzolli R., Shepherd P. R., James D. E., and Maffucci T. (2007) The role of phosphoinositide 3-kinase C2α in insulin signaling. J. Biol. Chem. 282, 28226–28236 10.1074/jbc.M704357200 [DOI] [PubMed] [Google Scholar]
- 38. Kong A. M., Horan K. A., Sriratana A., Bailey C. G., Collyer L. J., Nandurkar H. H., Shisheva A., Layton M. J., Rasko J. E. J., Rowe T., and Mitchell C. A. (2006) Phosphatidylinositol 3-phosphate [PtdIns(3)P] is generated at the plasma membrane by an inositol polyphosphate 5-phosphatase: endogenous PtdIns(3)P can promote GLUT4 translocation to the plasma membrane. Mol. Cell Biol. 26, 6065–6081 10.1128/MCB.00203-06 [DOI] [PMC free article] [PubMed] [Google Scholar]
- 39. Maffucci T., Brancaccio A., Piccolo E., Stein R. C., and Falasca M. (2003) Insulin induces phosphatidylinositol-3-phosphate formation through TC10 activation. EMBO J. 22, 4178–4189 10.1093/emboj/cdg402 [DOI] [PMC free article] [PubMed] [Google Scholar]
- 40. Beresford N., Patel S., Armstrong J., Szöor B., Fordham-Skelton A. P., and Tabernero L. (2007) MptpB, a virulence factor from Mycobacterium tuberculosis, exhibits triple-specificity phosphatase activity. Biochem. J. 406, 13–18 10.1042/BJ20070670 [DOI] [PMC free article] [PubMed] [Google Scholar]
- 41. Christoforidis S., McBride H. M., Burgoyne R. D., and Zerial M. (1999) The Rab5 effector EEA1 is a core component of endosome docking. Nature 397, 621–625 10.1038/17618 [DOI] [PubMed] [Google Scholar]
- 42. Chua J., and Deretic V. (2004) Mycobacterium tuberculosis reprograms waves of phosphatidylinositol 3-phosphate on phagosomal organelles. J. Biol. Chem. 279, 36982–36992 10.1074/jbc.M405082200 [DOI] [PubMed] [Google Scholar]
- 43. Lu N., Shen Q., Mahoney T. R., Neukomm L. J., Wang Y., and Zhou Z. (2012) Two PI 3-kinases and one PI 3-phosphatase together establish the cyclic waves of phagosomal PtdIns(3)P critical for the degradation of apoptotic cells. PLoS Biol. 10, e1001245 10.1371/journal.pbio.1001245 [DOI] [PMC free article] [PubMed] [Google Scholar]
- 44. Dewitt S., Tian W., and Hallett M. B. (2006) Localised PtdIns(3,4,5)P3 or PtdIns(3,4)P2 at the phagocytic cup is required for both phagosome closure and Ca2+ signalling in HL60 neutrophils. J. Cell Sci. 119, 443–451 10.1242/jcs.02756 [DOI] [PubMed] [Google Scholar]
- 45. Horan K. A., Watanabe K., Kong A. M., Bailey C. G., Rasko J. E., Sasaki T., and Mitchell C. A. (2007) Regulation of FcγR-stimulated phagocytosis by the 72-kDa inositol polyphosphate 5-phosphatase: SHIP1, but not the 72-kDa 5-phosphatase, regulates complement receptor 3 mediated phagocytosis by differential recruitment of these 5-phosphatases to the phagocytic cup. Blood 110, 4480–4491 10.1182/blood-2007-02-073874 [DOI] [PubMed] [Google Scholar]
- 46. Song Z. M., Bouchab L., Hudik E., Le Bars R., Nüsse O., and Dupré-Crochet S. (2017) Phosphoinositol 3-phosphate acts as a timer for reactive oxygen species production in the phagosome. J. Leukoc. Biol. 101, 1155–1168 10.1189/jlb.1A0716-305R [DOI] [PubMed] [Google Scholar]
- 47. Hazeki K., Nigorikawa K., Takaba Y., Segawa T., Nukuda A., Masuda A., Ishikawa Y., Kubota K., Takasuga S., and Hazeki O. (2012) Essential roles of PIKfyve and PTEN on phagosomal phosphatidylinositol 3-phosphate dynamics. FEBS Lett. 586, 4010–4015 10.1016/j.febslet.2012.09.043 [DOI] [PubMed] [Google Scholar]
- 48. Dove S. K., Dong K., Kobayashi T., Williams F. K., and Michell R. H. (2009) Phosphatidylinositol 3,5-bisphosphate and Fab1p/PIKfyve underPPIn endo-lysosome function. Biochem. J. 419, 1–13 10.1042/BJ20081950 [DOI] [PubMed] [Google Scholar]
- 49. Kim G. H., Dayam R. M., Prashar A., Terebiznik M., and Botelho R. J. (2014) PIKfyve inhibition interferes with phagosome and endosome maturation in macrophages. Traffic 15, 1143–1163 10.1111/tra.12199 [DOI] [PubMed] [Google Scholar]
- 50. Kamen L. A., Levinsohn J., and Swanson J. A. (2007) Differential association of phosphatidylinositol 3-kinase, SHIP-1, and PTEN with forming phagosomes. Mol. Biol. Cell 18, 2463–2472 10.1091/mbc.e07-01-0061 [DOI] [PMC free article] [PubMed] [Google Scholar]
- 51. McConnachie G., Pass I., Walker S. M., and Downes C. P. (2003) Interfacial kinetic analysis of the tumour suppressor phosphatase, PTEN: evidence for activation by anionic phospholipids. Biochem. J. 371, 947–955 10.1042/bj20021848 [DOI] [PMC free article] [PubMed] [Google Scholar]
- 52. Shin H. W., Hayashi M., Christoforidis S., Lacas-Gervais S., Hoepfner S., Wenk M. R., Modregger J., Uttenweiler-Joseph S., Wilm M., Nystuen A., Frankel W. N., Solimena M., De Camilli P., and Zerial M. (2005) An enzymatic cascade of Rab5 effectors regulates phosphoinositide turnover in the endocytic pathway. J. Cell Biol. 170, 607–618 10.1083/jcb.200505128 [DOI] [PMC free article] [PubMed] [Google Scholar]
- 53. Kamen L. A., Levinsohn J., Cadwallader A., Tridandapani S., and Swanson J. A. (2008) SHIP-1 increases early oxidative burst and regulates phagosome maturation in macrophages. J. Immunol. 180, 7497–7505 10.4049/jimmunol.180.11.7497 [DOI] [PMC free article] [PubMed] [Google Scholar]
- 54. Spiegelhalter C., Tosch V., Hentsch D., Koch M., Kessler P., Schwab Y., and Laporte J. (2010) From dynamic live cell imaging to 3D ultrastructure: novel integrated methods for high pressure freezing and correlative light-electron microscopy. PLoS One 5, e9014 10.1371/journal.pone.0009014 [DOI] [PMC free article] [PubMed] [Google Scholar]
- 55. Dussault A. A., and Pouliot M. (2006) Rapid and simple comparison of messenger RNA levels using real-time PCR. Biol. Proced. Online 8, 1–10 10.1251/bpo114 [DOI] [PMC free article] [PubMed] [Google Scholar]
- 56. Tobias N. J., Seemann T., Pidot S. J., Porter J. L., Marsollier L., Marion E., Letournel F., Zakir T., Azuolas J., Wallace J. R., Hong H., Davies J. K., Howden B. P., Johnson P. D., Jenkin G. A., and Stinear T. P. (2009) Mycolactone gene expression is controlled by strong SigA-like promoters with utility in studies of Mycobacterium ulcerans and Buruli ulcer. PLoS Negl. Trop. Dis. 3, e553 10.1371/journal.pntd.0000553 [DOI] [PMC free article] [PubMed] [Google Scholar]
Associated Data
This section collects any data citations, data availability statements, or supplementary materials included in this article.