

Abstract
HIV-1 Gag is a highly flexible multidomain protein that forms the protein lattice of the immature HIV-1 virion. In vitro, it reversibly dimerizes, but in the presence of nucleic acids (NAs), it spontaneously assembles into virus-like particles (VLPs). High-resolution structures have revealed intricate details of the interactions of the capsid (CA) domain of Gag and the flanking spacer peptide SP1 that stabilize VLPs, but much less is known about the assembly pathway and the interactions of the highly flexible NA-binding nucleocapsid (NC) domain. Here, using a novel hybrid fluorescence proximity/sedimentation velocity method in combination with calorimetric analyses, we studied initial binding events by monitoring the sizes and conformations of complexes of Gag with very short oligonucleotides. We observed that high-affinity binding of oligonucleotides induces conformational changes in Gag accompanied by the formation of complexes with a 2:1 Gag/NA stoichiometry. This NA-liganded dimerization mode is distinct from the widely studied dimer interface in the CA domain and from protein interactions arising in the SP1 region and may be mediated by protein-protein interactions localized in the NC domain. The formation of the liganded dimer is strongly enthalpically driven, resulting in higher dimerization affinity than the CA-domain dimer. Both detailed energetic and conformational analyses of different Gag constructs revealed modulatory contributions to NA-induced dimerization from both matrix and CA domains. We hypothesize that allosterically controlled self-association represents the first step of VLP assembly and, in concert with scaffolding along the NA, can seed the formation of two-dimensional arrays near the NA.
Keywords: human immunodeficiency virus (HIV), virus assembly, protein-nucleic acid interaction, analytical ultracentrifugation, fluorescence, fluorescence-detected sedimentation velocity, Gag multimerization, protein oligomerization, virus-like particle (VLP)
Introduction
HIV-1 viral particles contain several thousand copies of the virus-coded Gag protein as a major structural component (1, 2). Expression of Gag in a permissive cell leads to the production of virus-like particles (VLPs),3 even in the absence of viral RNA or other virus-coded proteins. These particles contain approximately the same amount of RNA as authentic WT particles; RNAs of cellular origin are encapsidated in the absence of viral genomic RNA (3–5). Many aspects of HIV-1 particle assembly have also been recapitulated in defined in vitro systems with recombinant Gag. Interestingly, the protein is soluble but assembles very efficiently into virus-like particles when nucleic acid (NA) is added. Nearly any single-stranded NA will support assembly in these experiments, including oligonucleotides as short as ∼30 nucleotides (3, 6).
Thus, protein-protein interactions are essential in the assembly process. To create a two-dimensional superstructure from monomeric subunits, each monomer must be linked to at least three neighbors. These observations raise several fundamental questions, including (a) where are the interfaces on a Gag molecule for interaction with other Gag molecules, leading to particle assembly? and (b) what is the mechanism(s) by which NA promotes Gag-Gag interaction, ultimately resulting in formation of a virus particle? Although a wealth of information on interfaces has been derived from high-resolution structures by cryo-EM, X-ray crystallography, and NMR spectroscopy, a complete picture of the Gag-Gag and Gag-NA interactions in assembly is missing, in part due to the high flexibility of Gag, the dynamics of the assembly process, and structural polymorphism of mature and immature VLPs (7–11).
HIV-1 Gag is a polyprotein with individually folded domains connected by flexible linkers (1, 2, 12, 13). It consists of the myristoylated N-terminal matrix domain (MA) that binds Gag to the plasma membrane, the central capsid domain (CA) that forms the hexameric units of the capsid, and the highly basic nucleocapsid domain (NC) that holds the principal NA-binding function and is flanked on either side by spacer peptides (SP1 and SP2), followed by the C-terminal p6 domain that controls exocytosis and may contribute with NC to the recognition of viral RNA (14–16).
One interface for Gag-Gag interaction is in the C-terminal region of CA. This interface is exposed in the free protein in solution, leading to weak monomer-dimer self-association with a Kd of ∼10–20 μm (17, 18) and links hexamers in the immature virion. A second site of Gag-Gag interaction is in the extreme C terminus of the CA domain and approximately the first eight residues of the proximal SP1 domain. After binding of the Gag NC domain to NA with low nanomolar Kd (6, 19), the proximity of multiple Gag molecules on the same NA molecule appears to stabilize a helical conformation in this region that facilitates multimerization of Gag and is essential for spherical VLP assembly (9, 20–22). Relatedly, the co-factor IP6 has recently emerged as a ligand stabilizing hexameric subunits through interactions close to this site (9, 23, 24).
In the present work, we report an additional self-association mechanism that is stronger than SP1- or CA-mediated interactions. It is accompanied by Gag conformational changes induced through NA binding. This is based on biophysical data from a new hybrid technique of fluorescence-detected sedimentation velocity analytical ultracentrifugation (SV) combined with fluorescence proximity analysis that can simultaneously resolve complexes of different sizes and distinguish their conformations in solutions. As a Gag ligand, we chose an extremely short oligonucleotide, the hexanucleotide (GT)3, to prevent NA scaffolding and avoid assembly masking the initial binding events. Experiments with mutated and truncated Gag molecules indicate that this new mode of Gag-Gag interaction can be attributed to the NC domain, consistent with the previously reported observation of 2:1 NC/oligonucleotide complexes (19). Energetic contributions may arise from both protein-protein and protein-oligonucleotide contacts. Analysis of the thermodynamic stability of different Gag constructs shows that this nucleic acid binding–induced dimerization is augmented through the CA domain interface and slightly inhibited by the MA domain. The combined sedimentation/fluorescence quenching data show that after initial high-affinity NA binding, docking of a second Gag molecule to the Gag/oligonucleotide complex is associated with a further change in Gag configuration and that binding of a second oligonucleotide is energetically unfavorable. This could promote assembly “orthogonal” to the NA strand, in contrast to the scaffolding of multiple Gag along the NA. Based on the strength of the interaction, we hypothesize that this NA-induced dimerization is the first step in nucleation for initiating the assembly.
Results
NA binding promotes Gag dimerization
In the present work, we studied WT Gag comprising residues 1–448 (including MA-CA-SP1-NC-SP2 domains and lacking the terminal p6; termed WTΔp6) as well as several constructs comprising subunits (Fig. 1). Unless otherwise mentioned, all experiments were carried out in 20 mm HEPES, pH 7.3, 100 mm NaCl, 1 mm TCEP, conditions allowing strong NA binding and supporting immature VLP assembly. As a starting point, we carried out conventional SV experiments on the self-association of all molecules (Fig. S1). Gag WTΔp6 exhibits a concentration-dependent sedimentation coefficient from ∼2.9 to ∼4.5 S characteristic for rapidly reversible dimerization with best-fit Kd of ∼10 μm. As expected, this self-association behavior is reproduced by the isolated CA domain, consistent with the known dimerization characteristics of the interface in the CA domain (17), and by constructs lacking the MA domain (ΔMA, lacking residues 16–99; a construct still capable of assembling into VLPs (25)). By contrast, dimerization of Gag is essentially eliminated with the mutation W316A/M317A in the CA domain (WM) (18), as well as in a truncated Gag lacking MA, CA, and SP2 (SP1-NC; residues 356–432).
Figure 1.

Overview of the Gag constructs used. Also shown is the primary sequence of NC in the BH10 isolate of HIV-1. Basic residues are highlighted in blue, and zinc-coordinating residues are highlighted in red.
As oligonucleotide ligand, we selected sequences containing (GT) repeats, motivated by prior work and the identification of unpaired G bases as preferred binding targets (12, 26–29). To focus on the initial events of Gag engaging NA, we used a hexanucleotide, (GT)3, which is approximately the length occupied by a single NC protein on longer polynucleotides (6, 30, 31). As shown in detailed analysis below, (GT)3 binds with high affinity, with Kd in the tens of nm range similar to those of longer NAs (see Table 1), but is too short to support scaffolding of multiple copies of Gag and VLP assembly observed with longer oligonucleotides (6), such as (GT)8, which can efficiently scaffold two Gag molecules at protein concentrations of 100 nm (Fig. S2).
Table 1.
Binding energies and cooperativity of Gag-NA complexes
Best-fit values from global analysis of fluorescence quenching and sedimentation coefficient isotherms are shown. Reported ΔG values are standard Gibbs free energy changes calculated from association equilibrium constants according to ΔG0 = −RT ln K. For best-fit association binding constants and quenching parameters from global analysis, see Table S2. Binding enthalpies are from ITC experiment (Fig. 9). 68% confidence limits based on 2000 Monte-Carlo iterations were determined for the total standard free energy of 2:1 complex formation (ΔGNPP) and found to be −18.2 to −17.9 kcal/mol for WTΔp6, −19.0 to −18.7 kcal/mol for ΔMA, −16.9 to −15.2 kcal/mol for WM, and −16.9 to −15.9 kcal/mol for SP1-NC, respectively. Based on the same Monte-Carlo statistics, ± S.E. at 68% confidence level are indicated in parentheses. *, only lower limit is available due to weak or absent dimerization.

We also tested the binding of ΔMA to even shorter oligonucleotides. We found that (GT)2 and (GT)1 were also able to bind the protein, but with estimated 23- and 78-fold reduced affinity, respectively (Fig. S3). (Similarly, SV binding assays and isothermal titration calorimetry (ITC) titrations with (GT)2 and SP1-NC showed ∼8-fold reduced affinity; data not shown.) This drastically reduced binding affinity is consistent with previous work on the binding of NC protein to small oligonucleotides (31).
Alexa Fluor 488–tagged (GT)3 can be monitored at low nanomolar concentrations by fluorescence-detected SV (32, 33). Fig. 2A shows the sedimentation coefficient distributions of 10 nm (GT)3 in the presence of increasing concentrations of Gag WTΔp6. From the depletion of free (GT)3 sedimenting at ∼0.9 S and the increasing population of a faster-sedimenting peak, binding can be clearly discerned already in the low nanomolar range. At 200 nm, the majority of (GT)3 is bound in a 1:1 Gag/(GT)3 complex at ∼3 S, consistent with previously reported Gag/NA affinities. Unexpectedly, however, higher Gag concentrations gradually led to sedimentation coefficient increasing from ∼3 to ∼4.5 S, showing the formation of complexes of higher mass that must contain more than one copy of Gag. The concentration dependence of the peak positions reveals that the complexes are in fast exchange relative to the time scale of sedimentation (i.e. have lifetimes on the order of 1000 s or less) (34). The asymptotic s-value of ∼4.5 S is consistent with the WTΔp6 dimer. From the apparent half-saturation of the sedimentation coefficient peaks at ∼0.5–1 μm Gag (navy and purple curves in Fig. 2A), it is clear that the (GT)3-induced dimerization is significantly stronger than the CA-mediated dimerization (Fig. S1E).
Figure 2.

Sedimentation coefficient distributions of (GT)3 in the presence of Gag WTΔp6 (A), WM (B), and SP1-NC (C). Sedimentation profiles acquired by recording the fluorescence of 10 nm Alexa Fluor 488–labeled (GT)3 in mixture with unlabeled proteins at increasing concentrations. Gray vertical lines, approximate s-values expected for 1:1 and 2:1 complexes, respectively.
In analogous experiments with WM, despite the suppressed dimerization in the CA domain, we find similar (GT)3-induced Gag dimerization, although weaker than with WTΔp6 (Fig. 2B). To gain further information on the localization of the binding interface of this dimerization process, we carried out analogous experiments with other constructs, including ΔMA, WT lacking SP2 (denoted WT*) (Fig. S4), and SP1-NC (Fig. 2C). ΔMA and WT* were found to form dimeric complexes upon (GT)3 binding, like WTΔp6, whereas dimer formation by SP1-NC was somewhat weaker, similar to WM. The CA domain by itself unsurprisingly did not bind (GT)3 (data not shown).
It was shown previously (21, 22) that SP1, when joined to a leucine zipper, can self-associate at very high local concentrations via a coil:helix transition and formation of helical bundles. This phenomenon is strictly dependent on the amphipathic character of the resulting helices: deletion of the first residue of SP1, by destroying this amphipathic character, prevents this SP1-SP1 association. It also interferes with the proper assembly of spherical VLPs. In contrast, SP1 with a deletion of the seventh SP1 residue self-associates normally and assembles normally. To probe the possible role of this SP1-SP1 association in the dimerization of SP1-NC on (GT)3, we studied deletion mutants SP1-NCΔ1 and SP1-NC Δ7 (deletion of residue 1 or 7 in SP1; Fig. 1). In sedimentation experiments in the presence of (GT)3, both deletion mutants exhibited sedimentation behavior virtually identical to WT SP1-NC, with mixtures of 1:1 and 2:1 complexes at 20 μm SP1-NC (Fig. 3A). This shows that the observed (GT)3-induced dimerization requires neither the CA domain nor the SP1-SP1 interactions associated with the amphipathic helical conformations of SP1 peptide.
Figure 3.

A, sedimentation coefficient distributions of free WT SP1-NC (black line) and SP1-NC mutants Δ1 (red dashed line) and Δ7 (cyan dashed line), recorded by absorbance at 280 nm tracking the protein. Mixtures of these molecules with (GT)3 are shown in green, blue, and magenta, respectively, recording absorbance at 493 nm tracking only oligonucleotide and its complexes. B, sedimentation coefficient distributions of NC in the presence of (GT)3 at different concentrations, tracking the oligonucleotide (except for the same of NC alone, which was recorded at 280 nm). Vertical gray lines, theoretically estimated s-values for 1:1 and 2:1 protein/(GT)3 complexes based on hydrodynamic shape assumptions and the extrapolated binding isotherm.
Finally, we analyzed mixtures of free NC protein with (GT)3. As shown in Fig. 3B, the measured sedimentation coefficient distributions show a mixture of complexes with both one and two NC molecules when NC is in excess. Taken together, the results indicate that the dimerization of Gag on the oligonucleotide is due to interactions within the NC domain. (Because the smaller size of NC leads to lower hydrodynamic resolution, larger constructs were used elsewhere in the present study, which provide significantly better resolution and thereby clearer results.)
The Gag dimer/(GT)3 complex has a 2:1 stoichiometry
Due to the small size of the (GT)3 ligand, it is impossible to ascertain from the sedimentation coefficient distributions alone whether the protein dimer binds a single oligonucleotide in a 2:1 complex or whether each Gag protomer in the dimer can bind (GT)3 (independently or cooperatively), forming a 2:2 complex. In the titration of Fig. 2, although the increasing excess of protein would promote the population of 2:1 complexes, 2:2 complexes cannot be excluded as possible or even energetically favorable states. Clarification of possible complex states is a key prerequisite for further thermodynamic analysis.
To address this question, the SP1-NC construct is best-suited because it does not self-associate in unliganded form and because binding of (GT)3 provides the largest relative change in s-value of all constructs. First, Fig. 4A shows multisignal SV data at 20 μm SP1-NC and 2 μm (GT)3. At these concentrations, fluorescence detection is not necessary, and we can take advantage of refractive index detection reporting mostly on the protein (magenta), in conjunction with absorbance detection at 493 nm reporting solely on the (GT)3-containing species (blue). Based on known extinction coefficients and refractive index increments of all components, the integrated reaction boundary peak at ∼1.8 S leads to an estimated SP1-NC/(GT)3 molar ratio of 2.0:1. This compares well with the theoretically expected composition of 1.83:1 of a reaction boundary at 1.82 S, based on binding parameters estimated below using a 2:1 binding model (Table 1). This shows that the fast-sedimenting c(s) peak that is observed when SP1-NC is at high concentrations and in large excess over oligonucleotide contains complexes of two SP1-NC molecules and a single NA molecule.
Figure 4.
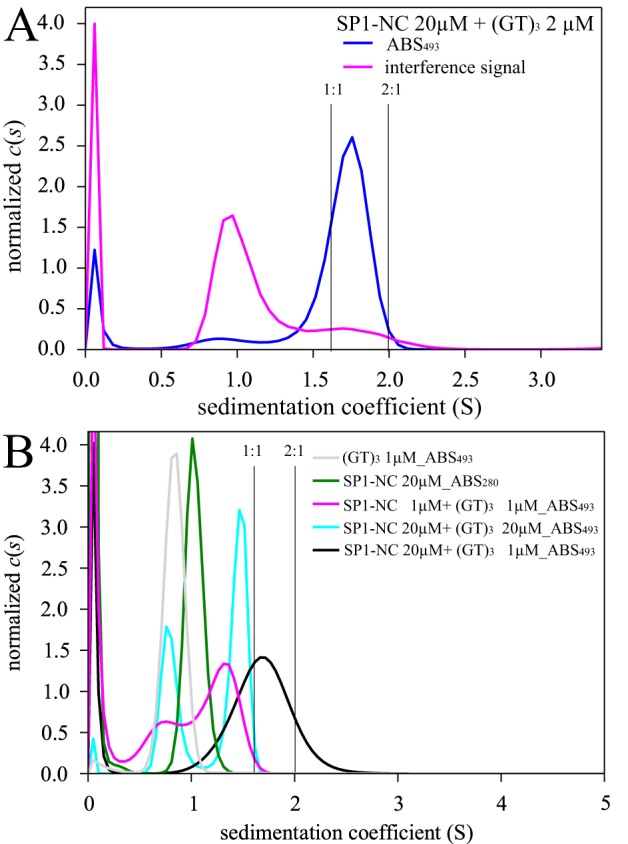
Hydrodynamic and spectral analysis of SP1-NC/Gag complex stoichiometry. A, multisignal experiment of 20 μm SP1-NC with 2 μm (GT)3 showing sedimentation coefficient distributions c(s) based on 493-nm absorbance monitoring exclusively the oligonucleotide (blue) and by interferometric detection that represents largely protein (magenta). B, sedimentation coefficient distributions c(s) of SP1-NC in mixtures with (GT)3 at different concentrations. Except for data of free SP1-NC (green), all c(s) distributions are based on specific detection of (GT)3 at 493 nm. The vertical gray lines indicate theoretically estimated s-values for 1:1 and 2:1 SP1-NC/(GT)3 complexes based on hydrodynamic shape assumptions and the extrapolated binding isotherm. Based on binding isotherm analyses (Table 1), the theoretically expected s-values of a reaction boundary from the mixture of 20 μm SP1-NC with 2 μm (GT)3 is between that of the 1:1 and 2:1 complex species, at 1.82 S, with a composition of 1.83:1.
We next asked whether 2:2 complexes are formed at equimolar protein and oligonucleotide. Fig. 4B shows again data with SP1-NC at 20 μm in large excess over 1 μm (GT)3 tracking (GT)3-containing complexes (black). Strikingly, when raising the (GT)3 concentration to equimolar 20 μm (cyan), we observe a peak at a lower s-value in combination with a large fraction of excess free (GT)3. Apparently, adding more oligonucleotide has driven all of Gag into 1:1 complexes, rather than 2:2 complexes. In fact, the s-value of the complex peak is now close to that obtained at 1 μm equimolar SP1-NC and (GT)3 (magenta). This shows that 2:2 complexes are highly unfavorable. Experiments analogous to those in Fig. 4B were carried out with WM (Fig. S5). Similar to SP1-NC, it exhibits a decrease of complex peak s-value with increasing ratio of (GT)3 to WM, consistent with 2:1 complexes being favored over 2:2 complexes.
Additional confirmation for the formation of asymmetric 2:1 complexes as opposed to symmetric 2:2 complexes comes from ITC experiments. In previous work (19), the titration of NC with (TG)4 oligonucleotide was shown to have titration midpoints at molar ratios far below 1.0, indicating the formation of complexes with a 2:1 protein/oligonucleotide molar ratio. Similarly, titration of oligonucleotide into different Gag constructs by Tanwar et al. (35) shows n values of ∼0.5. Here, with the goal to analyze in more detail the binding energetics, we performed a set of orthogonal titrations, which can be globally fit very well with a ligand-linked Gag dimerization model with only 1:1 and 2:1 complexes (see below).
Conformational differences in liganded Gag monomer and dimer
The ability of NA-liganded Gag to dimerize, whereas unliganded Gag does not (or does much more weakly), suggests binding-induced conformational changes. To study conformational differences of Gag in liganded states, we applied CD spectroscopy. We focused on SP1-NC to avoid dominating spectral contributions of the folded CA and MA domains far away from the NA binding site and to maximize expected relative signal changes. Unfortunately, CD experiments are limited to low-salt conditions to ensure buffer transparency in the UV. As shown in Fig. 5, the poorly structured SP1-NC exhibits a noncanonical CD spectrum (blue). Importantly, (GT)3 binding significantly increases ellipticity in the 210–220-nm range. This clearly demonstrates changes in the protein configuration upon NA binding, which reflects structural differences supporting the ligand-induced dimerization mode observed above. This is corroborated in analogous experiments with NC using standard buffer. Unfortunately, the precise nature of the changes cannot be ascertained, as no secondary structural elements are recognizable, and it is not possible to discriminate between changes occurring in 1:1 and 2:1 complexes.
Figure 5.
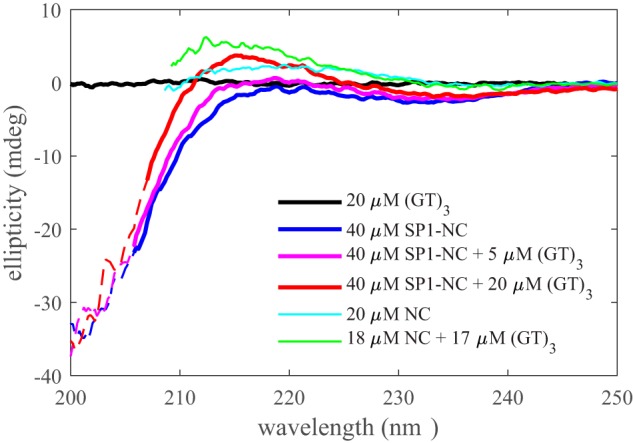
CD spectra of free (GT)3 (black), free SP1-NC (blue), and mixtures with 1:8 and 1:2 (GT)3/SP1-NC ratio (magenta and red) in 2 mm HEPES, pH 7.3, 15 mm NaCl with 1 mm TCEP. Also shown are spectra of free NC (cyan) and a ∼1:1 mixture of NC with (GT)3 in standard buffer. The data from the mixtures are corrected for (GT)3 signal contributions. Solid lines, spectra truncated to 500-V photomultiplier voltage; dashed lines, spectra extended to 700 V.
However, the latter can be accomplished by exploiting a novel aspect of FDS-SV data that is based on differences in the fluorescence quantum yield of different sedimenting species. Specifically, the local environment of the fluorophore attached to (GT)3 serves as a beacon providing information on gross structural rearrangements of Gag, synergistic to simultaneous hydrodynamic discrimination of species in the centrifugal field. Fig. 6 shows the total detected signal as a function of protein concentration for the different Gag constructs. For WTΔp6, the total fluorescence intensity decreases to about 40% of its initial level upon binding of (GT)3 to Gag. Fluorescence quenching is maximal at high nanomolar concentrations populating mostly the 1:1 complex, and the signal recovers at low micromolar concentrations populating the 2:1 complex (as simultaneously measured through their sedimentation velocity). The recovery indicates a further change affecting the proximity of the fluorophore that is associated with binding of the second Gag to form the 2:1 complex. While it is conceivable that the second Gag may have compensatory electrostatic or solvation effects on the fluorophore, a simpler explanation is that a domain of the first Gag is removed from the fluorophore proximity by binding of the second Gag.
Figure 6.

Relative fluorescence intensity of 10 nm Alexa Fluor 488–tagged (GT)3 in titrations with WTΔp6, (black), WM (blue), ΔMA (magenta), or SP1-NC (green) as observed in FDS-SV. The solid lines are best-fit binding models with 1:1 and 2:1 Gag/(GT)3 complexes jointly fitting isotherms of signal-weighted average sedimentation coefficients (Fig. 7). The blue- and red-shaded patches highlight the approximate concentration range of NA binding and dimerization, respectively.
Interestingly, when comparing different constructs, it can be discerned that quenching of ΔMA is significantly less than in the Gag constructs containing the MA domain (WTΔp6 and WM) (Fig. 6). This fits well with the current understanding that the MA domain in early stages of assembly contributes to NA binding and could thereby alter the dielectric environment of the fluorophore. Regarding the fluorescence recovery in the 2:1 complex, ΔMA quenching data follow the same pattern of recovery as WTΔp6. By contrast, molecules lacking the CA-domain dimerization capability (i.e. both WM and SP1-NC) exhibit little or no fluorescence recovery. This implicates the CA domain interaction in a modulatory role stabilizing a different Gag dimer conformation. These aspects can be further examined through analysis of the binding energetics.
Energetic analysis of binding isotherms reveals contributions by MA and CA domains
The concentration dependence of binding was measured in the isotherm of signal-weighted-average sedimentation coefficient (sw) shown in Fig. 7. The concentration dependence of sw reflects free energies of complex formation. Based on the previous analysis, the quantitative interpretation requires a binding model that allows for unliganded Gag homodimerization (where applicable; with independently predetermined homodimerization constant) and for the formation of 1:1 and 2:1 Gag/(GT)3 complexes. An unusual aspect of the sedimentation analysis is that both the quenching isotherms of Fig. 6 and the sw isotherm need to be analyzed jointly: As pointed out recently, accounting for signal quenching in different states is a critical element for the interpretation of the average signal transport in sedimentation (36). Conversely, the sedimentation velocity information links quenching states to oligomeric states. To exploit this synergy and to disentangle the interdependence, we applied the principles of global multimethod analysis (37) to jointly fit data of Figs. 5 and 6. For ΔMA and SP1-NC, it was possible to carry out SV experiments at higher protein concentrations with absorbance detection, generating additional isotherms of sw as well as the time-average s-values of all Gag/(GT)3 complexes (reaction boundary s-value) that were included in the global fit.
Figure 7.

Isotherms of signal weighted-average sedimentation coefficient sw of 10 nm Alexa Fluor 488–tagged (GT)3 in titrations with WTΔp6, (black), WM (blue), ΔMA (magenta), or SP1-NC (green). For clarity of presentation, to compensate for different construct sizes, the sw value scale is linearly stretched to match the monomer and dimer s-value for all molecules. Solid lines, best-fit binding mass action law models, allowing for Gag homodimerization (for WTΔp6, WM, and ΔMA), and 1:1 and 2:1 Gag/(GT)3 complexes, globally fit jointly with the respective quenching isotherms in Fig. 6. For ΔMA and SP1-NC, additional isotherms at higher concentrations are included in the fit. Best-fit binding parameters are listed in Table 1. Shaded patches are the same as in Fig. 6.
The results are summarized in Table 1. For WTΔp6, the homodimerization through the CA domain is driven by −6.7 kcal/mol, but once (GT)3 is bound to WTΔp6, the 1:1 complex can recruit a second WTΔp6 with −8.5 kcal/mol to form a 2:1 complex (ΔΔGNPP-NP). This exceeds the binding energy from the CA domain by −1.8 kcal/mol and shows that Gag dimerization is cooperatively enhanced by NA binding. Vice versa, NA binding to the dimer is enhanced (ΔΔGNPP-PP < ΔGNP). The changes in Gibbs free energy associated with the different protein dimer states are depicted graphically in Fig. 8.
Figure 8.

Measured standard free energies of the WTΔp6, homodimer (cyan), the complex with (GT)3 (green), and the liganded dimer (magenta). The arrows highlight stronger dimerization in the (GT)3-bound as compared with (GT)3-free state.
It is important to note that the NA-induced dimerization is mediated by a novel binding interface, because with the CA domain missing entirely, liganded SP1-NC can still recruit a second protein molecule with −6.6 kcal/mol, approximately the same binding energy as the CA domain interface. Nevertheless, as supported by the structural information from the quenching data above, the CA domain is still modulating binding and adds stability to this dimer by −1.9 to −1.5 kcal/mol (comparing ΔΔGNPP-NP of WTΔp6 and ΔMA with that of WM and SP1-NC).
Furthermore, the structural information from quenching data also implies a role of the MA domain, which is borne out in a +1 kcal/mol reduced stability of the liganded dimer of WTΔp6 compared with ΔMA, arising equally from imposing an energetic penalty to initial (GT)3 binding and from opposing the recruitment of a second Gag to the 1:1 complex.
As mentioned above, we carried out ITC experiments to further unravel enthalpic and entropic contributions to the binding energetics. For practical reasons, this was restricted to SP1-NC. The strategy was to create orthogonal titration configurations that will populate predominantly either 1:1 or 2:1 complexes. The latter required high protein concentrations in the ITC cell that with maximally feasible (GT)3 concentrations in the syringe led to a titration with a shallow shape as typical for low c-values (38). However, information content is retained after both titrations are joined in a global analysis with a ligand-linked dimerization model, as shown in Fig. 9 and Fig. S6. This analysis leads to strongly enthalpic driving forces for the recruitment of the second SP1-NC to a preformed 1:1 complex, with a best-fit ΔH = −13.5 kcal/mol, −TΔS = +7.3 kcal/mol, and indicates a significant excess of enthalpic over entropic contributions of −20.8 kcal/mol (−33.2 to −4.5 kcal/mol; 95% confidence interval).
Figure 9.
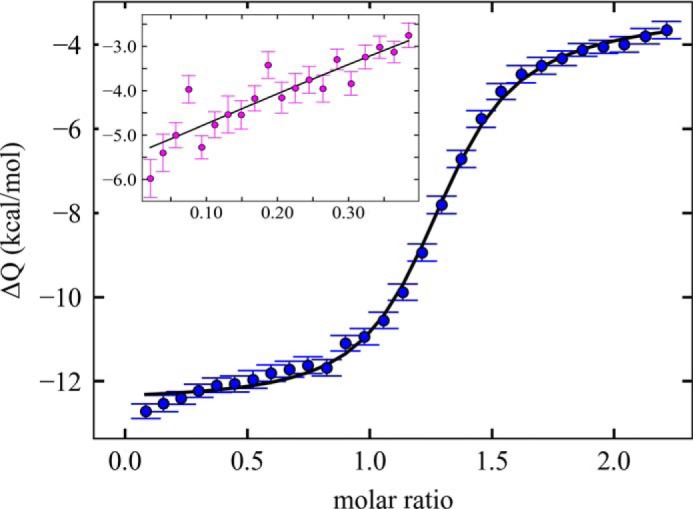
Isothermal titration calorimetry analysis of (GT)3 binding and dimerization of SP1-NC. Shown is a titration of 50 μm SP1-NC into 5 μm (GT)3 that initially creates mostly 1:1 complexes and reports on the enthalpy of oligonucleotide binding. Inset, reverse titration of 50 μm (GT)3 into SP1-NC at 20 μm, where initially 2:1 SP1-NC/(GT)3 is more favored. It should be noted that to achieve this, high SP1-NC concentrations are needed, and as a result, the titration exhibits a shape typical for low c values (38). Lines are from a global model, with best-fit thermodynamic parameters for the (GT)3 binding to SP1-NC ΔH1:1 = −12.7 kcal/mol, ΔG1:1 = −9.8 kcal/mol, and for the SP1-NC recruitment to preformed 1:1 complex ΔH2:1 = −13.5 kcal/mol, ΔG2:1 = −6.3 kcal/mol. Thermograms and control titrations are shown in Fig. S6.
Influence of ionic strength, pH, and EDTA on complex formation
To relate our findings to studies in the literature that were carried out under high ionic strength conditions and to studies on the role of electrostatic interactions on the recognition of ψ-RNA (15, 16, 26), we examined the effect of high-salt conditions on Gag dimerization. We found that an increase from 100 to 400 mm NaCl opposes (GT)3-induced dimerization of the SP1-NC fragment, implying significant electrostatic contributions to this interaction (Fig. S7). This salt dependence is consistent with the strongly enthalpic character of dimerization described above.
Gross et al. (25) have reported a pH-dependent shift in the morphology of assembly products dependent on pH, with the formation of spherical particles closely resembling immature capsid shells at pH ∼7, but tubes and cones, similar to mature shells, at pH 6.0. To probe whether switching Gag from conformations supporting the formation of immature VLPs to those of mature VLPs has an impact on the observed dimerization, we carried out experiments with SP1-NC at low pH (20 mm sodium phosphate, pH 6.5, with 50 mm NaCl, 0.1 mm ZnCl2). However, under these conditions, no (GT)3 binding could be observed up to 1 μm SP1-NC (data not shown), suggesting impairment of zinc knuckles essential for NA binding at low pH (39, 40).
That the zinc knuckles of the Gag NC domain are indeed the binding sites for (GT)3 in our studies, as expected, was experimentally confirmed in control experiments in the presence of EDTA, which chelates zinc and was found to almost completely abolish binding between ΔMA Gag and (GT)3 and the associated dimer formation in the nanomolar concentration range studied here (Fig. S8). In summary, the variation of buffer conditions demonstrates contributions from electrostatic interactions but also highlights essential structural requirements.
Discussion
As noted above, HIV-1 Gag protein assembles into VLPs when it is mixed with NA. This is possible in vitro at low micromolar protein concentrations. Thus, binding of NA somehow facilitates the interactions between Gag molecules required for forming a two-dimensional lattice, as opposed to linear axial decoration of NA. The aim of the present work was to elucidate the initial events after NA binding, prior to VLP formation. We were able to perform this analysis because, in most experiments, the NA was only 6 bases long—too short to support particle assembly (6, 31). Further, tagging the NA with a fluorophore made it possible to study the interactions under extremely dilute conditions, and applying a new hybrid sedimentation velocity/fluorescence proximity approach allowed us to unravel complex sizes and structural changes of Gag in solution under conditions of moderate pH and ionic strength.
The central observation of the present work is that Gag dimerizes efficiently when it is bound to this extremely short oligonucleotide. It is known that Gag dimerizes in solution, with a Kd of ∼10 μm, mediated by an interface within the C-terminal domain of the CA domain (17, 18). However, the dimerization in the NA-bound state is detectable even when Gag is at a concentration of 100 nm and is nearly quantitative when it is at 1–2 μm. It also occurs—although with slightly reduced affinity—with WM mutant Gag, in which the dimer interface of the CA domain has been ablated by mutation. Further truncation of Gag to SP1-NC shows that the CA domain is completely unnecessary for this dimerization. We have previously described the interaction between helices representing a short stretch of Gag extending from the last few residues of CA through the SP1 spacer (22, 23). Deletion of a single residue from this stretch disrupts the amphipathic nature of the helices and their assembly into helical bundles. However, in the present work, we found that such single-residue deletions did not interfere with NA-induced dimerization of SP1-NC; thus, this dimerization is also different from the association of SP1 helices. A previous study from one of our laboratories analyzed the binding of free NC protein to an 8-base oligonucleotide and showed, surprisingly, the formation of 2:1 NC/NA complexes (19). It seems likely, therefore, that the NA-induced dimerization of Gag observed in the present work is a consequence of NC domain interactions. Indeed, experiments with isolated NC showed sedimentation coefficients consistent with the presence of 2:1 NC/NA complexes, as expected.
The observation of complexes between two protein molecules and a single (GT)3 hexanucleotide in itself does not clarify their structural arrangement. Is it possible that both protein molecules bind the oligonucleotide simultaneously? Alternatively, oligonucleotide binding might alter the protein conformation such that it can dimerize via an allosterically induced protein-protein interface. In fact, both processes may contribute to the formation of 2:1 complexes.
The following considerations lead us to favor the hypothesis that protein-protein interactions make significant contributions in formation of the complex. First, the 6-base oligonucleotide is too short to permit side-by-side binding sequentially along the NA as longer assembly-promoting oligonucleotides do (such as (GT)8 shown in Fig. S2, which can accommodate two WM Gag molecules binding with high affinity). Consistent with this notion, in NMR structures of NC in complex with Ψ-RNA stem loops SL2 and SL3 (28, 29) or pentanucleotides (41), 3–4 bases make contact with Gag such that the presence of two binding sites on the hexanucleotide seems sterically implausible.
On the other hand, if we imagine that two Gag molecules can bind side by side to (GT)3, what would be the energetic driving force for 2:1 complexes? Whereas electrostatic interactions are certainly a major factor for binding, its salt dependence in moderate salt conditions (15, 16) does not seem to rise to that of typical nonspecific regulatory protein-DNA interactions (42). Based on the observed abrogation of binding at low pH or in the presence of EDTA, we can conclude that high-affinity binding depends on intact zinc knuckles (i.e. also on specific structural contacts). Thus, charge neutralization as in macroion interactions seems unlikely to present the sole driving force, also considering that the 11 net positive charges on a single NC polypeptide already far exceed the negative charges on (GT)3. Hypothetically, if this structural motif from the first Gag were to bind to two guanines with high affinity, whereas a second Gag would bind a single guanine with lower affinity, then these interactions can be compared with affinities measured separately to tetra- and dinucleotides. We observed that the affinity of Gag for (GT)2 was approximately an order of magnitude weaker, and that for (GT) was approximately two orders of magnitude weaker, than that for (GT)3. Thus, the binding energy of tetra- and dinucleotides does not match the high affinity and dimerization of Gag on hexanucleotides. A caveat of this comparison is the extent to which shorter oligonucleotides will differ in physical properties (including charge and size) free in solution or in context of the hexanucleotide.
In any event, whether or not steric constraints mentioned above prohibit accommodation of two NCs simultaneously binding side-by-side to a hexanucleotide, our data show that Gag can be more tightly packed on NA than previously thought, based on estimates of the NC site size of at least 5 nucleotides (6, 30, 31, 43). In such close proximity, NC molecules will be poised for protein-protein interactions.
It is clear that the NA-induced dimerization is distinct from and stronger than the self-association processes of the CA-domain and SP1 region. This implies that binding of the oligonucleotide must induce a conformational change—or, more generally, alter the ensemble of Gag chain configurations—that exposes the new Gag dimerization interface. Indeed, the CD spectra (Fig. 5) directly show NA-induced conformational changes in SP1-NC. Further, altered fluorescence quenching indicates conformational changes upon dimerization of Gag for all constructs (Fig. 6), which are mirrored by energetic analysis of NA binding and dimerization of different constructs. These processes are schematically illustrated in the cartoons Fig. 10 (A–C), which sketch different interactions of Gag and their gross spatial relationship.
Figure 10.

Cartoon of nucleic acid–induced Gag dimerization and scaffolding. a, free NA with fluorescent label (blue star); Gag with schematically drawn MA domain (green), CA domain (blue) with its dimerization interface (red patch), and NC domain (purple). b, 1:1 Gag/NA complex. High-affinity interaction of NA and NC (red bar in the interface) triggers an altered configuration of NC, and MA alters the dielectric environment in proximity of the fluorescein and causes quenching. c, 2:1 Gag/NA complex. The new dimerization interface between NCs (pink) allows a second Gag molecule to bind. This brings the CA domains into partial contact, allowing them to contribute to the dimer stability. The MA domain is disengaged from the NA (or absent in some constructs of the present study), causing reversal of fluorescence quench. d, as in c, but with possible alternate engagement of the CA dimerization to form trimers or higher oligomers. e, hypothetical three-dimensional arrangement where NA-induced dimerization, due to the single NA site in the dimer, may coexist with self-association induced by scaffolding on longer NAs and associated SP1-SP1 interactions (purple highlight).
Unfortunately, whereas the data show clearly that SP1-NC dimerizes upon (GT)3 binding, we have no direct information on the structure of the interface. Because NC binds differently to different RNA stem loops (28, 29), it appears to have little or no intrinsic structure aside from the zinc knuckles. Similarly, SP1 is intrinsically disordered (22, 44). Correspondingly, NC and its contacts to NA do not resolve in structures of the viral capsid (11, 45). (Recent NMR studies on Gag conformation and dynamics in the absence and presence of NA (46) did not detect the 2:1 complex described here; however, these were carried out at low pH and high salt (i.e. conditions that do not favor the binding mode studied here) (25).) Despite the present study being confined to quantitative macroscopic and qualitative structural conclusions from biophysical and biochemical tools, it still elucidates several mechanistic aspects.
Focusing on the SP1-NC region, ITC data show that the dimerization step is strongly enthalpically driven, consistent with the electrostatic contributions indicated by the abrogation of dimerization at higher salt. The unfavorable entropic contributions associated with dimerization may reflect restricted configurational space in the dimer. Additional entropic and enthalpic contributions will arise in the context of the entire Gag molecule.
Beyond the dimerization interface evidently located in the NC domain, the comparison of binding energetics and structural transitions among different Gag constructs reveals modulatory contributions of other Gag domains. First, the MA domain appears to be responsible for most of the quenching of the NA-bound fluorophore (Fig. 6). This is consistent with the assembly model where not only NC but initially also the MA domain binds to NA (3, 12, 46–51). It is thought that simultaneous binding of both domains to RNA may be important for correct intracellular targeting, in a mechanism where engagement of MA with its preferred ligand phosphatidylinositol 4,5-bisphosphate at the plasma membrane is concurrent with conformational transitions of Gag promoting assembly (47, 52, 53). NA-induced Gag dimerization described here may constitute a molecular mechanism for such a switch, because the MA domain is inhibitory with ∼1 kcal/mol to liganded Gag dimer assembly, and dimerization is coupled with the release of MA from the vicinity of the NA (as judged by the quench recovery; Fig. 6). This is consistent with the release of inhibitory MA interactions upon Gag oligomerization observed previously by fluorescence imaging (54). In more detail, because Gag domains carry out largely independent motions (46, 55), NA-induced dimerization of NC may be permissive for (or even promote) interactions of other Gag domains, as sketched in Fig. 10. In this way, nucleic acid–induced dimerization observed here ties in with the previous observation that myristate exposure in MA, which targets MA to the membrane, is linked to MA and CA interactions (50) and related to Gag nucleic acid binding (52).
Although CA domain interactions are not necessary for the NA-liganded dimerization studied here, they can still modulate the conformation of the dimer, as evidenced both by the fluorescence recovery in the dimer (Fig. 6) and by the augmentation of the dimer stability (Table 1). However, the increase in stability is much less than the ∼−6.7 kcal/mol of CA domain self-association, possibly due to unfavorable entropy associated with spatial constraints in engaging both NC and CA domains.
However, our data do not allow us to distinguish whether coexisting CA and NC interactions are restricted to the same molecules or can allow transient formation of trimer or higher oligomers (Fig. 10). In fact, the nucleic acid–induced dimerization may work in concert with oligomerization processes of other domains that have been reported, including the trimerization of the MA domain (52, 56), the CA domain dimerization (17), and oligomerization of the SP1 region (9, 20, 21) (as in Fig. 10e), to jointly allow for the two-dimensional lattice of hexamers in the virion. Larger complexes with higher stoichiometries would be favored at higher concentrations and in the crowded, assembly-promoting environment of the cellular milieu. In this context, the peculiar stoichiometry of the NA-liganded dimer with suppressed NA binding of the second Gag protomer is noteworthy. Perhaps this promotes assembly orthogonal to the NA strand, which is essential for generating a two-dimensional lattice.
In any event, the NA-induced dimerization observed in the present work is significantly stronger than either of the known oligomerization processes mediated by the CA domain or by the SP1 peptides, and therefore likely plays a significant role in the early assembly pathway. If patches of locally very high density of Gag on NA lead to stabilization of assembly intermediates, and if this is the role of the observed NA-induced dimerization, then it may be substituted in assembly through other means of populating Gag oligomers, including the replacement of NC with leucine or isoleucine zippers (57–59), very high total protein and NA concentrations, and/or ligands that stabilize CA-domain interactions (9).
As mentioned above, 2:1 complexes of NC in solution with small oligonucleotides have been reported previously (19). However, this dimerization mode would have been masked in other assembly studies employing longer polynucleotides where scaffolding can take place. Also, it would not necessarily be resolved in assays that report only indirectly on binding by monitoring protein conformational states (e.g. as in fluorescence quenching). Furthermore, we observed a dependence on solution conditions that would suppress this interaction at low pH, and, as expected for interactions with significant electrostatic contribution, at high salt, which would obscure the observed dimerization in techniques relying on these conditions.
From a methodological point of view, the present work highlights the potential of biophysical methods, in particular the novel combination of macroscopic hydrodynamic separation with fluorescence detection. We have previously shown that this strategy offers exquisite sensitivity and resolution for different binding states, which allows the study of interactions in the picomolar to micromolar range, and can be further enhanced by component-specific detection when using photoswitchable tags for the study of heterologous interacting systems (33, 60). Here, we have exploited for the first time the combination of hydrodynamic separation with total fluorescence intensity measurements to analyze structural differences in the sedimenting complexes. Although titrations of fluorescence quenching can be carried out in bench-top spectrofluorometers, their interpretation is significantly enhanced when the microscopic information from quenching can be combined with size information of macroscopic states observed through hydrodynamics in SV, so as to clarify the binding mechanism and the complex state associated with a quenching state. Conversely, the interpretation of the sedimentation signals is not possible without accounting for fluorescence signal changes in the different states (36). We believe that the combination of high-resolution hydrodynamics with fluorescence intensity quenching, energy transfer, or other proximity-based signals will be similarly applicable and provide a useful tool in the study of other complex multiprotein interactions.
Experimental procedures
Protein expression and purification
Cloning, expression, and purification of the Gag constructs used in the present work has been described previously (21, 26, 61, 62), with the following modifications: Gag constructs WTΔp6, WM, and ΔMA (all BH10 strain) were expressed from pET3XC vectors, in BL21(DE3) pLysS Escherichia coli. Cultures were grown at 37 °C to optical density of ∼0.6 when the temperature was lowered to 30 °C, and protein expression was induced with 0.4 mm isopropyl 1-thio-β-d-galactopyranoside for 4 h. All centrifugation and chromatographic steps were performed at 4 °C unless mentioned otherwise. Preliminary purification was performed utilizing phosphocellulose chromatography as described previously (61). The partially pure proteins were subsequently further purified by cation-exchange chromatography on Bio-Rad Macro-Prep High S cartridges, followed by size-exclusion chromatography on a Superose 12 column (GE Healthcare) in 20 mm HEPES, pH 7.3, 0.5 m NaCl, 1 mm DTT, 1 mm TCEP, 10% glycerol (v/v). The peaks containing pure proteins were concentrated to 2–5 mg/ml using Amicon centrifugal concentrators and stored at −80 °C.
Truncated HIV-1 Gag constructs, including CA, SP1-NC, SP1Δ1-NC, and SP1Δ7-NC, were expressed in BL21(DE3) RIPL cells (Agilent Technologies, Santa Clara, CA) at 37 °C for 5 h with 1 mm isopropyl 1-thio-β-d-galactopyranoside. CA was purified without tags as described previously (62). SP1-NC, SP1-NCΔ1, and SP1-NCΔ7 were expressed with N-terminal His tags (His6), followed by a thrombin cleavage site. For purification, the cells were first lysed by sonication in lysis buffer (40 mm Tris-HCl, 0.3 m NaCl, 5 mm DTT, 1 mm phenylmethylsulfonyl fluoride, 1× Roche complete protease inhibitors, pH 7.6) containing 0.1% (v/v) Igepal CA-630 (Sigma). The lysate was centrifuged at 15,000 × g for 20 min, and the pellet containing most of the protein was resuspended thoroughly in lysis buffer containing 1% (v/v) Igepal CA-630 and recentrifuged. This was performed a total of four times, followed by another four times in lysis buffer without detergent. The final pellet was solubilized in binding buffer (lysis buffer containing 6 m guanidine hydrochloride), and the protein bound to a 5-ml nickel-nitrilotriacetic acid column (Roche Applied Science) and, after washing with 10 column volumes of binding buffer, was refolded while bound to the column by exchanging the binding buffer with refolding buffer (40 mm Tris-HCl, pH 7.6, 0.3 m NaCl, 1 mm TCEP, 20 μm ZnCl2) by a linear gradient over 10 column volumes and further equilibrated for another 10 column volumes in refolding buffer. Subsequently, the pure protein was eluted with a linear imidazole gradient from 0 to 0.5 m and dialyzed against 40 mm Tris-HCl, pH 7.6, 0.05 m NaCl, 2 mm DTT, 1 mm TCEP. The proteins were digested with thrombin (EMD Millipore, Burlington, MA), and the cleaved tag and thrombin were eliminated by passing through 1-ml benzamidine-Sepharose (GE Healthcare) and nickel-nitrilotriacetic acid columns connected in tandem. The proteins were concentrated and stored at −80 °C. The N-terminal sequence of SP1-NC, shown up to the C terminus of SP1, after removal of the His6 tag is as follows: GSHMGHKARVLAEAMSQVTNSATIM …, leaving four residues from the tag. The underlined sequence comprises the residues from the CA domain that form a contiguous structural element with SP1. The constructs SP1Δ1-NC and SP1Δ7-NC have deletions of the first and seventh residues in SP1, respectively. Biophysical experiments reported span multiple separate preparations that provided consistent results.
Oligonucleotides
(GT)3 and (GT)8 oligonucleotides were purchased from Integrated DNA Technologies (Skokie, IL); (GT)2 and (GT)1 were purchased from the Keck Biotechnology Resource Laboratory at Yale University (New Haven, CT). Oligonucleotides (GT)3 (5′-GTGTGT-Alexa Fluor 488–3′) and (GT)8 (5′-GTGTGTGTGTGTGTGT-Alexa Fluor 488–3′) were used unless mentioned otherwise. Compared with fluorescein, Alexa Fluor 488 carries sulfonate groups that have been found to reduce artifacts related to hydrophobicity of the dye in protein interaction studies (63). Unlabeled (GT)3 was used for SV competition experiments and for ITC experiments. The oligonucleotides were purified by HPLC and received in a lyophilized form. They were reconstituted in a storage buffer of 20 mm Tris-HCl, 1 mm TCEP, 50 mm NaCl, pH 7.0, to reach a concentration of ∼100 μm. The actual concentration of each solution was determined using a UV-visible spectrophotometer and the extinction coefficient provided by the manufacturer. In SV experiments up to 19.6 μm, as expected, no self-association of (GT)3 was observed.
Analytical ultracentrifugation
SV experiments with absorbance and interference detections were performed in a ProteomeLab XL-I analytical ultracentrifuge (Beckman Coulter, Indianapolis, IN) by following the standard protocols (64, 65). SV experiments on the titration series for the mixture of Gag constructs with labeled (GT)3 at constant 10 nm were carried out in an Optima XL-A analytical ultracentrifuge equipped with a fluorescence detection system with excitation at 488 nm using a 10-milliwatt solid-state laser as the light source (AVIV Biomedical, Lakewood, NJ). The FDS-SV experiments were set up according to the standard procedures (66). The experimental temperature was 20 °C unless otherwise noted. The samples were loaded into AUC cell assemblies with 12- or 3-mm charcoal-filled Epon double-sector centerpieces and sapphire windows. The sample cells were loaded into a rotor for temperature equilibration for 2–3 h, followed by acceleration to full speed at 50,000 rpm. Continuous radial scans were initiated immediately using the selected detection systems. The accuracy of the determined s-values is ∼1% or better (67, 68). Control experiments at concentrations sufficient for absorbance and interference optical detection were carried out with unlabeled (GT)3 to rule out label-induced effects.
Binding model and hybrid fluorescence quench/sedimentation velocity analysis
In the ligand-linked dimerization model, the protein P can homodimerize in solution and form 1:1 complexes and 2:1 complexes with oligonucleotide N following mass action laws,
| (Eq. 1) |
| (Eq. 2) |
| (Eq. 3) |
with cumulative association equilibrium constants K and with molar concentrations of free protein and oligonucleotide cP and cN, protein dimer concentration c20, and complex concentrations c11 for the 1:1 complex, and c21 for the 2:1 protein/oligonucleotide complex, respectively. They relate to the known total concentrations as follows,
| (Eq. 4) |
| (Eq. 5) |
and all species concentrations can be calculated for a given solution composition by solving Equations 1–5. (For competition experiments with a second nucleotide, this binding model was extended accordingly, accounting for three components.)
The total fluorescence is the sum of signal contributions from each species, and in the present case with tagged oligonucleotide and nonfluorescent protein, it takes the following form,
| (Eq. 6) |
after normalization relative to the fluorescence signal obtained for N in the absence of P. Here q11 and q21 represent the relative changes in fluorescence quantum yield in the 1:1 and 2:1 complex, respectively, which are fitting parameters (see Supporting Tables S1 and S2).
In sedimentation experiments, all species migrate with their respective sedimentation coefficients, some of which can be fitting parameters, whereas others can be independently measured. For rapidly reversible reactions on the time scale of sedimentation, transport of all species is coupled, and as a consequence, the sample spatially stratifies into two phases (34, 69–71): 1) a fast-moving zone (reaction boundary, sedimenting with a velocity sr) is composed of both P and N, including free and all complex species in proportions such that their component-average sedimentation coefficient matches; 2) a slow-moving zone (undisturbed boundary, sedimenting with su) composed of only one component (i.e. either P (in self-association equilibrium) or free N). For given species sedimentation coefficients, binding constants, and initial concentrations, the species composition of both zones and their sedimentation coefficients sr and su can be unambiguously calculated in the theoretical framework of effective particle theory (34, 71). As is long known, the identity of the component providing the undisturbed boundary will have a discontinuous transition at a critical concentration dependent on all sedimentation parameters and binding constants (69, 70)—an effect that is well-documented experimentally and well-described in effective particle theory (34, 71, 72).
The signal-average sedimentation coefficient sw has therefore components from both moving zones.
| (Eq. 7) |
The first summation is over all species i in the undisturbed boundary at concentrations ci,u, and the second is over all species j in the reaction boundary at concentrations cj,r. All species' extinction coefficients (or signal coefficients) are denoted by ε. As we have shown previously (36), the distinction between contributions from undisturbed and reaction boundary is key for studying systems with rapidly interconverting complex formation associated with signal changes such as fluorescence quenching. (It reduces to the conventional signal-weighted average over all species in the absence of signal changes (36).) For example, for low protein concentrations, Equation 7 reduces to the following,
| (Eq. 8) |
where cN,u is the fraction of free oligonucleotide remaining in the undisturbed boundary, and cN,r is the corresponding fraction co-transported in the reaction boundary. In the titration of constant N with increasing P, cN,u will be zero beyond a critical concentration of P, and protein will constitute the undisturbed boundary.
For analysis of experimental SV data, diffusion-deconvoluted sedimentation coefficient distributions c(s) were first calculated from raw spatio-temporal sedimentation signals (73, 74) in SEDFIT (sedfitsedphat.nibib.nih.gov). Integration of c(s) comprising undisturbed and reaction boundaries yielded both the total signal and the signal-average sedimentation coefficient. Both isotherms I/I0 and sw as a function of loaded total concentrations were assembled and globally fitted with Equations 6 and 8, respectively, in SEDPHAT (sedfitsedphat.nibib.nih.gov) to determine best-fit quenching parameters q11 and q21, along with complex sedimentation coefficients (within a range constrained by hydrodynamic considerations), and binding constants. Where hydrodynamically well-resolved, additional isotherms from the reaction boundary were included in the global analysis and modeled with the concentration dependence of sr of the effective particle model (34, 71, 72). Further, where available, data at high concentrations acquired with absorbance or interference optics (showing no signal changes) were included in the global modeling and fitted with standard sw binding isotherms (34). Error analysis was carried out by Monte Carlo simulations with 2000 iterations.
Isothermal titration microcalorimetry
ITC titrations were performed using a VP-ITC microcalorimeter (Malvern, Northampton, MA) at 20 °C. The same working buffer (20 mm HEPES, pH 7.3, 100 mm NaCl, 1 mm TCEP) was used in all ITC experiments. Both SP1-NC and (GT)3 (unlabeled) were dialyzed overnight against the working buffer. The dialyzed samples were then diluted with the dialysis buffer to reach the targeted concentration. The degassed samples were loaded into the syringe and cell, respectively. After temperature equilibration, the power trace was monitored for 29 injections of 8 or 10 μl with a 180-s interval between injections. To account for the significant heat of dilution when injecting the oligonucleotide, 50 μm (GT)3 was titrated into the dialysis buffer as a control. Titration of SP1-NC into buffer was also carried out, and the observed heat of dilution was small and comparable with that of buffer titrated into buffer.
For analysis, ITC thermograms were integrated using NITPIC (75). Global isotherm analysis of the titrations was performed in SEDPHAT (version 15.2c) with 1:1 and 2:1 binding models (76). An incompetent fraction of the protein (20%) was included in modeling to account for the error in concentration or binding competency. For the titration of 50 μm (GT)3 into 20 μm of SP1-NC, the heat of dilution of (GT)3 was modeled with a slope determined from the data of (GT)3 titrated into buffer. Error projection based on F statistics was performed to determine the confidence intervals of the thermodynamic parameters (76, 77). Monte Carlo simulations with 1000 iterations at 95% confidence interval were performed to determine the error in the total free energy.
CD spectroscopy
CD spectra were acquired in a J-810 CD spectropolarimeter (JASCO, Easton, MD) in a low-salt buffer (2 mm HEPES, pH 7.3, 15 mm NaCl, 1 mm TCEP) at 20 °C and using 1-mm path length cuvettes. For practical reasons, CD data for NC experiments were acquired in standard buffer (20 mm HEPES, pH 7.3, 150 mm NaCl, 1 mm TCEP) with salt obscuring signals below 208 nm. The spectrum was recorded in triplicate from 260 to 203 nm in 0.2-nm steps while monitoring photomultiplier voltage. Spectral data exceeding the nominal upper limit of 700 V indicated by the manufacturer were dismissed, and only data up to 500 V were interpreted. Buffer signals were subtracted from the sample signals. Control SVs were carried out on recovered samples to exclude sample aggregation and verify the expected oligomeric state, taking advantage of the tag on (GT)3.
Author contributions
H. Z., S. A. D., A. R., and P. S. conceptualization; H. Z., S. A. D., S. H. K., and S. C. T. resources; H. Z. data curation; H. Z. and P. S. software; H. Z. formal analysis; H. Z., S. A. D., A. R., and P. S. validation; H. Z., S. A. D., S. H. K., S. C. T., and S. K. C. investigation; H. Z., S. A. D., S. K. C., and P. S. visualization; H. Z., S. A. D., and P. S. methodology; H. Z., S. A. D., S. C. T., A. R., and P. S. writing-review and editing; A. R. and P. S. supervision; A. R. and P. S. funding acquisition; A. R. and P. S. writing-original draft.
Supplementary Material
Acknowledgment
We are grateful to the reviewers of the manuscript for insightful suggestions.
This work was supported by the Intramural Research Programs of the National Institute of Biomedical Imaging and Bioengineering and NCI, Center for Cancer Research, and by the Intramural AIDS Targeted Antiviral Program of the National Institutes of Health. The authors declare that they have no conflicts of interest with the contents of this article. The content is solely the responsibility of the authors and does not necessarily represent the official views of the National Institutes of Health.
This article was selected as one of our Editors' Picks.
This article contains Tables S1 and S2 and Figs. S1–S8.
- VLP
- virus-like particle
- NA
- nucleic acid
- MA
- matrix domain
- CA
- capsid domain
- NC
- nucleocapsid domain
- SV
- sedimentation velocity analytical ultracentrifugation
- TCEP
- tris(2-carboxyethyl)phosphine
- WM
- mutation W316A/M317A
- ITC
- isothermal titration calorimetry
- FDS
- fluorescence detection system.
References
- 1. Sundquist W. I., and Kräusslich H.-G. (2012) HIV-1 assembly, budding, and maturation. Cold Spring Harb. Perspect. Med. 2, a006924 10.1101/cshperspect.a006924 [DOI] [PMC free article] [PubMed] [Google Scholar]
- 2. Ganser-Pornillos B. K., Yeager M., and Pornillos O. (2012) Assembly and architecture of HIV. in Viral Molecular Machines (Rossmann M. G., and Rao V. B., eds) pp. 441–465, Springer, Boston: [DOI] [PMC free article] [PubMed] [Google Scholar]
- 3. Rein A., Datta S. A. K., Jones C. P., and Musier-Forsyth K. (2011) Diverse interactions of retroviral Gag proteins with RNAs. Trends Biochem. Sci. 36, 373–380 10.1016/j.tibs.2011.04.001 [DOI] [PMC free article] [PubMed] [Google Scholar]
- 4. Rulli S. J. Jr., Hibbert C. S., Mirro J., Pederson T., Biswal S., and Rein A. (2007) Selective and nonselective packaging of cellular RNAs in retrovirus particles. J. Virol. 81, 6623–6631 10.1128/JVI.02833-06 [DOI] [PMC free article] [PubMed] [Google Scholar]
- 5. Muriaux D., Mirro J., Harvin D., and Rein A. (2001) RNA is a structural element in retrovirus particles. Proc. Natl. Acad. Sci. U.S.A. 98, 5246–5251 10.1073/pnas.091000398 [DOI] [PMC free article] [PubMed] [Google Scholar]
- 6. Campbell S., and Rein A. (1999) In vitro assembly properties of human immunodeficiency virus type 1 Gag protein lacking the p6 domain. J. Virol. 73, 2270–2279 [DOI] [PMC free article] [PubMed] [Google Scholar]
- 7. Wang M., Quinn C. M., Perilla J. R., Zhang H., Shirra R. Jr., Hou G., Byeon I. J., Suiter C. L., Ablan S., Urano E., Nitz T. J., Aiken C., Freed E. O., Zhang P., Schulten K., et al. (2017) Quenching protein dynamics interferes with HIV capsid maturation. Nat. Commun. 8, 1779 10.1038/s41467-017-01856-y [DOI] [PMC free article] [PubMed] [Google Scholar]
- 8. Byeon I.-J. L., Hou G., Han Y., Suiter C. L., Ahn J., Jung J., Byeon C.-H., Gronenborn A. M., and Polenova T. (2012) Motions on the millisecond time scale and multiple conformations of HIV-1 capsid protein: implications for structural polymorphism of CA assemblies. J. Am. Chem. Soc. 134, 6455–6466 10.1021/ja300937v [DOI] [PMC free article] [PubMed] [Google Scholar]
- 9. Wagner J. M., Zadrozny K. K., Chrustowicz J., Purdy M. D., Yeager M., Ganser-Pornillos B. K., and Pornillos O. (2016) Crystal structure of an HIV assembly and maturation switch. Elife 5, e17063 [DOI] [PMC free article] [PubMed] [Google Scholar]
- 10. Gres A. T., Kirby K. A., KewalRamani V. N., Tanner J. J., Pornillos O., and Sarafianos S. G. (2015) Structural virology: X-ray crystal structures of native HIV-1 capsid protein reveal conformational variability. Science 349, 99–103 10.1126/science.aaa5936 [DOI] [PMC free article] [PubMed] [Google Scholar]
- 11. Schur F. K. M., Hagen W. J. H., Rumlová M., Ruml T., Müller B., Kräusslich H.-G., and Briggs J. A. G. (2015) Structure of the immature HIV-1 capsid in intact virus particles at 8.8 Å resolution. Nature 517, 505–508 10.1038/nature13838 [DOI] [PubMed] [Google Scholar]
- 12. Olson E. D., and Musier-Forsyth K. (2019) Retroviral Gag protein–RNA interactions: implications for specific genomic RNA packaging and virion assembly. Semin. Cell Dev. Biol. 86, 129–139 10.1016/j.semcdb.2018.03.015 [DOI] [PMC free article] [PubMed] [Google Scholar]
- 13. Datta S. A. K., Curtis J. E., Ratcliff W., Clark P. K., Crist R. M., Lebowitz J., Krueger S., and Rein A. (2007) Conformation of the HIV-1 Gag protein in solution. J. Mol. Biol. 365, 812–824 10.1016/j.jmb.2006.10.073 [DOI] [PMC free article] [PubMed] [Google Scholar]
- 14. Dubois N., Khoo K. K., Ghossein S., Seissler T., Wolff P., McKinstry W. J., Mak J., Paillart J.-C., Marquet R., and Bernacchi S. (2018) The C-terminal p6 domain of the HIV-1 Pr55 Gag precursor is required for specific binding to the genomic RNA. RNA Biol. 15, 923–936 10.1080/15476286.2018.1481696 [DOI] [PMC free article] [PubMed] [Google Scholar]
- 15. Comas-Garcia M., Datta S. A. K., Baker L., Varma R., Gudla P. R., and Rein A. (2017) Dissection of specific binding of HIV-1 Gag to the “packaging signal” in viral RNA. Elife 6, e27055 10.7554/eLife.27055 [DOI] [PMC free article] [PubMed] [Google Scholar]
- 16. Webb J. A., Jones C. P., Parent L. J., Rouzina I., and Musier-Forsyth K. (2013) Distinct binding interactions of HIV-1 Gag to Psi and non-Psi RNAs: implications for viral genomic RNA packaging. RNA 19, 1078–1088 10.1261/rna.038869.113 [DOI] [PMC free article] [PubMed] [Google Scholar]
- 17. Gamble T. R., Yoo S., Vajdos F. F., von Schwedler U. K., Worthylake D. K., Wang H., McCutcheon J. P., Sundquist W. I., and Hill C. P. (1997) Structure of the carboxyl-terminal dimerization domain of the HIV-1 capsid protein. Science 278, 849–853 10.1126/science.278.5339.849 [DOI] [PubMed] [Google Scholar]
- 18. Datta S. A. K., Zhao Z., Clark P. K., Tarasov S., Alexandratos J. N., Campbell S. J., Kvaratskhelia M., Lebowitz J., and Rein A. (2007) Interactions between HIV-1 Gag molecules in solution: an inositol phosphate-mediated switch. J. Mol. Biol. 365, 799–811 10.1016/j.jmb.2006.10.072 [DOI] [PMC free article] [PubMed] [Google Scholar]
- 19. Fisher R. J., Fivash M. J., Stephen A. G., Hagan N. A., Shenoy S. R., Medaglia M. V., Smith L. R., Worthy K. M., Simpson J. T., Shoemaker R., McNitt K. L., Johnson D. G., Hixson C. V., Gorelick R. J., Fabris D., et al. (2006) Complex interactions of HIV-1 nucleocapsid protein with oligonucleotides. Nucleic Acids Res. 34, 472–484 10.1093/nar/gkj442 [DOI] [PMC free article] [PubMed] [Google Scholar]
- 20. Schur F. K. M., Obr M., Hagen W. J. H., Wan W., Jakobi A. J., Kirkpatrick J. M., Sachse C., Kräusslich H.-G., and Briggs J. A. G. (2016) An atomic model of HIV-1 capsid-SP1 reveals structures regulating assembly and maturation. Science 353, 506–508 10.1126/science.aaf9620 [DOI] [PubMed] [Google Scholar]
- 21. Datta S. A. K., Clark P. K., Fan L., Ma B., Harvin D. P., Sowder R. C. 2nd, Nussinov R., Wang Y.-X., and Rein A. (2016) Dimerization of the SP1 region of HIV-1 Gag induces a helical conformation and association into helical bundles: implications for particle assembly. J. Virol. 90, 1773–1787 10.1128/JVI.02061-15 [DOI] [PMC free article] [PubMed] [Google Scholar]
- 22. Datta S. A. K., Temeselew L. G., Crist R. M., Soheilian F., Kamata A., Mirro J., Harvin D., Nagashima K., Cachau R. E., and Rein A. (2011) On the role of the SP1 domain in HIV-1 particle assembly: a molecular switch? J. Virol. 85, 4111–4121 10.1128/JVI.00006-11 [DOI] [PMC free article] [PubMed] [Google Scholar]
- 23. Mallery D. L., Marquez C. L., McEwan W. A., Dickson C. F., Jacques D. A., Anandapadamanaban M., Bichel K., Towers G. J., Saiardi A., Böcking T., and James L. C. (2018) IP6 is an HIV pocket factor that prevents capsid collapse and promotes DNA synthesis. Elife 7, e35335 [DOI] [PMC free article] [PubMed] [Google Scholar]
- 24. Dick R. A., Zadrozny K. K., Xu C., Schur F. K. M., Lyddon T. D., Ricana C. L., Wagner J. M., Perilla J. R., Ganser-Pornillos B. K., Johnson M. C., Pornillos O., and Vogt V. M. (2018) Inositol phosphates are assembly co-factors for HIV-1. Nature 560, 509–512 10.1038/s41586-018-0396-4 [DOI] [PMC free article] [PubMed] [Google Scholar]
- 25. Gross I., Hohenberg H., Wilk T., Wiegers K., Grättinger M., Müller B., Fuller S., and Kräusslich H.-G. (2000) A conformational switch controlling HIV-1 morphogenesis. EMBO J. 19, 103–113 10.1093/emboj/19.1.103 [DOI] [PMC free article] [PubMed] [Google Scholar]
- 26. Comas-Garcia M., Kroupa T., Datta S. A., Harvin D. P., Hu W.-S., and Rein A. (2018) Efficient support of virus-like particle assembly by the HIV-1 packaging signal. Elife 7, e38438 [DOI] [PMC free article] [PubMed] [Google Scholar]
- 27. Wilkinson K. A., Gorelick R. J., Vasa S. M., Guex N., Rein A., Mathews D. H., Giddings M. C., and Weeks K. M. (2008) High-throughput SHAPE analysis reveals structures in HIV-1 genomic RNA strongly conserved across distinct biological states. PLoS Biol. 6, e96 10.1371/journal.pbio.0060096 [DOI] [PMC free article] [PubMed] [Google Scholar]
- 28. De Guzman R. N., Wu Z. R., Stalling C. C., Pappalardo L., Borer P. N., and Summers M. F. (1998) Structure of the HIV-1 nucleocapsid protein bound to the SL3 Ψ-RNA recognition element. Science 279, 384–388 10.1126/science.279.5349.384 [DOI] [PubMed] [Google Scholar]
- 29. Amarasinghe G. K., De Guzman R. N., Turner R. B., Chancellor K. J., Wu Z. R., and Summers M. F. (2000) NMR structure of the HIV-1 nucleocapsid protein bound to stem-loop SL2 of the Ψ-RNA packaging signal. implications for genome recognition. J. Mol. Biol. 301, 491–511 10.1006/jmbi.2000.3979 [DOI] [PubMed] [Google Scholar]
- 30. Karpel R. L., Henderson L. E., and Oroszlan S. (1987) Interactions of retroviral structural proteins with single-stranded nucleic acids. J. Biol. Chem. 262, 4961–4967 [PubMed] [Google Scholar]
- 31. Fisher R. J., Rein A., Fivash M., Urbaneja M. A., Casas-Finet J. R., Medaglia M., and Henderson L. E. (1998) Sequence-specific binding of human immunodeficiency virus type 1 nucleocapsid protein to short oligonucleotides. J. Virol. 72, 1902–1909 [DOI] [PMC free article] [PubMed] [Google Scholar]
- 32. MacGregor I. K., Anderson A. L., and Laue T. M. (2004) Fluorescence detection for the XLI analytical ultracentrifuge. Biophys. Chem. 108, 165–185 10.1016/j.bpc.2003.10.018 [DOI] [PubMed] [Google Scholar]
- 33. Zhao H., Mayer M. L., and Schuck P. (2014) Analysis of protein interactions with picomolar binding affinity by fluorescence-detected sedimentation velocity. Anal. Chem. 86, 3181–3187 10.1021/ac500093m [DOI] [PMC free article] [PubMed] [Google Scholar]
- 34. Schuck P., and Zhao H. (2017) Sedimentation Velocity Analytical Ultracentrifugation: Interacting Systems, CRC Press, Boca Raton, FL [Google Scholar]
- 35. Tanwar H. S., Khoo K. K., Garvey M., Waddington L., Leis A., Hijnen M., Velkov T., Dumsday G. J., McKinstry W. J., and Mak J. (2017) The thermodynamics of Pr55Gag-RNA interaction regulate the assembly of HIV. PLoS Pathog. 13, e1006221 10.1371/journal.ppat.1006221 [DOI] [PMC free article] [PubMed] [Google Scholar]
- 36. Chaturvedi S. K., Zhao H., and Schuck P. (2017) Sedimentation of reversibly interacting macromolecules with changes in fluorescence quantum yield. Biophys. J. 112, 1374–1382 10.1016/j.bpj.2017.02.020 [DOI] [PMC free article] [PubMed] [Google Scholar]
- 37. Zhao H., and Schuck P. (2012) Global multi-method analysis of affinities and cooperativity in complex systems of macromolecular interactions. Anal. Chem. 84, 9513–9519 10.1021/ac302357w [DOI] [PMC free article] [PubMed] [Google Scholar]
- 38. Wiseman T., Williston S., Brandts J. F., and Lin L. N. (1989) Rapid measurement of binding constants and heats of binding using a new titration calorimeter. Anal. Biochem. 179, 131–137 10.1016/0003-2697(89)90213-3 [DOI] [PubMed] [Google Scholar]
- 39. Mikles D. C., Bhat V., Schuchardt B. J., Deegan B. J., Seldeen K. L., McDonald C. B., and Farooq A. (2013) PH modulates the binding of early growth response protein 1 transcription factor to DNA. FEBS J. 280, 3669–3684 10.1111/febs.12360 [DOI] [PMC free article] [PubMed] [Google Scholar]
- 40. Bombarda E., Grell E., Roques B. P., and Mély Y. (2007) Molecular mechanism of the Zn2+-induced folding of the distal CCHC finger motif of the HIV-1 nucleocapsid protein. Biophys. J. 93, 208–217 10.1529/biophysj.106.101378 [DOI] [PMC free article] [PubMed] [Google Scholar]
- 41. Morellet N., Déméné H., Teilleux V., Huynh-Dinh T., de Rocquigny H., Fournié-Zaluski M. C., and Roques B. P. (1998) Structure of the complex between the HIV-1 nucleocapsid protein NCp7 and the single-stranded pentanucleotide d(ACGCC). J. Mol. Biol. 283, 419–434 10.1006/jmbi.1998.2098 [DOI] [PubMed] [Google Scholar]
- 42. Bloomfield V. A., and Rouzina I. (1998) Use of Poisson-Boltzmann equation to analyze ion binding to DNA. Methods Enzymol. 295, 364–378 10.1016/S0076-6879(98)95049-2 [DOI] [PubMed] [Google Scholar]
- 43. Levin J. G., Guo J., Rouzina I., and Musier-Forsyth K. (2005) Nucleic acid chaperone activity of HIV-1 nucleocapsid protein: critical role in reverse transcription and molecular mechanism. Prog. Nucleic Acids Res. Mol. Biol. 80, 217–286 10.1016/S0079-6603(05)80006-6 [DOI] [PubMed] [Google Scholar]
- 44. Newman J. L., Butcher E. W., Patel D. T., Mikhaylenko Y., and Summers M. F. (2004) Flexibility in the P2 domain of the HIV-1 Gag polyprotein. Protein Sci. 13, 2101–2107 10.1110/ps.04614804 [DOI] [PMC free article] [PubMed] [Google Scholar]
- 45. Briggs J. A. G., Riches J. D., Glass B., Bartonova V., Zanetti G., and Kräusslich H.-G. (2009) Structure and assembly of immature HIV. Proc. Natl. Acad. Sci. U.S.A. 106, 11090–11095 10.1073/pnas.0903535106 [DOI] [PMC free article] [PubMed] [Google Scholar]
- 46. Deshmukh L., Ghirlando R., and Clore G. M. (2015) Conformation and dynamics of the Gag polyprotein of the human immunodeficiency virus 1 studied by NMR spectroscopy. Proc. Natl. Acad. Sci. U.S.A. 112, 3374–3379 10.1073/pnas.1501985112 [DOI] [PMC free article] [PubMed] [Google Scholar]
- 47. Datta S. A. K., Heinrich F., Raghunandan S., Krueger S., Curtis J. E., Rein A., and Nanda H. (2011) HIV-1 Gag extension: conformational changes require simultaneous interaction with membrane and nucleic acid. J. Mol. Biol. 406, 205–214 10.1016/j.jmb.2010.11.051 [DOI] [PMC free article] [PubMed] [Google Scholar]
- 48. Purohit P., Dupont S., Stevenson M., and Green M. R. (2001) Sequence-specific interaction between HIV-1 matrix protein and viral genomic RNA revealed by in vitro genetic selection. RNA 7, 576–584 10.1017/S1355838201002023 [DOI] [PMC free article] [PubMed] [Google Scholar]
- 49. Kutluay S. B., Zang T., Blanco-Melo D., Powell C., Jannain D., Errando M., and Bieniasz P. D. (2014) Global changes in the RNA binding specificity of HIV-1 gag regulate virion genesis. Cell 159, 1096–1109 10.1016/j.cell.2014.09.057 [DOI] [PMC free article] [PubMed] [Google Scholar]
- 50. Gaines C. R., Tkacik E., Rivera-Oven A., Somani P., Achimovich A., Alabi T., Zhu A., Getachew N., Yang A. L., McDonough M., Hawkins T., Spadaro Z., and Summers M. F. (2018) HIV-1 matrix protein interactions with tRNA: implications for membrane targeting. J. Mol. Biol. 430, 2113–2127 10.1016/j.jmb.2018.04.042 [DOI] [PMC free article] [PubMed] [Google Scholar]
- 51. Alfadhli A., Still A., and Barklis E. (2009) Analysis of human immunodeficiency virus type 1 matrix binding to membranes and nucleic acids. J. Virol. 83, 12196–12203 10.1128/JVI.01197-09 [DOI] [PMC free article] [PubMed] [Google Scholar]
- 52. Tang C., Loeliger E., Luncsford P., Kinde I., Beckett D., and Summers M. F. (2004) Entropic switch regulates myristate exposure in the HIV-1 matrix protein. Proc. Natl. Acad. Sci. U.S.A. 101, 517–522 10.1073/pnas.0305665101 [DOI] [PMC free article] [PubMed] [Google Scholar]
- 53. Chukkapalli V., Oh S. J., and Ono A. (2010) Opposing mechanisms involving RNA and lipids regulate HIV-1 Gag membrane binding through the highly basic region of the matrix domain. Proc. Natl. Acad. Sci. U.S.A. 107, 1600–1605 10.1073/pnas.0908661107 [DOI] [PMC free article] [PubMed] [Google Scholar]
- 54. Perez-Caballero D., Hatziioannou T., Bieniasz P. D., and Martin-Serrano J. (2004) Human immunodeficiency virus type 1 matrix inhibits and confers cooperativity on Gag precursor-membrane interactions. J. Virol. 78, 9560–9563 10.1128/JVI.78.17.9560-9563.2004 [DOI] [PMC free article] [PubMed] [Google Scholar]
- 55. Tang C., Ndassa Y., and Summers M. F. (2002) Structure of the N-terminal 283-residue fragment of the immature HIV-1 Gag polyprotein. Nat. Struct. Biol. 9, 537–543 10.1038/nsb806 [DOI] [PubMed] [Google Scholar]
- 56. Hill C. P., Worthylake D., Bancroft D. P., Christensen A. M., and Sundquist W. I. (1996) Crystal structures of the trimeric human immunodeficiency virus type 1 matrix protein: implications for membrane association and assembly. Proc. Natl. Acad. Sci. U.S.A. 93, 3099–3104 10.1073/pnas.93.7.3099 [DOI] [PMC free article] [PubMed] [Google Scholar]
- 57. Zhang Y., Qian H., Love Z., and Barklis E. (1998) Analysis of the assembly function of the human immunodeficiency virus type 1 gag protein nucleocapsid domain. J. Virol. 72, 1782–1789 [DOI] [PMC free article] [PubMed] [Google Scholar]
- 58. Crist R. M., Datta S. A. K., Stephen A. G., Soheilian F., Mirro J., Fisher R. J., Nagashima K., and Rein A. (2009) Assembly properties of human immunodeficiency virus type 1 Gag-leucine zipper chimeras: implications for retrovirus assembly. J. Virol. 83, 2216–2225 10.1128/JVI.02031-08 [DOI] [PMC free article] [PubMed] [Google Scholar]
- 59. Accola M. A., Strack B., and Göttlinger H. G. (2000) Efficient particle production by minimal Gag constructs which retain the carboxy-terminal domain of human immunodeficiency virus type 1 capsid-p2 and a late assembly domain. J. Virol. 74, 5395–5402 10.1128/JVI.74.12.5395-5402.2000 [DOI] [PMC free article] [PubMed] [Google Scholar]
- 60. Zhao H., Fu Y., Glasser C., Andrade Alba E. J., Mayer M. L., Patterson G., and Schuck P. (2016) Monochromatic multicomponent fluorescence sedimentation velocity for the study of high-affinity protein interactions. Elife 5, e17812 [DOI] [PMC free article] [PubMed] [Google Scholar]
- 61. Datta S. A. K., and Rein A. (2009) Preparation of recombinant HIV-1 Gag protein and assembly of virus-like particles in vitro. Methods Mol. Biol. 485, 197–208 10.1007/978-1-59745-170-3_14 [DOI] [PMC free article] [PubMed] [Google Scholar]
- 62. Lanman J., Sexton J., Sakalian M., and Prevelige P. E. (2002) Kinetic analysis of the role of intersubunit interactions in human immunodeficiency virus type 1 capsid protein assembly in vitro. J. Virol. 76, 6900–6908 10.1128/JVI.76.14.6900-6908.2002 [DOI] [PMC free article] [PubMed] [Google Scholar]
- 63. Zhao H., Lomash S., Glasser C., Mayer M. L., and Schuck P. (2013) Analysis of high affinity self-association by fluorescence optical sedimentation velocity analytical ultracentrifugation of labeled proteins: opportunities and limitations. PLoS One 8, e83439 10.1371/journal.pone.0083439 [DOI] [PMC free article] [PubMed] [Google Scholar]
- 64. Zhao H., Brautigam C. A., Ghirlando R., and Schuck P. (2013) Overview of current methods in sedimentation velocity and sedimentation equilibrium analytical ultracentrifugation. Curr. Protoc. Protein Sci. Chapter 20, Unit 12.1 10.1002/0471140864.ps2012s71 [DOI] [PMC free article] [PubMed] [Google Scholar]
- 65. Schuck P., Zhao H., Brautigam C. A., and Ghirlando R. (2015) Basic Principles of Analytical Ultracentrifugation, CRC Press, Inc., Boca Raton, FL [Google Scholar]
- 66. Chaturvedi S. K., Ma J., Zhao H., and Schuck P. (2017) Use of fluorescence-detected sedimentation velocity to study high-affinity protein interactions. Nat. Protoc. 12, 1777–1791 10.1038/nprot.2017.064 [DOI] [PMC free article] [PubMed] [Google Scholar]
- 67. Zhao H., Ghirlando R., Alfonso C., Arisaka F., Attali I., Bain D. L., Bakhtina M. M., Becker D. F., Bedwell G. J., Bekdemir A., Besong T. M. D., Birck C., Brautigam C. A., Brennerman W., Byron O., et al. (2015) A multilaboratory comparison of calibration accuracy and the performance of external references in analytical ultracentrifugation. PLoS One 10, e0126420 10.1371/journal.pone.0126420 [DOI] [PMC free article] [PubMed] [Google Scholar]
- 68. Ghirlando R., Balbo A., Piszczek G., Brown P. H., Lewis M. S., Brautigam C. A., Schuck P., and Zhao H. (2013) Improving the thermal, radial, and temporal accuracy of the analytical ultracentrifuge through external references. Anal. Biochem. 440, 81–95 10.1016/j.ab.2013.05.011 [DOI] [PMC free article] [PubMed] [Google Scholar]
- 69. Gilbert G. A., and Jenkins R. C. L. (1956) Boundary problems in the sedimentation and electrophoresis of complex systems in rapid reversible equilibrium. Nature 177, 853–854 10.1038/177853a0 [DOI] [PubMed] [Google Scholar]
- 70. Fujita H. (1975) Foundations of Ultracentrifugal Analysis, John Wiley & Sons, Inc., New York [Google Scholar]
- 71. Schuck P. (2010) Sedimentation patterns of rapidly reversible protein interactions. Biophys. J. 98, 2005–2013 10.1016/j.bpj.2009.12.4336 [DOI] [PMC free article] [PubMed] [Google Scholar]
- 72. Zhao H., Balbo A., Brown P. H., and Schuck P. (2011) The boundary structure in the analysis of reversibly interacting systems by sedimentation velocity. Methods 54, 16–30 10.1016/j.ymeth.2011.01.010 [DOI] [PMC free article] [PubMed] [Google Scholar]
- 73. Schuck P. (2000) Size-distribution analysis of macromolecules by sedimentation velocity ultracentrifugation and Lamm equation modeling. Biophys. J. 78, 1606–1619 10.1016/S0006-3495(00)76713-0 [DOI] [PMC free article] [PubMed] [Google Scholar]
- 74. Schuck P. (2016) Sedimentation Velocity Analytical Ultracentrifugation: Discrete Species and Size-Distributions of Macromolecules and Particles, CRC Press, Inc., Boca Raton, FL [Google Scholar]
- 75. Keller S., Vargas C., Zhao H., Piszczek G., Brautigam C. A., and Schuck P. (2012) High-precision isothermal titration calorimetry with automated peak shape analysis. Anal. Chem. 84, 5066–5073 10.1021/ac3007522 [DOI] [PMC free article] [PubMed] [Google Scholar]
- 76. Brautigam C. A., Zhao H., Vargas C., Keller S., and Schuck P. (2016) Integration and global analysis of isothermal titration calorimetry data for studying macromolecular interactions. Nat. Protoc. 11, 882–894 10.1038/nprot.2016.044 [DOI] [PMC free article] [PubMed] [Google Scholar]
- 77. Johnson M. L. (1992) Why, when, and how biochemists should use least squares. Anal. Biochem. 206, 215–225 10.1016/0003-2697(92)90356-C [DOI] [PubMed] [Google Scholar]
Associated Data
This section collects any data citations, data availability statements, or supplementary materials included in this article.