
Figure 1.
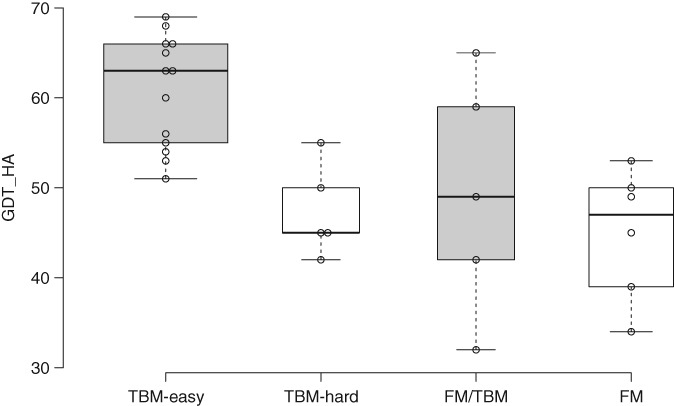
Box plot, prepared with BoxPlotR,8 showing the distribution of GDT_HA values seen in starting models for refinement derived from different initial modeling categories
Official websites use .gov
A
.gov website belongs to an official
government organization in the United States.
Secure .gov websites use HTTPS
A lock (
) or https:// means you've safely
connected to the .gov website. Share sensitive
information only on official, secure websites.
Box plot, prepared with BoxPlotR,8 showing the distribution of GDT_HA values seen in starting models for refinement derived from different initial modeling categories