

Abstract
Reconstitution of lyophilized disaccharide formulations results in the formation of nano-sized air bubbles that persist in suspension for weeks. If proteins are present, interactions with nanobubbles may cause loss of monomeric protein and formation of sub-visible particles. The goals of this work are to determine the mechanism(s) by which nanobubbles form in reconstituted lyophilized formulations, and to develop strategies for reducing nanobubble generation. We hypothesize that nanobubbles are created from nano-sized gas pockets within lyophilized solids, which become bubbles when the surrounding matrix is dissolved away during reconstitution. Nano-sized voids may originate from small ice crystals formed within the concentrated liquid during freezing that subsequently sublime during drying. Nanobubble concentrations are correlated with the extent of mannitol crystallization during freezing. Nano-sized ice crystals, induced by the release of water during mannitol crystallization, were responsible for nanobubble formation. The presence of trehalose or sucrose, in formulations with low mannitol concentrations, inhibited excipient crystallization during lyophilization and reduced nanobubble levels following reconstitution. Our results show a correlation between nanobubble formation and concentrations of insoluble IL-1ra aggregates, suggesting that minimizing nanobubble generation may be an effective strategy for reducing protein aggregation following reconstitution.
Introduction
The effect of sub-visible particulate matter on the safety and efficacy of parenterally administered therapeutic proteins is a growing concern in the pharmaceutical industry.1 Particulate matter in protein formulations can be generated by aggregation of the protein, and shed from wetted surfaces including those presented by filling pumps and product containers/closures.2 Another source of particulates was recently identified by Zhou et al.,3 who found that reconstitution of lyophilized formulations can generate a large number of nano-sized air bubbles. These nanobubbles exhibit long-term stability, remain suspended for more than a week after reconstitution, and are not readily removed by degassing.3 High nanobubble concentrations in reconstituted lyophilized formulations have been associated with increased rates of protein aggregation.4
Because proteins in aqueous formulations typically exhibit high rates of chemical and physical degradation, lyophilization is often employed to increase their long term storage stability.5–7,8–11 In lyophilized formulations, proteins typically are dehydrated and stabilized in glassy matrices composed of non-reducing disaccharides such as trehalose or sucrose. Using these formulations, long term storage stability (e.g., 18–24 months) may be achieved.12 However, even in the presence of stabilizing disaccharides, lyophilization may result in protein structural perturbations and protein aggregation.13–16 These degradation processes are commonly attributed to freezing- or dehydration-related stresses imparted during lyophilization.17 The formation of nanobubbles upon reconstitution and their subsequent promotion of protein aggregation may provide an alternative explanation for protein destabilization in lyophilized formulations, and thus it may be beneficial to minimize the number of nanobubbles formed during reconstitution of lyophilized protein formulations.
The goal of this work is to identify strategies for minimizing nanobubble formation upon reconstitution of lyophilized formulations. The development of formulation or processing strategies for reducing nanobubble generation in lyophilized samples requires first an understanding of the mechanism(s) by which nanobubbles are generated. We hypothesize that nanobubbles arise from nano-sized voids within glassy lyophilized matrices that become nanobubbles of similar dimensions when the matrix dissolves away during reconstitution. A similar mechanism has been used to explain the larger, micron-sized and visible bubbles observed in protein formulations after lyophilization and reconstitution.18
The formation of nano-sized voids during lyophilization of protein formulations likely depends on the physical properties of their components. To date, published studies of nanobubbles in reconstituted lyophilized formulations have relied on the disaccharide trehalose as the major formulation component.3, 4 Because lyophilization of trehalose solutions generates amorphous solids, we hypothesized that such glassy solids might be necessary for the formation and stability of nano-sized voids, and that structural changes in the solids induced by the addition of a crystallizing excipient or by annealing at temperatures above the glass transition temperature could have significant impact on nano-void formation and consequent nanobubble generation. Thus, we first compared nanobubble concentrations observed after reconstitution of lyophilized sucrose and trehalose, two excipients expected to form amorphous solids when lyophilized. Next, we added progressively higher concentrations of mannitol, a crystallizing excipient, to trehalose and sucrose formulations to determine how nanobubble generation was influenced by cake crystallinity. In addition, we evaluated the effect of co-lyophilizing a protein, IL-1ra, on the formation of nanobubbles and monitored protein particle formation following reconstitution.
Materials and Methods
Materials
Recombinant human interleukin-1 receptor antagonist (IL-1ra), at a concentration of 100 mg/mL, was donated by Amgen (Thousand Oaks, CA). D -(+)- trehalose dihydrate (Pfanstiehl, Waukegan, Illinois), sucrose (Avantor, Radnor, Pennsylvania), D-mannitol (Sigma-Aldrich, St. Louis, Missouri), sodium citrate (Avantor) and sodium chloride (Fisher Scientific, Hampton, New Hampshire) were of pharmaceutical grade or higher.
Sample preparation
Solutions (10% w/v) of each mannitol, sucrose and trehalose were prepared by dissolving in ultrapure water and filtered (0.02 mm, Whatman Anotop 25 sterile syringe filter, Maidstone, UK). These solutions were then mixed to obtain the desired molar fraction of mannitol in each solution while maintaining a total excipient concentration of 10% w/v. After filtering, 3 mL of solution was aliquoted into 20 mL Fiolax vials (Schott, Mainz, Germany) and capped with two-legged high purity stoppers (Wheaton, Millville, New Jersey).
For experiments with IL-1ra, a stock solution of IL-1ra was prepared by dialysis into 10 mM sodium citrate buffer using a 10 kilodalton dialysis cassette (Slide-A-Lyzer, ThermoFisher Scientific, Waltham, Massachusetts) and filtered (0.22 µm, Millex GV PVDF, Millipore Sigma, Burlington, Massachusetts). Subsequently, IL-1ra concentration was verified using UV adsorption at 280 nm. Stock solutions (15% w/v) of mannitol and trehalose were prepared by dissolving each excipient in 10 mM sodium citrate buffer (pH 6.6). These two solutions were mixed to obtain a stock mixture containing 0.43 mole fraction mannitol at a total solute concentration of 15% w/v. Finally, IL-1ra stock solution, excipient stock solutions, and 10 mM sodium citrate buffer (pH 6.6) were combined in appropriate ratios to obtain a final excipient concentration of 10% w/v and IL-1ra concentrations ranging from 0.1 to 10 mg/mL.
Lyophilization protocol
Sample vials were loaded directly into a lyophilizer (FTS Systems Lyostar 1, Warminster, PA) at room temperature. Lyophilizer shelves were cooled from room temperature to −40 °C at 1 °C/min and held at −40 °C for 300 minutes to completely freeze vial contents. Primary drying was initiated by raising the shelf temperature to −20 °C while maintaining a chamber pressure of 70 mTorr. The samples were dried for 1700 minutes before initiating secondary drying by increasing the shelf temperature to 33 °C at 0.1 °C/min. After drying for 240 minutes at 33 °C, the chamber was backfilled with dry nitrogen and the vials were sealed prior to their removal from the chamber.
Some samples were lyophilized according to a protocol that included an annealing step prior to the initiation of primary drying. These samples were frozen as described above for the standard lyophilization cycle. After holding the shelf at −40 °C for 300 min, the temperature was increased to −5 °C over 25 minutes and held for 6 hours. Following the annealing step, the samples were re-cooled to −40 °C and held for another 5 hours. Following these freezing and annealing steps, primary and secondary drying were conducted using the same protocol described previously for the standard lyophilization cycle.
Powder X-ray Diffractometry
Data were collected with a diffractometer (D8 ADVANCE, Bruker AXS, Madison, WI) using Cu Kα radiation (40 kV × 40 mA) over an angular range of 5−35° 2θ with a step size of 0.0196° and a dwell time of 0.5 s at each step. Data were compared with the standard patterns of a-mannitol (# 00–022-1793), β-mannitol (# 00–022-1797), δ-mannitol (# 00–022-1794) and mannitol hemihydrate (# 02–086-22–93) in the Powder Diffraction Files.19
The percent crystallinity of the samples were calculated using the relation:20
Crystallinity (%) = (Area under the crystalline peaks/ Total diffracted intensity) × 100
Particle Characterization Methods
NanoSight nanoparticle tracking analysis (NTA) (Malvern Panalytical, Westborough, MA) was utilized to measure the concentration and size distribution of nanoparticles with dimensions between 50 and 1000 nm. Samples were injected using a 1 mL silicone oil-free syringe while taking care to minimize bubble formation. Once the samples were loaded, camera settings were optimized based on the particle concentrations and properties of particles in each sample. Following optimization of the camera settings, 60 second videos were recorded in triplicate. Nanoparticle concentrations and diameters were then calculated using the NanoSight 3.0 analysis software.
A resonant mass measurement instrument (Archimedes, Malvern Panalytical, Westborough, MA) was employed to differentiate between particle types based upon their densities relative to that of the bulk fluid. This instrument utilizes the principle of resonant mass measurement to classify particles as either positively or negatively buoyant relative to the bulk fluid density. Samples were measured without any prior filtration or dilution. They were loaded to a Hi-Q micro sensor chip for 20 seconds before acquiring data for 5 minutes. Between samples, the sensor was rinsed with ultrapure water for 90 seconds.
The concentration and size distribution of particles of size greater than 1 micron generated after incubating nanobubbles with IL-1ra were monitored using flow imaging microscopy (FlowCAM VS1; Fluid Imaging Technology Inc., Scarborough, ME). The instrument was operated with a FC100 flow cell as well as a 10x objective and collimator. Analyses were conducted at a flow rate of 0.080 mL/min and a sample volume of 0.2 mL was analyzed for each sample. All measurements were conducted in triplicate.
Secondary Drying of Trehalose Dihydrate
Samples of crystalline trehalose dihydrate (3 g) were placed into 20 mL glass vials (Schott, Mainz, Germany). The vials were placed on the shelf of the lyophilizer and the temperature was rapidly increased to 33 °C. Once the desired temperature was reached, the chamber pressure was reduced to 70 mTorr. The samples were dried for 12 hours before backfilling the chamber with dry nitrogen and stoppered prior to removal from the lyophilizer.
Dried samples were reconstituted with 3 mL of ultrapure water, allowed sufficient time for complete trehalose dissolution, prior to particle characterization with NTA. Particle content in these samples were compared to 3 g samples of trehalose dihydrate dissolved in 3 mL of ultrapure water.
To probe the density of nanoparticles formed upon dissolution of dehydrated trehalose dihydrate, the concentration of nanoparticles in the bottom and top fraction of samples were measured following ultracentrifugation. Samples of dissolved dehydrated trehalose dihydrate (3 mL) were aliquoted into polycarbonate tubes and centrifuged at 208,000 relative centrifugal force (rcf) for 75 minutes using a TLA-100.3 rotor in a benchtop ultracentrifuge (TL-100, Beckman, Indianapolis, Indiana). Aliquots (1 mL) were removed immediately from the bottom and top of the ultracentrifuge tube using an 18-gauge needle and a 1 mL silicone oil-free syringe. Nanoparticle concentrations were then measured with NTA using the procedure described above.
Differential Scanning Calorimetry (DSC)
A differential scanning calorimeter (model Q2000, TA Instruments) equipped with a refrigerated cooling accessory was used. The instrument was calibrated with indium. About 5 mg of the sample was filled in an aluminum pan and heated under nitrogen purge (50 mL/min). The specific pan configuration and the heating rate are given in the figure legend. The DSC data were analyzed using the Universal Analysis software.
Size Exclusion High Performance Liquid Chromatography
Loss of monomeric IL-1ra from solution was monitored at 280 nm using a high-performance liquid chromatograph (Agilent 1100, Santa Clara, California) equipped with a variable wavelength detector. Insoluble IL-1ra was separated from any soluble oligomers using a size exclusion column (Tosoh TSKgel G3000SWxl, Tokyo, Japan) combined with a guard column (Tosoh TSKgel, Tokyo, Japan). The system was operated at 0.6 ml/min with a mobile phase consisting of 10 mM sodium citrate buffer with 140 mM NaCl (pH 6.6). Loss of monomeric protein from the solution was calculated using the area under the monomer peak and compared to areas measured for unstressed controls.
Results
Effect of Excipient Physical Form on Nanobubble Formation in Lyophilized Cakes
Lyophilized cakes of different compositions were reconstituted with ultrapure water. After allowing sufficient time for complete dissolution of the solid, the generated nanobubbles were characterized using NTA. As described previously and illustrated in Figure 1, reconstitution of lyophilized formulations of glassy sugars resulted in the formation of nano-sized air bubbles that were approximately 100 nm in diameter.3 In mannitol/disaccharide mixtures, as the mole fraction of mannitol increased (and the disaccharide concentration simultaneously decreased), the concentration of nanobubbles decreased until a minimum nanobubble concentration was reached at a mannitol mole fraction of ca. 0.43. At higher mannitol molefractions, nanobubble concentrations progressively increased, reaching a maximum of 1.5 × 10¹⁰ nanobubbles/mL in samples containing pure mannitol.
Figure 1.

Nanobubble concentration as a function of mannitol mole fraction following reconstitution of lyophilized formulations of (A) mannitol and trehalose, and (B) mannitol and sucrose. Samples were lyophilized using the standard lyophilization protocol (orange squares) or with the addition of an annealing step at −5 °C p rior to primary drying (blue diamonds). Mean ± SD (n=3). For some points, error bars are not visible because they are smaller than the symbol size.
We were interested in investigating whether excipient crystallization and relaxation processes in frozen solids occurring prior to primary drying affected the concentration of nanobubbles that could be observed after reconstitution. Therefore, a pre-drying annealing step at −5 °C for 6 hours was added to the standard lyophilization protocol. Nanobubble concentrations were profoundly influenced by the annealing step (Figure 1). Annealing of frozen trehalose solutions increased nanobubble concentrations from (2.8 ± 0.2) x 109 to (5.5 ± 0.3) x 109 mL-1. Likewise, increases in nanobubble concentrations were observed after annealing both sucrose and trehalose formulations containing 0.43 and 0.63 molar fraction mannitol. In contrast, at mannitol mole fractions above 0.77, annealing resulted in a pronounced reduction in nanobubble concentrations (Figure 1).
Powder X-ray diffractometry (PXRD) was used to quantify mannitol crystallization in the formulations lyophilized with or without an annealing step. As shown in Figure 2, the extent of crystallization was dependent on the ratio of trehalose to mannitol in the lyophilized cake. Following the standard lyophilization protocol, up to a mannitol mole fraction of 0.43, there was no evidence of crystallization of either mannitol or trehalose. As the mannitol concentration was further increased, the extent of crystallization increased, reaching a maximum of 77% crystalline content for pure mannitol. At moderate mannitol mole fractions (0.43 – 0.77), the addition of an annealing step resulted in an appreciable increase in the cake crystallinity. However, when the mannitol mole fraction exceeded 0.75, annealing did not increase the extent of crystallization in lyophilized formulations.
Figure 2.
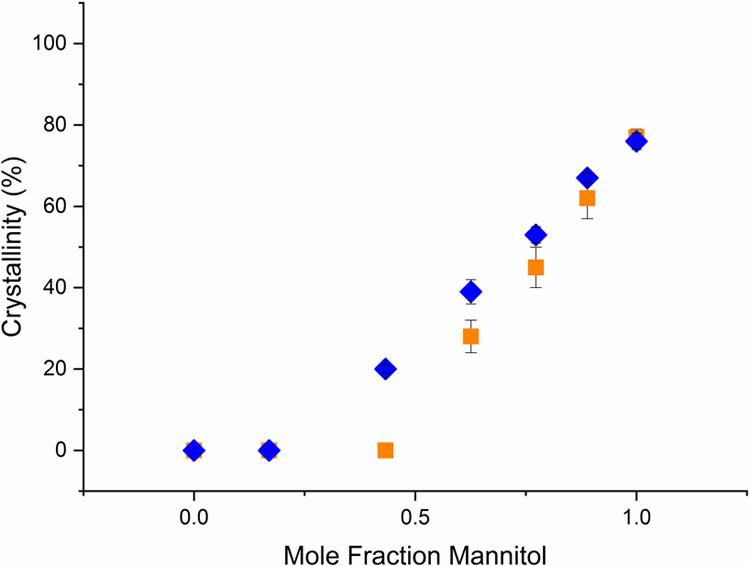
The percent crystallinity of lyophiles (determined by powder X-ray diffractometry) as a function of mannitol concentration. The lyophiles were prepared from solutions of mannitol and trehalose with different compositions. Samples were lyophilized using the standard lyophilization protocol (orange squares) or with an additional annealing step at −5 °C prior to primary drying (blue diamonds). Mean ± SD (n=3). For some points error bars are not visible because they are smaller than the symbol size.
Nanobubble Formation Following Dissolution of Dehydrated Trehalose Dihydrate
During the freezing and primary drying stages of lyophilization, trehalose has been reported to form crystalline trehalose dihydrate.21, 22 During secondary drying, these crystals may dehydrate and revert to an amorphous anhydrate.21 The baseline thermal behavior of trehalose dihydrate, evaluated by heating in a hermetically sealed pan in a DSC, was in excellent agreement with literature.23 A sharp endotherm was observed at ~ 99 °C, immediately followed by an exotherm (data not shown). The endotherm is attributable to dehydration of trehalose dihydrate yielding a partially crystalline anhydrate. Since a sealed pan was used, there will be resistance to vaporization of the released water. The exotherm is ascribed to further crystallization of the anhydrate.
We observed that the crystalline trehalose dihydrate became amorphous when dried for 12 hours at 33 °C and a chamber pressure of 70 mTorr. DSC of the dried material revealed a glass transition at ~ 118 °C (Figure 3), in agreement earlier literature.24 The ∆Cp at Tg, 0.5 J·g−1·°C−1, was also in excellent agreement with the reported value. The Tg was followed, first by a crystallization exotherm, and then by an endotherm attributed to melting of the crystalline phase. The enthalpy of crystallization (53.9 J·g−1) and the enthalpy of fusion (58.0 J·g−1) values were similar, suggesting that, under these dehydration conditions, a substantially amorphous trehalose phase was obtained.
Figure 3.
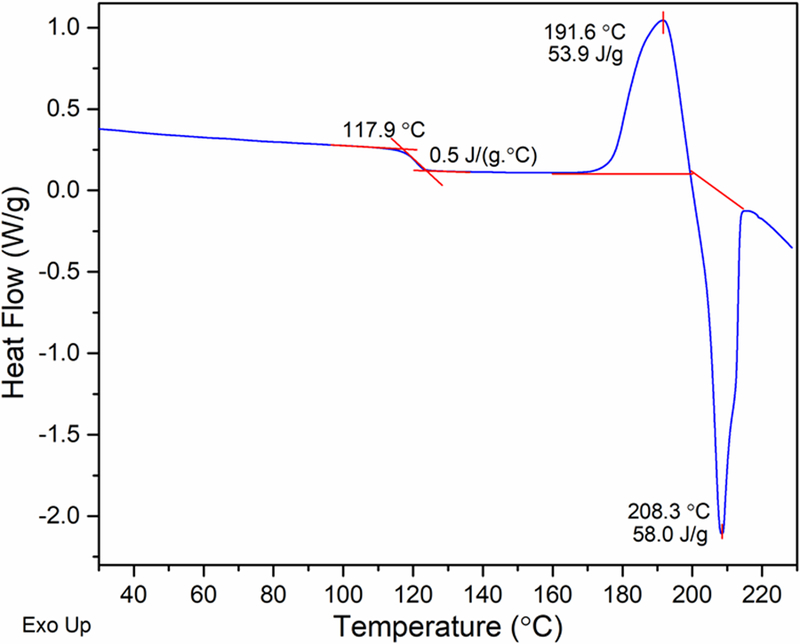
DSC heating curve of amorphous trehalose* in a non-hermetically crimped pan. *Amorphous trehalose was prepared by drying crystalline trehalose dihydrate for 12 hours at 33 ˚C at a chamber pressure of 70 mTorr. After loading in the DSC cell, additional drying was conducted by holding at 60 °C for 5 hours and heating to 150 °C and then cooling to 20 °C.24 Finally, the sample was heated from room temp erature to 240 °C at 10 °C/min, and the heating curve (shown h ere) was recorded.
Amorphous trehalose, formed by drying crystalline trehalose dihydrate at 33 °C and 70 mTorr for 12 hours, was dissolved in ultrapure water and subsequently characterized using NTA. A similar analysis was conducted using trehalose dihydrate crystals that were not subjected to drying. As can be observed in Figure 4, nanoparticle concentrations after reconstitution of the amorphous trehalose were approximately two orders of magnitude higher, 1.4 × 10¹⁰ vs. 2.8 × 10⁸ mL−1, than those observed in samples formed by dissolving trehalose dihydrate crystals. The nanoparticles formed after reconstituting the amorphous trehalose were monodisperse, with a mean diameter of 73 nm. To confirm the identity of these particles as nanobubbles, ultracentrifugation was employed. Samples of the dehydrated, amorphous trehalose were dissolved in ultrapure water and centrifuged for 75 minutes at 208,000 rcf. Following ultracentrifugation, the bottom and top fraction of the samples were carefully removed using a syringe and needle and particle concentrations were re-measured using NTA. Enrichment of nanoparticle concentrations in the top fraction (data not shown) showed that the nanoparticles were positively buoyant, consistent with their being nanobubbles.
Figure 4.

Size distribution of nanoparticles generated upon dissolution of either crystalline trehalose (A) or amorphous trehalose (B). Dissolution of trehalose dihydrate generated (2.82 ± 0.22) x 108 nanoparticle per mL while dissolution of amorphous trehalose dihydrate formed (1.36 ± 0.14) x 1010 nanoparticles per mL.
Effect of IL-1ra on Nanobubble Generation
The presence of proteins within lyophilized formulation may alter phase behavior of excipients.25, 26 To investigate how protein and buffer might alter nanobubble formation, we lyophilized 10% w/v formulations of trehalose that contained 10 mM sodium citrate buffer and IL-1ra at concentrations between 0.1 and 10 mg/mL. After lyophilization, samples were reconstituted with ultrapure water and nanobubble concentrations were measured with NTA. Addition of IL-1ra resulted in significant reduction in nanobubble concentration, as illustrated in Figure 5A. The addition of just 0.1 mg/mL IL-1ra in the lyophilized samples resulted in a decrease in nanobubble concentration from 6.5 × 10⁹ particles/mL in samples without protein to 6.2 × 10⁸ particles/mL in samples with added protein. Further increases in IL-1ra concentrations up to 10 mg/mL did not induce any significant additional changes in the number of nanobubbles generated.
Figure 5.

A. Number of nanobubbles generated (per mL) following reconstitution of formulations with different concentrations of IL-1ra. B. Number of positively buoyant (black bars) and negatively buoyant particles (cross hatched bars) formed (per mL) following reconstitution of lyophilized formulation with different concentrations of IL-1ra. Mean ± SD (n=3).
Nanoparticles formed following reconstitution of lyophilized IL1-ra formulations could plausibly have been composed of either gas bubbles or protein. To differentiate between these two possible particle types, resonant mass measurement (RMM) analysis of the reconstituted samples was conducted. The samples showed significant increases in the concentrations of negatively buoyant (denser than the bulk liquid) particles, which can be attributed to the presence of insoluble protein aggregates as shown in Figure 5B. Similar to the results obtained from nanoparticle tracking analysis, all reconstituted formulations containing IL-1ra exhibited a decrease in the number of positively buoyant particles compared to equivalent protein-free samples.
The effects of IL-1ra on particle concentrations in reconstituted formulations that contained either mannitol alone or mannitol-trehalose mixtures (0.43 mole fraction mannitol) were also studied. As described earlier, nanoparticle concentrations in reconstituted mannitol/trehalose solutions were much lower than in comparable samples of mannitol or trehalose alone. Addition of 1 mg/mL IL-1ra further reduced the number of nanobubbles detected, from 1.0 × 10⁹ nanobubbles/mL to 3.6 × 10⁸ nanobubbles/mL, as shown in Figure 6A. In contrast, samples containing 1 mg/mL IL-1ra lyophilized from solutions containing mannitol alone showed higher nanoparticle concentrations than comparable samples without IL-1ra (1.0 × 10¹¹ particles/mL and 6.1 × 10¹⁰ particles/mL, respectively). This increase in nanoparticle content in pure mannitol formulations was due to the formation of negatively buoyant particles, as shown in Figure 6B. Characterization of the pure mannitol formulations as well as the mannitol/trehalose mixture with RMM showed that both negatively and positively buoyant particles were generated in all reconstituted formulations. However, the concentration of both negatively and positively buoyant particles was significantly lower in mannitol/trehalose formulations compared to those containing pure mannitol or trehalose.
Figure 6.

A. Nanobubble concentration in formulations with (white bars) and without (dark gray bars) IL-1ra (1 mg/mL). B. Concentration of positively (black bars) and negatively (cross hatched bars) buoyant particles generated after reconstitution of formulations containing IL-1ra. Formulations containing mannitol and/or trehalose without and with IL-1ra (1 mg/mL) were freeze dried using our standard lyophilization procedure. Samples were subsequently reconstituted with water and particle formation was characterized using NTA and RMM. Mean ± SD (n=3).
The final component of this study investigated the stability of IL-1ra following reconstitution of lyophilized formulations. Il-1ra was lyophilized using our standard lyophilization protocol in a formulation containing either pure mannitol or trehalose as well as in a 0.43 mole fraction mannitol/trehalose mixture. Following reconstitution of these formulations and incubation for 10 days, formation of micron-sized particles was measured using flow imaging microscopy while IL-1ra monomer loss was monitored with SE-HPLC. Particle concentrations measured with flow imaging microscopy following 10 days of incubation showed that all lyophilized and reconstituted formulations contained more particles than control samples which had not been lyophilized (Figure 7A). After reconstitution, formulations lyophilized with mannitol as the only excipient contained the highest number of particles, with 110,000 ± 75,000 particles/mL. Lyophilizing with trehalose as the excipient reduced the total number of particles generated to 5,000 ± 1481 particles/mL, but the fewest particles were observed in the lyophilized mannitol/trehalose mixture with 2,400 ± 100 particles/mL. Size exclusion chromatography showed that the formulation with mannitol induced the most pronounced destabilization of IL-1ra, with 10% monomer loss observed immediately following reconstitution (Figure 7B). Monomer loss in mannitol formulations appeared to be reversible and dropped to 5% after 10 days. The other two lyophilized formulations did not show a significant difference in monomer content over the 10-day period.
Figure 7.

The effect of lyophilization (formulations containing mannitol and/or trehalose) on the stability of reconstituted IL-1ra was monitored with flow imaging microscopy and SE-HPLC. A.) The concentrations of particles greater than 2 µm in size were measured a fter incubating samples for 10 days at 40 °C using flow imaging microscopy. Particle formation after incubation was compared between lyophilized formulations reconstituted at the beginning of the incubation period (light gray bars) to the same aqueous formulations containing IL-1ra which were not lyophilized (horizontal lined bars). B.) Loss of soluble IL-1ra monomer in reconstituted lyophilized formulations was measured using size exclusion chromatography. Monomer loss was measured either immediately after reconstitution (black) or after incubation for 10 days at 40 ˚C (vertical lined bars). Mean ± SD (n=3).
Discussion
During the early stages of the freezing process, crystals nucleate and grow rapidly. But ice crystals that nucleate within viscous, freeze-concentrated excipient phases may have little opportunity to grow, leaving nanocrystals of ice entrapped within the glassy freeze-concentrate. Sublimation of these ice nanocrystals during primary and secondary drying leaves behind nano-sized voids; we propose that these voids are converted to nanobubbles during reconstitution.
We had initially expected that crystallization of mannitol during lyophilization would greatly reduce the numbers of nanobubbles observed after reconstitution, but in fact, the opposite was observed, with nanobubble concentrations increasing as a function of mannitol crystallinity. As shown in Figures 1 and 2, nanobubble concentrations measured following reconstitution correlated with crystalline content of mannitol/trehalose formulations at mannitol mole fractions greater than 0.5. We explain this somewhat surprising result by suggesting that crystallization of mannitol encourages the nucleation of additional ice nanocrystals. At higher mole fractions, mannitol begins to crystallize and is known to exist in four physical forms. Three of these are anhydrous, and the fourth is a hemihydrate.27, 28 When mannitol crystallizes to form anhydrous polymorphs, water that previously had been associated with amorphous mannitol is excluded from the growing crystals, resulting in local regions of higher water content within the freeze concentrated liquid. The combination of high local concentrations of water and local reductions in viscosity due to water’s plasticizing effect promotes additional nucleation of nano-sized ice crystals within these regions.29 In turn, these nanocrystals become nano-voids when the ice sublimes during primary drying, eventually resulting in the formation of nanobubbles during reconstitution. It is important note that the maximum crystallinity achieved in these studies was 77% for pure mannitol formulations. Therefore, in all formulations a significant fraction of the freeze concentrated liquid remained amorphous. We postulate that this amorphous phase is required for nucleation of nano-sized ice crystals and subsequent nano-void formation in lyophilized formulations.
Because of their small radii of curvature, nano-sized ice crystals are highly susceptible to Ostwald ripening phenomena and coarsening.30, 31 The rate of Ostwald ripening is inversely proportional to viscosity, which decreases rapidly as temperature is increased above the glass transition temperature.32–34 Therefore, any time that the frozen concentrate spends at temperatures near or above the glass transition temperature of the freeze-concentrated liquid results in a shift in the ice crystal size distribution towards fewer, larger crystals. Maximally freeze-concentrated mixtures of trehalose and mannitol have glass transition temperatures which are lower than those of the pure components.35 The glass transition temperature of these mixtures decreases as mannitol is added to trehalose. We observed in Figure 1 that for amorphous mixtures with mannitol mole fractions less than 0.5, nanobubble concentrations observed after reconstitution were greatly reduced as the concentration of mannitol was increased, correlating with the decreased glass transition temperatures in these mixtures, which lead to increased Ostwald ripening and therefore loss of nano-sized ice crystals.
Reductions in nanobubble generation attributed to Ostwald ripening suggests that promoting coarsening phenomena by annealing could be an effective strategy for reducing nanobubble generation. Therefore, we studied samples annealed at −5 ˚C, well above the glass transition temperature of maximally freeze-concentrated solutions of both disaccharides. Heating above the glass transition of an amorphous sugar solution results in a pronounced reduction in viscosity, significantly increasing Ostwald ripening rates.32–34 Although higher rates of Ostwald ripening increase the average size of crystals and reduce their total number, the decrease in viscosity might also increase the nucleation rate of new crystals. This suggests that annealing could promote competing processes that both inhibit and promote nanobubble formation upon reconstitution.
Our studies of nanobubble generation from annealed formulations show that the effect of annealing is dependent on the solute composition of the lyophilized formulations. To help explain this dependence we have provided illustrations in Figure 8 depicting our understanding of the effect of annealing on the morphology of the freeze concentrate at three mannitol concentrations. We begin by considering the freeze concentrates of formulations at the lowest mannitol concentrations (Figure 8A). Under these conditions, mannitol and trehalose mutually inhibit each other’s crystallization, resulting in an amorphous continuous phase surrounding ice crystals of various sizes. During annealing of these samples, Ostwald ripening of ice crystals is the primary process that occurs, increasing the size of larger ice crystals and reducing the number of nano-sized ice crystals. Sublimation of the crystals during primary drying converts the nano-sized ice crystals to voids that become nanobubbles following reconstitution, but the decrease in the number of nanocrystals after annealing leads to reduced nanobubble concentrations (Figure 1). As the concentration of mannitol is increased to moderate values, trehalose no longer completely inhibits mannitol crystallization, and annealing begins to induce crystallization of previously amorphous mannitol (Figure 2). As illustrated in Figure 8B, mannitol crystallization releases water molecules into the surrounding glassy matrix, where they may nucleate to form additional nano-sized ice crystals, eventually leading to more nanobubbles during reconstitution.
Figure 8.

Schematic illustration summarizing the effects of mannitol concentration and annealing on the concentration and size distribution of ice crystals within the freeze concentrate. In the above images amorphous domains are represented by the gray regions while ice crystals are shown in white. In addition mannitol crystals are represented by orange rectangles.
As the concentration of mannitol is increased further in lyophilized formulations, large reductions in the total number of nanobubbles formed following reconstitution are observed in annealed samples (Figure 1). PXRD data provided in Figure 2 shows that, at the higher mannitol concentrations, annealing has little effect on the crystallinity of mannitol in these formulations, suggesting that disappearance of ice nanocrystals by Ostwald ripening is the primary process occurring during annealing. However, ripening appears to induce larger reductions in nanobubble formation at higher mannitol concentrations compared to low mannitol concentrations. This increased rate of ripening can be attributed to the higher density of ice crystals present within the amorphous phase in highly crystalline formulations. It is well established that the rate of Ostwald ripening increases with the volume fraction of the dispersed phase.36–39 As shown in Figure 8C at high mannitol crystallinities, nano-sized ice crystals are concentrated within the remaining amorphous phase. Ostwald ripening is a diffusion limited process, therefore shorter distances between ice crystals results in the faster transfer of water molecules between crystals leading to higher dissolution rates of nano-sized crystals and increased growth rates of larger crystals. The culmination of this effect is that annealing of freeze concentrates containing highly crystalline mannitol results in rapid coarsening of nano-sized ice crystals that concentrated within the amorphous domain, thereby reducing nanobubble generation upon reconstitution.
Unexpectedly, lyophilized samples of pure trehalose generated more nanobubbles upon reconstitution if the samples were annealed at −5 °C prior to drying. Although trehalose is commonly found to be amorphous after lyophilization, Sundaramurthi et al. have shown that during freezing, trehalose may crystallize as a dihydrate.21 During secondary drying, crystalline trehalose dihydrate is unstable and dehydrates back to an amorphous phase.21, 22 We speculate that the annealing–dependent increase in nanobubble generation seen in pure trehalose samples can be attributed to the formation of crystalline trehalose dihydrate during the annealing step, and its subsequent dehydration back to an amorphous form during secondary drying. We note that nanobubbles were created when amorphous trehalose formed by dehydrating trehalose dihydrate crystals was reconstituted (Figure 4).
There have been reports of mannitol hemihydrate formation during freezing and annealing and its subsequent dehydration back to an anhydrous polymorph during secondary drying.40, 41 Similar to the results obtained following dehydration of trehalose dihydrate, conversion of hemihydrate to an anhydrous polymorph could potentially create nanometer sized voids. Based on PXRD, there was no evidence of existence of mannitol hemihydrate in the final lyophilized solid. However, because secondary drying can convert hemihydrate to an anhydrous polymorph, it is possible that the hemihydrate was formed during freezing or annealing but it dehydrated during drying. To test this alternate explanation, lyophilization would need to be conducted in the chamber of a variable temperature X-ray powder diffractometer to detect hemihydrate prior to dehydration. However, experiments conducted in such an XRD instrument might not accurately reflect conditions in a laboratory or industrial lyophilizer, where differences in geometry and sample mass could significantly alter cooling rates and ice nucleation temperatures.
After gaining an improved understanding of the mechanism of nanobubble generation in lyophilized formulations, we next evaluated how the presence of a protein (IL-1ra) might impact nanobubble formation. As shown in Figure 5, the addition of even 0.1 mg/mL IL-1ra resulted in a large decrease in the number of nanobubbles detected with either NTA or RMM. After this initial drop at low protein concentration, the nanobubble concentration did not change significantly even as the protein concentration was increased by two orders of magnitude. The addition of protein to lyophilized formulations could impact the glass transition temperature of the amorphous phase or inhibit excipient crystallization. Previous studies conducted by Liao et al. 26 found that high concentrations of protein (at least 20 mg/mL) were required to significantly alter the physical properties of lyophilized formulations. Interestingly, the effect of protein addition to the lyophilized trehalose formulations on nanobubble generation appeared to “saturate” by 0.1 mg/mL, a c oncentration much lower than that reported by Liao et al. 26
When evaluating this result, we must also consider the limitations of the particle sizing and counting methods employed. With a mean diameter of approximately 100 nm, the full distribution of nanobubbles cannot be obtained with either RMM or NTA. Therefore, any change in the nanobubble size distribution would alter the total number of nanobubbles detected. Furthermore, changes in nanobubble properties induced by protein adsorption, such as changes in refractive indices or density, alter the sensitivity of RMM or NTA respectively. Therefore, we cannot conclude whether lyophilization with protein reduces the total number of nanobubble generated upon reconstitution or whether size distributions and/or optical properties of the nanobubbles are altered.
The lack of protein concentration dependence on the nanobubble concentration suggests that the effect of IL-1ra is likely dependent on the nanobubble surface area. Despite billions of nanobubbles per milliliter being generated following reconstitution, the total surface area of nanobubbles in these suspensions is small. If monolayer adsorption is assumed, the nanobubble surface could be saturated at IL-1ra concentrations well below 0.1 mg/mL. Once the nanobubble surface becomes completely saturated, further addition of protein would be expected to have a minimal effect on the surface properties of nanobubbles. Furthermore, following reconstitution of lyophilized IL-1ra formulations, large numbers of negatively buoyant particles attributed to protein aggregates are generated. The concentration of IL-1ra aggregates formed was independent of protein concentration. We suggest that following reconstitution, IL-1ra may adsorb to the surface of nanobubbles, where perturbation in protein structure and aggregation may occur. This adsorption may destabilize the nanobubbles, resulting in nanobubble collapse and release of aggregate particles into the bulk suspension.
The final component of this study investigated a potential strategy for reducing nanobubble-induced protein aggregation and particle formation in reconstituted lyophilized formulations. Addition of small quantities of mannitol to trehalose formulations reduced both the concentrations of nanobubbles and the levels of aggregated protein seen after reconstitution. Lyophilized mannitol-trehalose mixtures containing 0.43 mole fraction mannitol showed smaller numbers of nanobubbles upon reconstitution and also smaller amounts of aggregated protein compared to those seen in either pure mannitol or trehalose formulations. Further, after storing reconstituted suspensions for 10 days, fewer micron-sized particles were detected in the 0.43 mole fraction mannitol formulation. These results clearly showed lyophilized protein formulations can be formulated to reduce nanobubble formation upon reconstitution, thereby reducing aggregation and particle formation.
The amount of aggregated protein, the faction of mannitol that crystallized and the number of nanobubbles that were formed all increased as the overall mannitol mole fraction was increased above 0.43. The protective effects that mannitol exerts on proteins during lyophilization are well-known to be reduced when mannitol crystallizes.42–44 The increases in aggregated protein that we observed following reconstitution of formulations with mannitol mole fractions greater than 0.43 might be attributed to both a loss of protection when mannitol crystallized, and to the increased numbers of nanobubbles generated in these formulations.
Conclusions
Our results suggest that nanobubbles observed after reconstitution of lyophilized formulations depends on the formation of nano-sized ice crystals within the freeze concentrated liquid which leave behind nano-sized voids following primary and secondary drying. Crystallization of excipients such as mannitol release water into the freeze concentrate, promoting additional ice crystallization and therefore increase nanobubble concentrations following reconstitution. Nano-sized ice crystals are susceptible to Oswald ripening phenomena at temperatures near or above the glass transition temperature of the freeze concentrate. Annealing samples above the glass transition temperature promotes coarsening of ice crystals and reduction in nanobubble generation. However, depending on the formulation composition, annealing may promote excipient crystallization facilitating the formation of additional nano-sized ice crystals. In addition, if the formulation is designed to reduce nanobubble generation, there is also reduced protein aggregation, both upon reconstitution of the lyophilized protein formulations and after longer incubation periods. The results included in this work suggest a potential strategy for minimizing nanobubble formation upon reconstitution of lyophilized protein formulations and thereby reducing nanobubble-induced protein aggregation and particle formation.
Acknowledgements
The authors gratefully acknowledge support from the National Institute of Health, grant REB026006A (TR). The work was partially supported by the William and Mildred Peters Endowment fund (RS).
Footnotes
Publisher's Disclaimer: This is a PDF file of an unedited manuscript that has been accepted for publication. As a service to our customers we are providing this early version of the manuscript. The manuscript will undergo copyediting, typesetting, and review of the resulting proof before it is published in its final citable form. Please note that during the production process errors may be discovered which could affect the content, and all legal disclaimers that apply to the journal pertain.
References
- 1.Carpenter J, Cherney B, Lubinecki A, Ma S, Marszal E, Mire-Sluis A, Nikolai T, Novak J, Ragheb J, Simak J. 2010. Meeting report on protein particles and immunogenicity of therapeutic proteins: Filling in the gaps in risk evaluation and mitigation. Biologicals 38:602–611. [DOI] [PubMed] [Google Scholar]
- 2.Carpenter JF, Randolph TW, Jiskoot W, Crommelin DJA, Middaugh CR, Winter G, Fan Y-X, Kirshner S, Verthelyi D, Kozlowski S, Clouse KA, Swann PG, Rosenberg A, Cherney B. 2009. Overlooking subvisible particles in therapeutic protein products: gaps that may compromise product quality. J. Pharm. Sci 98:1201–1205. [DOI] [PMC free article] [PubMed] [Google Scholar]
- 3.Zhou C, Cleland D, Snell J, Qi W, Randolph TW, Carpenter JF. 2016. Formation of stable nanobubbles on reconstituting lyophilized formulations containing trehalose. J. Pharm. Sci 105:2249–2253. [DOI] [PubMed] [Google Scholar]
- 4.Snell JR, Zhou C, Carpenter JF, Randolph TW. 2016. Particle formation and aggregation of a therapeutic protein in nanobubble suspensions. J. Pharm. Sci 105:3057–3063. [DOI] [PMC free article] [PubMed] [Google Scholar]
- 5.Carpenter JF, Pikal MJ, Chang BS, Randolph TW. Rational design of stable lyophilized protein formulations: some practical advice. Pharm. Res 14:969–975. [DOI] [PubMed] [Google Scholar]
- 6.Wang W 2000. Lyophilization and development of solid protein pharmaceuticals. Int. J. Pharm 203:1–60. [DOI] [PubMed] [Google Scholar]
- 7.Izutsu K 2014. Stabilization of therapeutic proteins in aqueous solutions and freeze-dried solids: an overview,pp, 435–441, Humana Press, Totowa, NJ. [DOI] [PubMed] [Google Scholar]
- 8.Arakawa T, Prestrelski SJ, Kenney WC, Carpenter JF. 1993. Factors affecting short-term and long-term stabilities of proteins. Adv. Drug Deliv. Rev 10:1–28. [DOI] [PubMed] [Google Scholar]
- 9.Raut AS, Kalonia DS. 2016. Pharmaceutical perspective on opalescence and liquid-liquid phase separation in protein solutions. Mol. Pharm 13:1431–1444. [DOI] [PubMed] [Google Scholar]
- 10.Roberts CJ. 2014. Protein aggregation and its impact on product quality. Curr. Opin. Biotechnol 30:211–217. [DOI] [PMC free article] [PubMed] [Google Scholar]
- 11.Chi EY, Krishnan S, Randolph TW, Carpenter JF. 2003. Physical stability of proteins in aqueous solution: mechanism and driving forces in nonnative protein aggregation. Pharm. Res 20:1325–1336. [DOI] [PubMed] [Google Scholar]
- 12.Tang X, Pikal MJ. 2004. Design of freeze-drying processes for pharmaceuticals: practical advice. Pharm. Res 21:191–200. [DOI] [PubMed] [Google Scholar]
- 13.Carpenter JF, Izutsu K, Randolph TW. 2016. Freezing- and drying-induced perturbations of protein structure and mechanism of protein protection by stabilizing additives.In,Freeze-drying/lyophilization of pharmaceutical and biological products, ,pp, 167–197, CRC Press. [Google Scholar]
- 14.Dong A, Prestrelski SJ, Allison SD, Carpenter JF. 1995. Infrared spectroscopic studies of lyophilization- and temperature-induced protein aggregation. J. Pharm. Sci 84:415–424. [DOI] [PubMed] [Google Scholar]
- 15.Prestrelski SJ, Arakawa T, Carpenter JF. 1993. Separation of freezing- and drying-induced denaturation of lyophilized proteins using stress-specific stabilization: II. structural studies using infrared spectroscopy. Arch. Biochem. Biophys 303:465–473. [DOI] [PubMed] [Google Scholar]
- 16.Andya JD, Hsu CC, Shire SJ. 2003. Mechanisms of aggregate formation and carbohydrate excipient stabilization of lyophilized humanized monoclonal antibody formulations. AAPS PharmSci 5:21–31. [DOI] [PMC free article] [PubMed] [Google Scholar]
- 17.Carpenter JF, Prestrelski SJ, Arakawa T. 1993. Separation of freezing- and drying-induced denaturation of lyophilized proteins using stress-specific stabilization: I. enzyme activity and calorimetric studies. Arch. Biochem. Biophys 303:456–464. [DOI] [PubMed] [Google Scholar]
- 18.Webb SD, Cleland JL, Carpenter JF, Randolph TW. 2003. Effects of annealing lyophilized and spray-lyophilized formulations of recombinant human interferon-gamma. J. Pharm. Sci 92:715–729. [DOI] [PubMed] [Google Scholar]
- 19.Powder Diffraction File, International Centre for Diffraction Data, Newtown Square, PA, 2004 [Google Scholar]
- 20.Nunes C, Suryanarayanan R, Botez CE, Stephens PW. 2004. Characterization and crystal structure of D‐mannitol hemihydrate. J. Pharm. Sci 93:2800–2809. [DOI] [PubMed] [Google Scholar]
- 21.Sundaramurthi P, Suryanarayanan R. 2010. Trehalose crystallization during freeze-drying: implications On lyoprotection. J. Phys. Chem. Lett 1:510–514. [Google Scholar]
- 22.Ding S-P, Fan J, Green JL, Lu Q, Sanchez E, Angell CA. 1996. Vitrification of trehalose by water loss from its crystalline dihydrate. J. Therm. Anal 47:1391–1405. [Google Scholar]
- 23.Taylor LS, York P. 1998. Characterization of the phase transitions of trehalose dihydrate on heating and subsequent dehydration. J. Pharm. Sci 87:347–355. [DOI] [PubMed] [Google Scholar]
- 24.Surana R, Pyne A, Suryanarayanan R. 2004. Effect of preparation method on physical properties of amorphous trehalose. Pharm. Res 21:1167–1176. [DOI] [PubMed] [Google Scholar]
- 25.Jena S, Horn J, Suryanarayanan R, Friess W, Aksan A. 2017. Effects of excipient interactions on the state of the freeze-concentrate and protein stability. Pharm. Res 34:462–478. [DOI] [PubMed] [Google Scholar]
- 26.Liao X, Krishnamurthy R, Suryanarayanan R. 2005. Influence of the active pharmaceutical ingredient concentration on the physical state of mannitol—implications in freeze-drying. Pharm. Res 22:1978–1985. [DOI] [PubMed] [Google Scholar]
- 27.Yu L, Milton N, Groleau EG, Mishra DS, Vansickle RE. 1999. Existence of a mannitol hydrate during freeze‐drying and practical implications. J. Pharm. Sci 88:196–198. [DOI] [PubMed] [Google Scholar]
- 28.Campbell Roberts SN, Williams AC, Grimsey IM, Booth SW. 2002. Quantitative analysis of mannitol polymorphs. X-ray powder diffractometry—exploring preferred orientation effects. J. Pharm. Biomed. Anal 28:1149–1159. [DOI] [PubMed] [Google Scholar]
- 29.Roos Y, Karel M. 1991. Phase transitions of mixtures of amorphous polysaccharides and sugars. Biotechnol. Prog 7:49–53. [Google Scholar]
- 30.Houk LR, Challa SR, Grayson B, Fanson P, Datye AK. 2009. The definition of “Critical Radius” for a collection of nanoparticles undergoing Ostwald ripening. Langmuir 25:11225–11227. [DOI] [PubMed] [Google Scholar]
- 31.Voorhees PW. 1985. The theory of Ostwald ripening. J. Stat. Phys 38:231–252. [Google Scholar]
- 32.Duddu SP, Dal Monte PR. 1997. Effect of glass transition temperature on the stability of lyophilized formulations containing a chimeric therapeutic monoclonal antibody. Pharm. Res 14:591–595. [DOI] [PubMed] [Google Scholar]
- 33.Searles JA, Carpenter JF, Randolph TW. 2001. Annealing to optimize the primary drying rate, reduce freezing‐induced drying rate heterogeneity, and determine Tg’ in pharmaceutical lyophilization. J. Pharm. Sci 90:872–887. [DOI] [PubMed] [Google Scholar]
- 34.Ablett S, Clarke CJ, Izzard MJ, Martin DR. 2002. Relationship between ice recrystallisation rates and the glass transition in frozen sugar solutions. J. Sci. Food Agric 82:1855–1859. [Google Scholar]
- 35.Jena S, Suryanarayanan R, Aksan A. 2016. Mutual influence of mannitol and trehalose on crystallization behavior in frozen solutions. Pharm. Res 33:1413–1425. [DOI] [PubMed] [Google Scholar]
- 36.Brailsford A, Wynblatt P 1979. The dependence of Ostwald ripening kinetics on particle volume fraction. Acta Metall 27:489–497. [Google Scholar]
- 37.Voorhees PW, Glicksman ME. 1984. Ostwald ripening during liquid phase sintering—Effect of volume fraction on coarsening kinetics. Metall. Mater. Trans. A 15:1081–1088. [Google Scholar]
- 38.Marqusee JA, Ross J. 1984. Theory of Ostwald ripening: Competitive growth and its dependence on volume fraction. J. Chem. Phys 80:536–543. [Google Scholar]
- 39.Yao JH, Elder KR, Guo H, Grant M. 1993. Theory and simulation of Ostwald ripening. Phys. Rev. B 47:14110–14125. [DOI] [PubMed] [Google Scholar]
- 40.Cao W, Xie Y, Krishnan S, Lin H, Ricci M. 2013. Influence of process conditions on the crystallization and transition of metastable mannitol forms in protein formulations during lyophilization. Pharm. Res 30:131–139. [DOI] [PubMed] [Google Scholar]
- 41.Mehta M, Bhardwaj SP, Suryanarayanan R. 2013. Controlling the physical form of mannitol in freeze-dried systems. Eur. J. Pharm. Biopharm 85:207–213. [DOI] [PubMed] [Google Scholar]
- 42.Izutsu K, Yoshioka S, Terao T. 1994. Effect of mannitol crystallinity on the stabilization of enzymes during freeze-drying. Chem. Pharm. Bull 42:5–8. [DOI] [PubMed] [Google Scholar]
- 43.Han Y, Jin B-S, Lee S-B, Sohn Y, Joung J-W, Lee J-H. 2007. Effects of sugar additives on protein stability of recombinant human serum albumin during lyophilization and storage. Arch. Pharm. Res 30:1124–1131. [DOI] [PubMed] [Google Scholar]
- 44.Souillac PO, Middaugh CR, Rytting JH. 2002. Investigation of protein/carbohydrate interactions in the dried state. 2. Diffuse reflectance FTIR studies. Int. J. Pharm 235:207–218. [DOI] [PubMed] [Google Scholar]