Abstract
The accuracy of sequence-based tertiary contact predictions was assessed in a blind prediction experiment at the CASP13 meeting. After four years of significant improvements in prediction accuracy, another dramatic advance has taken place since CASP12 was held two years ago. The precision of predicting the top L/5 contacts in the free modeling category, where L is the corresponding length of the protein in residues, has exceeded 70%. As a comparison, the best-performing group at CASP12 with a 47% precision would have finished below the top 1/3 of the CASP13 groups. Extensively trained deep neural network approaches dominate the top performing algorithms, which appear to efficiently integrate information on co-evolving residues and interacting fragments or possibly utilize memories of sequence similarities and sometimes can deliver accurate results even in the absence of virtually any target specific evolutionary information. If the current performance is evaluated by F-score on L contacts, it stands around 24% right now, which, despite the tremendous impact and advance in improving its utility for structure modeling, also suggests that there is much room left for further improvement.
Keywords: CASP13, contact prediction, protein structure modeling
Introduction
The Critical Assessment of Structure Prediction (CASP) meetings started in 1994 and have continued biannually ever since, with the latest meeting, CASP13, held in 20181. In advance of the meeting, the participating groups make blind predictions for a number of protein structures, complexes, or contacts, and these predictions are assessed on recently-solved experimental structures that are kept confidential during the competition. As early as the second CASP meeting in 19962,3, contact predictions were made and assessed4–13. In general, protein structures are very well packed14, with densities comparable to molecular crystals, in which all the hydrogen bond donor and acceptor groups are satisfied15. Soon after the first three-dimensional protein structures were solved, initial observations about compensatory mutations that preserve the tight packing and extensive network of interactions were published, for instance in the case of the well-studied ribonuclease, as early as 196816. Over time, more and more protein sequences became available17, which in the 1990s prompted attempts to use sequence information to predict compensatory mutations that could serve as restraints for tertiary structure modeling18,19. At the time, the low accuracy of contact predictions had limited success in assisting protein structure modeling at CASP11,20,21 but was successfully employed in specific applications, such as folding small proteins22, improving statistical pair potentials23, selecting models in fold recognition studies24, predicting the disulfide bond connectivity in Cys-rich proteins from sequences25,26 or identifying residues that participate in long range interactions in general27,28. Arguably, the two bottlenecks for contact prediction methods were the lack of informative sequence profiles (the limited size of sequence databases) and the insufficiently sensitive algorithms to establish these correlations. The use of mutual-information-based techniques improved the accuracy of these approaches29–32, but did not address the problem of effectively separating the noise that is attributed to higher-order transitive correlations from indirectly interacting residues29–34. A significant advance took place when various approaches focused on addressing the transitivity problem in residue contact signals, such as the direct coupling analysis35–39, sparse inverse covariance methods38,40 and network decomposition approaches41,42. The algorithmic advances, together with the simultaneous explosion of sequence database sizes, set the stage for a renaissance in contact prediction. After a long hiatus, in 2014 at the CASP11 meeting the first reports and signs of advance appeared in the accuracy of contact prediction5, these were followed by a nearly doubling in the precision of prediction accuracy at CASP124 in 2016. After 2010, when first papers on correlated mutations were published, a number of refinements took place, such as combining a set of non-overlapping contact predictions in a consensus approach and especially the application of various supervised deep neural network based approaches43, further improving the accuracy of contact prediction techniques44–53.
In this work, we assess performance of the state-of-the-art of contact prediction methods in 2018 at CASP13. We explore three general questions concerning contact predictions. First, which are the most advanced methods currently available? Second, how much progress took place compared to previous CASP meetings? Third, what are the promising directions and major bottlenecks for future development?
Materials and Methods
Targets and participating groups
In CASP13, 32 targets were assessed in the contact prediction category, and 46 groups submitted predictions. One target had only medium range contacts, therefore when discussing long-range contacts only we analyzed 31 targets. In general, there was robust participation: 37 out of the 46 groups submitted 31 or 32 predictions, and, except for one group, every group submitted at least 24. We provide detailed information about the groups and level of their participation in Table S1 of Supplementary material.
All targets analyzed here belong to the free modeling (FM) category, where the assumption is that no suitable template exist in structure databases. The size of the targets ranged between 76 and 431 residues. Given the composition of secondary structures, the classes of protein targets were close to equally balanced between all-alpha, all-beta and alpha/beta classes.
Definition of contacts
A pair of residues is defined to be in contact when the distance between their Cβ atoms (Cα in case of glycine) is smaller than 8.0 Å. Contacts were also grouped according to their sequence separation into short, medium, long, and extra-long categories, defined as pairs of residues separated by 6–11, 12–23, 24+, and 50+ residues, respectively.
Submission of contact predictions assigned a probability score P [0;1] to each contact reflecting confidence in the prediction.
Evaluation measures
Prediction performance was measured with F-score and precision considering various subsets of contacts: the top 10, top L/5, top L/2, top L (where L is the length of the protein sequence) and all contacts submitted. The F-score is defined as the harmonic mean of precision and recall:
, where precision and recall are calculated as: precision = TP/(TP + FP); recall = TP/(TP + FN)) from the observed true positive (TP), false positive (FP) and false negative cases (FN). To assess accuracy of contact prediction for ranking of groups, we transformed per-target raw accuracy scores into z-scores. After the original z-scores were calculated, outliers that scored two standard deviations or more below the average (i.e. z-score < −2) were excluded, and the standard scores were re-calculated based on the mean and standard deviation of the outlier-free model set. All models that scored below the average were assigned z-scores of 0. If a group did not submit predictions on a target, its per-target z-score was also set to zero. The cumulative rank of a group is assigned based on the sum of its per-target z-scores.
Jaccard plots
The Jaccard distance was used to analyze the similarity of predicted contacts between pairs of groups. The Jaccard distance (dj) between two sets of contacts, A and B is calculated as:
The Jaccard distance ranges from 0 (identical sets) to 1 (sets with nothing in common).
Entropy calculations
Entropy calculations were performed as described before to estimate the dispersion of predicted contacts4,48,54. Entropy Score (ES) is calculated as a relative drop of the entropy due to geometric constraints imposed by the correctly predicted contacts on the protein shape with respect to the entropy of an extended state without any constraints:
Where E(C) and E(0) stand for entropy of the protein with and without constraints, respectively. The entropies, E(C) or E(0) are obtained as the average value of Shannon’s information entropy calculated for residue-residue distances under the assumption of a uniform probability distribution:
Where N is the number of residues in the protein, Lij and Uij are the lower and upper bound distances between residues i and j, respectively. Lij was 3.2 Å for all pairs while the value of Uij was 8.0 Å for contacts or for non-contacts it is the diameter of gyration, DG55,
Results
Ranking of group performances
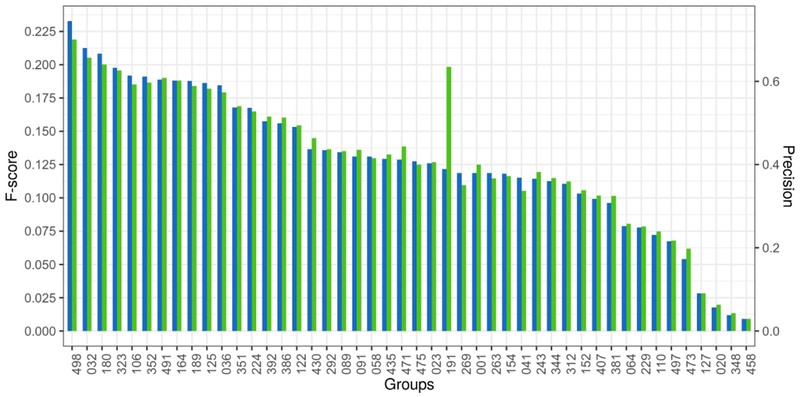
Performance at CASP is evaluated by either summing up scores from a selected measure of accuracy or averaging them over submitted targets. Since 24 out of 46 groups submitted less than the maximum 32 predictions, summing up scores would penalize most groups, therefore we focused on measures of averages. An important aspect of our evaluation is to put in context the results of current CASP13 with those of previous CASPs. Previous meetings concentrated on evaluating the top L/5 long-range contacts (where L is the sequence length), and for consistency we followed this tradition. As soon as one defines a fixed list of contacts to evaluate, it will limit the ability of any measure to fully account for specifics, such as the variable difficulty of each case presented by the size of protein, or its topology. For instance, all else being equal (e.g. the information content of input sequence homologs) a larger protein is expected to have a larger number of long contacts per residue and as such presents an easier task to identify a shortlist of top N contacts. Similarly, different topologies will influence how many contacts a given target has. To illustrate these points, we plotted the number of contacts per residue versus the target length for CASP13 targets (Fig. S1). Medium range contacts are prevalent among sequentially neighboring structural elements and average number of such contacts is relatively constant over different protein lengths, however depending on protein topology even among similar-sized proteins there is a strong variability between 0.15 to 1.5 contacts per residue. In case of long-range contacts, besides the topology dependent variability, a clear trend appears as the average number of contacts per residue increases with protein size, as expected, presenting a range of contacts per residue between 0.4 and 3.3 (Fig S1). As such, different targets represent different levels of difficulty and when only a subset of targets is submitted the variability of the average will increase. We show two measures in Fig. 1., averages of Precision and F-score over submitted predictions (Fig. 1.). This is in order to illustrate that alternative measures return virtually the same ranking, especially among the top ranked groups (identical order), and to provide an opportunity for the reader to focus on his or her preferred measure. Precision is an easy to understand measure but its drawback is that on a small list of L/5 contacts it can be unusually optimistic: for almost 1/3 of targets (10 out of 31) a perfect precision of 1.00 is achieved, and usually by a large number of groups. A second drawback of precision is that it does not reflect the difficulty of prediction in terms of variable number of contacts per residue among targets. Between two targets, the one with a smaller number of contacts per residue presents a more difficult prediction challenge as a successful selection of L/5 contacts is to be made from a smaller set of contacts. F-score has a drawback that it has a narrower (compared to the precision) scale on a short list of L/5 contacts, with the highest F-score of 0.54 in CASP13. The advantage of F-score is that it considers the total number of native contacts in its recall calculation and therefore there will be higher F-scores obtained for more difficult targets. For instance, the 1/3 of targets that show uniformly a perfect precision of 1.0 for L/5 contacts have variable F-scores, reflecting to some extent the difficulty of these targets, for instance, that larger (easier) targets, with more contacts per residues have smaller F-scores, as it is easier to predict the top L/5 contacts right. Group 191, which submitted only one prediction, had a significant discrepancy between its rankings by F-score and precision (Fig. 1). This is because the group happened to predict an easier target, a large protein with high number of contacts; the group achieved high precision in the top L/5 set of contacts, while the F-score reflects that the recall of the prediction is very low.
Figure 1.
Ranking of group performance on contact prediction at CASP13 considering the top L/5 long-range contacts. The x-axis lists the groups participating at CASP13, the left y-axis and blue bars show average F-scores over submitted targets (between 1 and 31), while the right y -axis and green bars show the average precision of prediction. Group 191 predicted only one target. Statistics on the number of predicted targets by all groups is provided in Supplementary Table S1.
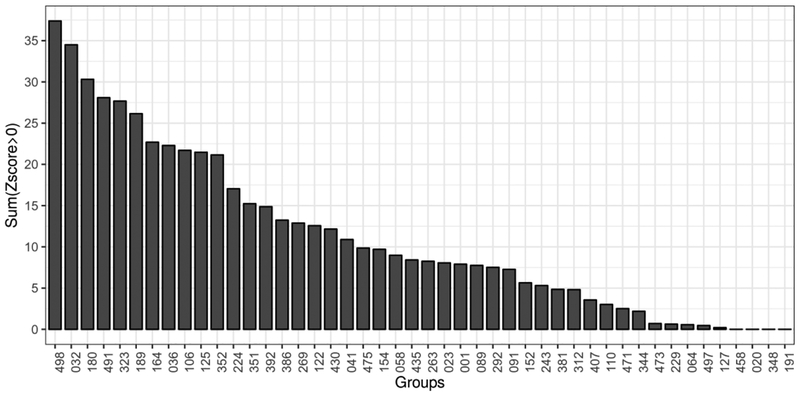
As traditional at most previous CASPs, we also perform ranking of groups according to the sum of their z-scores. Z-score based ranking is relatively convoluted, as we described in the Methods section. The resulting z-scores are either averaged or summed up. In contrast to the previous averages of scores discussion, we show a sum of z-score ranking in Fig. 2. Z-scored based ranking of top groups is similar to the rankings according to the average F-score or precision, thus confirming their robustness.
Figure 2.
Ranking of group performance using sums of z-scores calculated from the per-target distributions of F-scores. Peforrmance is calculated on long range contacts and the set of top L/5 contacts.
When considering three types of contacts independently (short, medium and long range), the long-range contacts are predicted with a lower accuracy over the spectrum of all groups, while medium and short range contacts are predicted with higher, nearly indistinguishable accuracy from one other (Fig. S2.)
We also explored the effect of confidence scores on ranking by calculating the Area Under the Precision-Recall Curves (AUC_PR) considering the entire list of submitted contacts, which ranges between 10 and 63,741. Figure S3 shows that groups that are better in predicting contacts according to precision or F-scores also excel in assigning confidence scores to their contact predictions. Overall, the AUC_PR-based ranking of groups is similar over the spectrum to the previous rankings, and identical among the top 5 groups.
Impact of contact prediction accuracy on the accuracy of structure model
In recent years, the significant advances in the free modeling category have been widely attributed to the improvements in contact prediction. Establishing a direct correlation between the ranking of groups in contact prediction and in structure modeling is difficult because many groups do not submit contact predictions separately; also, some groups submit a variety of alternative contact predictions with different group assignments and it is not trivial to correlate this with the groups that submitted tertiary models. However, considering a small subset of cases when the same group submitted both structure models and contact predictions, one can see both a strong correlation between accuracies and some significant inconsistencies in isolated cases. In these inconsistent cases, either a very good ranking is achieved in structure modeling (e.g. group 089 ranked 3 in FM) despite the rather average performance in contact prediction (group 089 ranked 20th in contact prediction), or the opposite, a highly-ranked contact prediction (e.g. group 164 ranked 7th) corresponds to rather average performance in structure modeling (group 164 ranked 46th in structure modeling). This suggests that it is equally important to accurately capture contacts and to effectively incorporate this information in tertiary structure modeling.
Consistency of contacts predicted by different methods
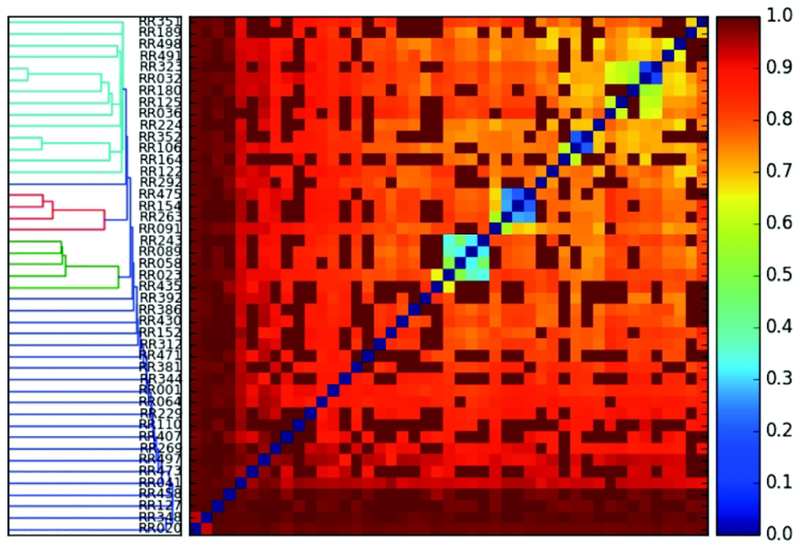
We also explored if different participating methods have tendencies to capture the same set of contacts, in other words, if some more trivial contacts, or “low hanging fruits” are being captured systematically by a variety of approaches. This was investigated by calculating a Jaccard distance of the predicted contacts between all pairs of groups (Fig. 3). Interestingly, different methods captured quite different sets of contacts. The very few similar sets (blue and green colors on the heatmap) turned out to be alternative submissions from the same research group, such as 032 and 323, 106 and 352, and 475 and 154. The Jaccard distance plot shown for illustration considers the top L/5 sets of contacts, but this plot does not change for the top L/2, or top L sets of contacts either. Change only happens when all contacts are considered, but that is due to the dominance of a very large number of false positive predictions among various methods. The Jaccard distance plot analysis suggests that a range of alternative sets of contacts can be captured and used efficiently for accurate structure prediction.
Figure 3.
Jaccard distance plot of contact predictions comparing the top L/5 contacts of participating groups (listed on the left vertical panel). Identical sets of contacts are marked in blue (close to Jaccard distance of 0), while entirely non-overlapping sets are in red (close to Jaccard distance of 1) colors. The left panel displays a similarity histogram of the group predictions.
Improvement in contact prediction over previous CASP meetings
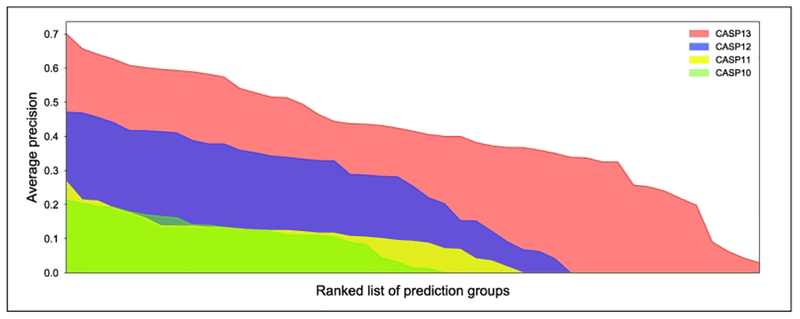
Previous CASP meetings tracked the improvement in contact prediction by the accuracy (precision) of the top L/5 long-range contacts. After many years of stagnating performance that fluctuated around 20%, the first promising sign of improvement came at CASP11 where the performance increased to 26.7% (Fig. 4.). However, the real breakthrough happened between CASP11 and CASP12, where the top-performing groups nearly doubled the accuracy to 47.1%. At CASP13, an unexpectedly strong additional improvement took place and accuracies reached the 70% level. To put the improvements into a practical context, the single best-performing group at CASP12 (with a precision of 47%) would not have reached in the top 37% of groups in CASP13, and the top performer in CASP11 would have placed in the bottom 20% of CASP13 participants. This not only emphasizes the dramatic coming-of-age moment that contact prediction has experienced during the last 2–4 years, but also illustrates that the entire spectrum of performance across all groups has had a broad shift to much higher accuracies, rather than the improvements being due to specific techniques employed by only a few top-performing groups.
Figure 4.
Improvement of contact prediction over CASP10-CASP13 meetings. Average precision of long-range contact prediction accuracies is shown considering the top L/5 contacts. X-axis lists CASP participating groups, ordered by performance, y-axis is the average precision of a given group over all targets. Colors identify the different CASP meetings.
Target difficulty in CASP13
In order to carry out a meaningful comparison of prediction results in different CASPs, we want to rule out the possibility that the change in the prediction accuracy can be attributed to the change in target difficulty. This possibility can be excluded upfront by the fact that we provided evaluation on the FM targets only, where by definition no trivial homologues exist in the databases. A more quantitative comparison demonstrates that difficulty of FM targets in the previous two CASPs is indeed very similar as judged by the coverage and sequence similarity of targets to the single best template. The coverage and sequence identities are 61.5% and 62%, and 12.2% and 10.6% for CASP12 and CASP13, respectively. Another aspect of target difficulty is the availability of sequence homologs. We have compared the distributions of effective sequence depths of targets during the last three CASPs in all possible pair comparisons using Kolmogorov-Smirnov statistical test and none of the comparisons came out as statistically significantly different (Fig. S4.)
Reliance on sequence profiles
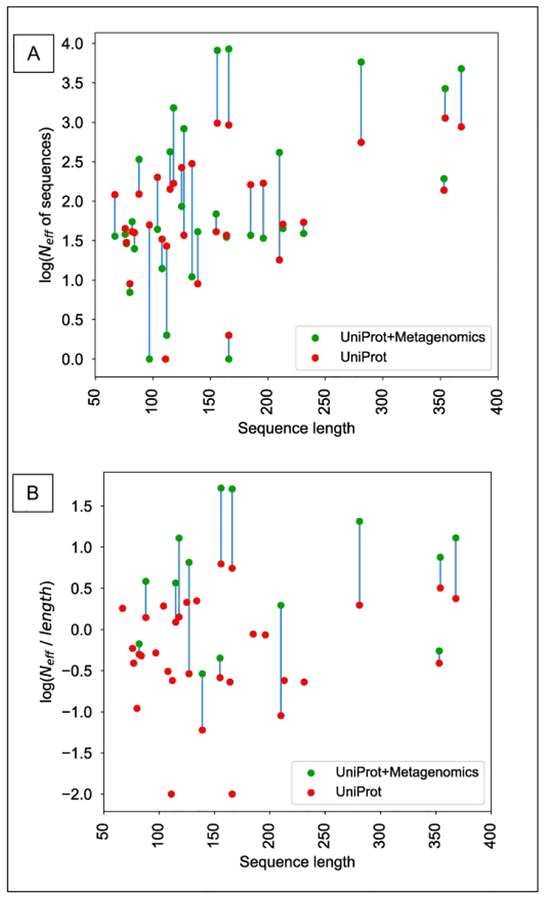
Individual articles in the same special issue of Proteins from the top performers dissect the main drivers of their performances56,57. We have explored a few generic issues that are likely to influence the results. One of them is the extent of sequence profiles that is used to identify correlated positions. We have searched each target sequence using PSI-BLAST58 or HHBlits59. PSI-BLAST was run against UNIREF90 for two iterations at an E-value of <10−3 and requiring a minimum of 60% sequence coverage on the target. HHBlits59 was run against uniclust30 with parameters “-id 90 -cov 60 -n 3 -e 1E-3”. These searches are similar or identical to those applied since CASP11 for the same purpose. Resulting hits were normalized by sequence length and the higher number of hits from the two alternative searches (PSI-Blast and HHblits) was accepted for effective sequence depth (Neff of sequences) calculation (Fig. 5). A surprisingly large number of targets have very few hits, for instance, 6 targets have single-digit sequence hits, 3 of these have zero or one. When the effective numbers of sequences are normalized by the length of the targets (Fig. 4B), 20 out of the 31 targets have less than 1.0 normalized Neff, and 9 have less than 0.25. We also explored the impact of expanding the search with the large metagenomics databases. Once those are also searched the number of sequence hits increases in most cases, but these have little impact on the profiles as it usually increases already rich sequence profiles, while the poorly-covered targets remain unchanged (e.g. T0955-D1, T0989-D2, T0991-D1, T0998-D1, T1008-D1, where green and red dots overlap or nearly overlap.)
Figure 5.
Relationship between the length of target sequence and the number of non-redundant sequence hits (sequence profile depth). Sequence profiles were established by either searching the UniProt database (red) or expanding the search into metagenomics data (green). Panel (A) shows the number of sequence hits as a function of protein length, while panel (B) shows the protein length normalized by the number of sequence hits. Both panels show logarithmic scale to emphasize the low number of hits.
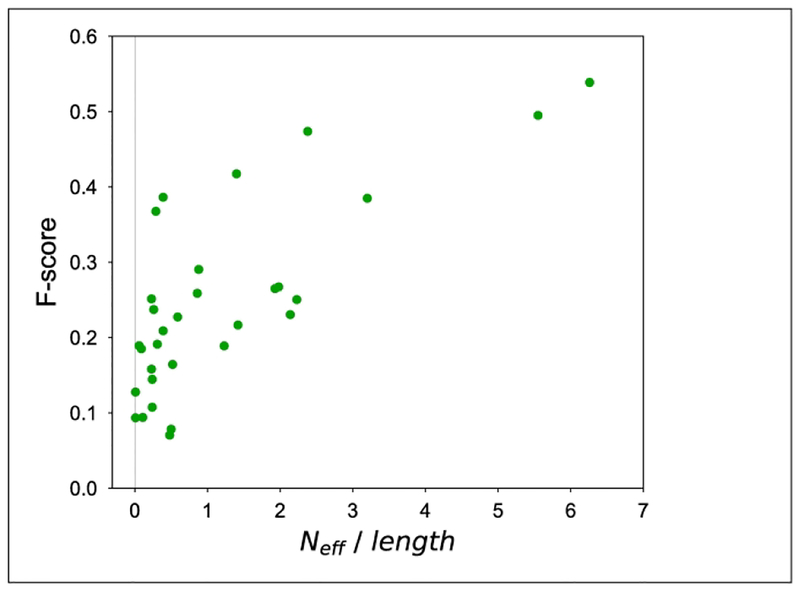
We also correlated the depth of the sequence profile (normalized number of effective sequences) with the accuracy (using F-score, considering L number of long-range contacts – Fig 5)). We considered the best contact prediction for a given target made by any group as the representative. Some targets with very little or essentially non-existent sequence information have a surprisingly high contact prediction accuracy. In general, about half of the targets have normalized Neff less than 1; nevertheless, some of these produced very accurate contact predictions, up to F-scores of 40%.
Correlation between contact prediction and protein size
The correlation between protein size and accuracy of contact prediction for the entire set of targets was r = 0.32, which suggests some low-level correlation; however, only four targets were above 300 residues and their contacts were predicted with average or above-average accuracy of 0.21–0.47 F-score values. After removing the largest four targets the rest of the 27 targets show no correlation (r = 0.11).
Correlation between contact prediction accuracy and types of connected secondary structures
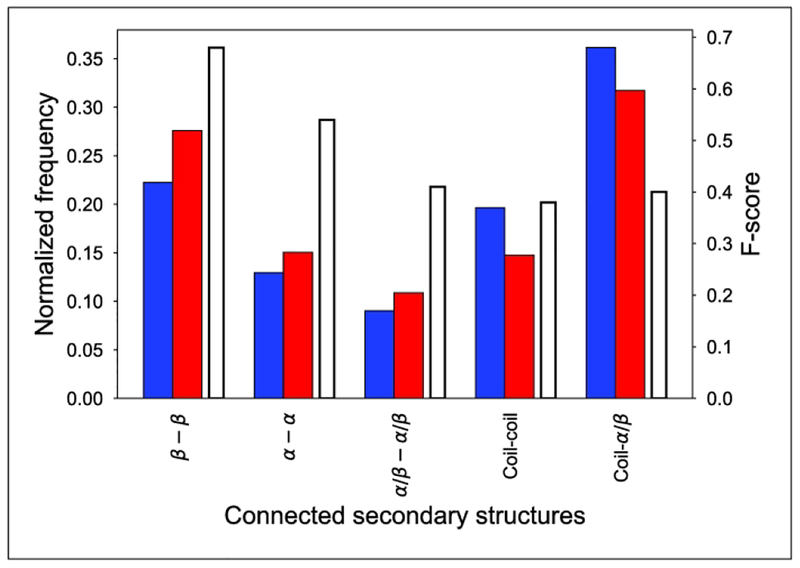
We analyzed the accuracy of contact prediction with respect to the types of secondary structures connected. Secondary structures were identified from the known experimental structures using the DSSP program60. First, we identified the native contacts in the known structures of the target proteins according to CASP definitions (within 8 Å of Cβ atoms of interacting residues.). Then, we compared the normalized counts of native to predicted contacts (Fig. 6, left y-axis, blue and red bars). Compared to the native contacts, the fraction of predictions between regular secondary structures with translational symmetry (between β-strands, α-helices, and between α-helices and β-strands) are predicted with higher frequency, compared to the fraction of contacts that involved at least one residue from a coil structure (coil-coil contacts and contacts between a coil and either an α-helix or β-strand). When looking at the accuracy of these predictions (Fig. 7, right y-axis and white bars), the contacts involving regular secondary structures are captured with markedly higher accuracy, especially in the case of contacts between the same regular secondary structures, whether they are β-strands or α-helices (F-scores 68.46(β-β), 54.46(α-α), 41.41(β-α) vs 38.06(coil-coil), 40.06(coil-β/α)). Since almost half of the contacts involve at least one residue from a coil structure, improving contact prediction in these segments would have a substantial impact. The lower accuracy of contact prediction is probably connected to the higher sequential variability of these segments, which provide less unambiguous co-evolutionary signal. These segments are also more difficult to structurally classify for neural networks when likely interaction patterns are established.
Figure 6.
Relationship between the number of target-length-normalized non-redundant number of hits (sequence profile depth) and the accuracy of contact prediction (F-score). The results of for L long-range contacts are shown for each target.
Figure 7.
Success of contact prediction as a function of connected secondary structures. The x-axis shows the types of secondary structures connected. The left y-axis shows the normalized frequency of contacts: the blue columns represent contacts observed in structures, while red columns refer to the predicted contacts in the same category. The right y-axis shows the accuracy of contact prediction in each category using F-score measure, and the corresponding columns are white with black edges.
Entropy of contacts
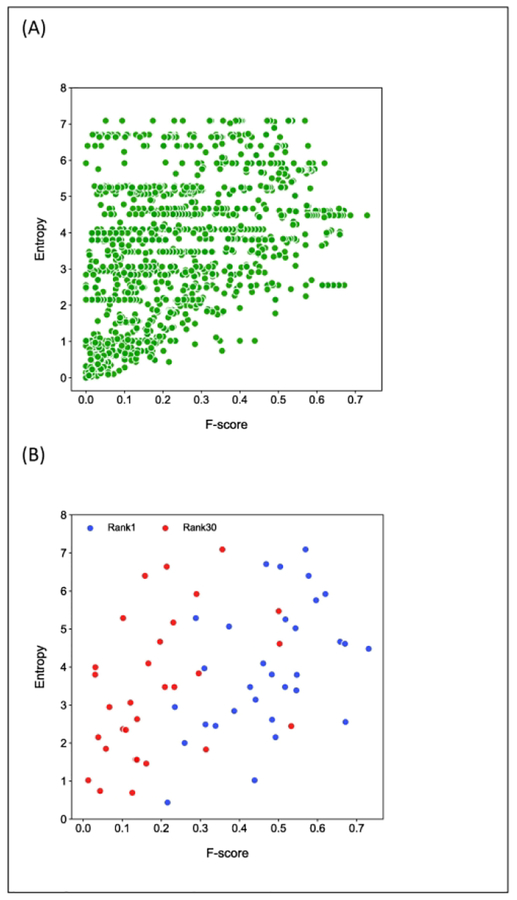
We calculated the entropy of contacts, in other words how dispersed the predicted contacts are along the sequence. The Entropy Score reflects the relative drop of the entropy due to geometric constraints imposed by the correctly predicted contacts on the protein shape with respect to the entropy of an extended state without any constraints. Contact prediction with high entropy can be either right or wrong. However, high accuracy predictions require high entropy (Fig. 8). This is somewhat expected as a high-accuracy prediction must include a variety of interaction hubs in the protein structure. An unbiased analysis of the relation between the entropy and accuracy of contacts is also complicated by the fact that algorithms often select contacts deliberately in an balanced manner along the sequence. The overall correlation between accuracy and entropy score considering L contacts and predictions for all targets by all groups is 0.43. We also explored this correlation considering the single best prediction for each target (Fig. 8B, blue dots), r=0.46, and by contrast picking a poorly performing prediction, with a relative rank of 30 (out of 44 groups) (Fig.8, red dots.), r=0.41. The correlations are nearly indistinguishable.
Figure 8.
Entropy of contact. Entropy of contact is shown as a function of accuracy (F-score) for L contacts, for (A) all targets submitted by all groups, and for (B) single most accurate prediction for each target (blue) and the prediction ranked 30 out of the 44 participating groups for each target (red).
Discussion
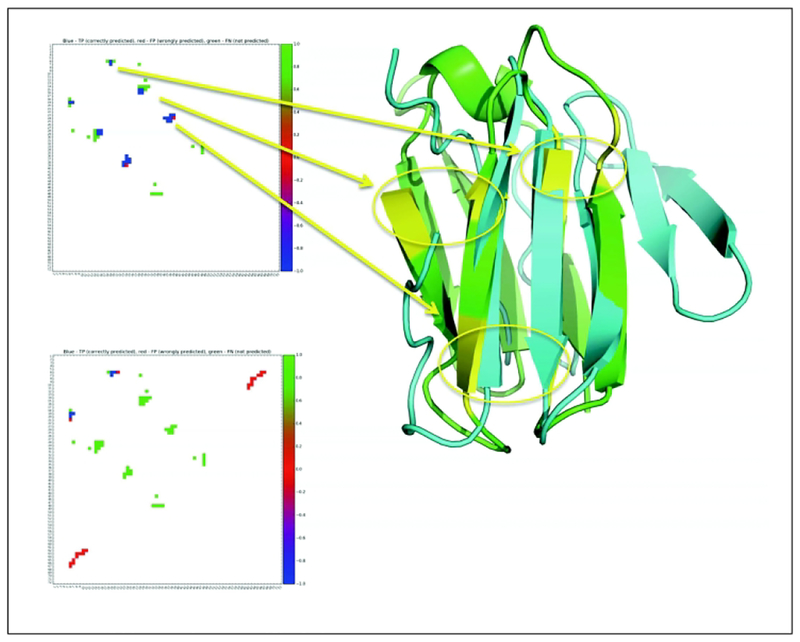
A typical contact prediction scenario is shown in Fig. 9. Two alternative predictions are compared for the same target, one of which is more accurate than the other (upper panel F-score = 0.64; lower panel F-score = 0.15). The correct predictions are marked blue in the distance maps. Out of the four major contact hubs in the target, the more accurate prediction captures three quite well, and makes no incorrect predictions (no red color). The less accurate prediction captures at most one interaction hub (missing most of the native contacts in three hubs, in green), and makes a strong incorrect prediction (in red) that would probably mislead subsequent modeling efforts. The corresponding structural features of interacting residue hubs are marked in the ribbon model with yellow circles, and the model shows the most accurate FM model obtained for this target, T0953s1d1, with a GDT_TS score of 54.48. In Fig. 4, we discussed the recent impressive advances in terms of precision of contact predictions, which reached just above 70% for long-range contacts at CASP13. However, precision values on a small number of contacts (L/5 in Fig. 4) can be overly optimistic. We used this evaluation because this has been done historically and therefore gives a clear comparison to performances at earlier meetings. However, if we assess the accuracy of contacts in terms of F-score and consider top L contacts (instead of just L/5), results worsen significantly. Even if we consider the single best prediction out of all the groups for each of the 32 targets, we get an overall average F-score of 0.24 (the highest single F-score achieved by any group and any target is 0.76 in this set). A recent work estimated that random residue-based prediction results in an average F-score of approximately 0.1261, with a very sharp normal distribution. Therefore, although an average F-score of 0.24 is certainly statistically significant, it is also clear that there is much room to further improve contact predictions. Contact prediction made a dramatic impact on the accuracy of the FM category modeling, but still about half of FM targets were not modelled correctly at CASP13. Considering the single best performing group, the average accuracy of FM models increased from an average of GDT_TS=41 in CASP12 to 56 in CASP1362. All of this suggests that at least a gradual additional improvement in the accuracy of contact predictions can still be anticipated.
Figure 9.
Contact maps are shown for the same target (T0953s1d1), upper and lower maps refer to a highly accurate (F-score 0.64) and inaccurate (F-score=0.15) predictions. Green, blue and red colors in contact maps refer to correct, missed and incorrect contact predictions. The hubs of interactions are visualized on the ribbon models with yellow circles marking the networks of contacting areas. Blue and green ribbon models refer to the model built on the upper contact map (GDT_TS scores of 54.48) and the experimental structure.
We also discussed the interesting phenomenon that some targets had outstanding prediction accuracies (with F-scores close to 0.4) despite the fact that no apparent sequence profile could be established and, as such, no useful evolutionary information could be extracted. All the top performing groups used deep neural networks for contact prediction. While sequence inputs can be used to predict correlated positions for contacts, neural networks can directly use input sequences to infer corresponding fragments and assembly of fragments, or possibly infer memories of sequence similarity utilizing the extensive supervised training of NNs with sequence profiles56. While it is not possible to definitely establish that this is what is happening without access to the particular approaches, we hypothesize that a strong synergy exists between prediction of fragments, their assemblies and contacts. The ability of convoluted neural network to predict structures and their corresponding contacts even in the near complete absence of useful evolutionary information has been reported by a number of groups recently. For instance, Zhang et al. (also one of the top performing groups at CASP13 and contributing an article in this issue), reported predicitions63, where protein profiles had low effective sequence depth but high contact prediction accuracy. In the same article the authors used an extreme case simulation when the neural network was fed with a single sequence. Despite the assumption that the input coupling matrix is random63, 11 out of 158 cases still achieved a very high F-score > 0.5, among a number of other reasonable predictions. Similar observations were made in another recent article by Jones et al.44,. While more sequences have a positive impact on the accuracy of contact prediction in general, the deep residual neural networks have the ability to learn the underlying contact patterns from limited coevolutionary information; the latter is important for structural modeling hard protein targets lacking homologous sequences or having very shallow alignments44. While contact prediction is a strong driver of improvements in tertiary modeling, it also has been established years ago that the protein structure universe has saturated on the level of supersecondary structure motifs64,65, and since about the year 2000 all the new folds can be derived from a combination of a handful of supersecondary structure motifs that were observed earlier66. It is therefore plausible that the advance in the FM modeling category and, indirectly, in the accuracy of contact prediction is due to an effective integration of the saturating structural information and our improved ability to correctly organize these motifs with predicted contacts using deep neural networks.
In this work, as in previous CASPs, we have presented different analyses of contact prediction accuracy. In early CASPs, where the number of targets was small and the predictions were usually poor, the different choice of evaluations often changed the ranking of groups, due the lack of statistical significance of differences67. Recently, contact predictions have seen strong advances and results are currently fairly robust irrespective of the choice of measures. As we discussed in detail, in most of these evaluations assessors subjectively selected usually short, fixed set of contacts for evaluation. Instead, in the future, we recommend to consider a larger set of contacts, whose length is equal to the actual number of contacts in the target structure. This can have several advantages. First, it would alleviate the need for a subjective definition of contact lists and focus the evaluation on what in fact is ultimately intended to be achieved i.e. predicting all contacts in a protein structure. Second, when the length of the contact list equals to the total number of contacts in the target structure, precision and F-score are equal, because precision and recall are the same. This simplifies the choice of scores used in this paper to a single one. Third, evaluating predictions on the target-specific number of native contacts in a given structure explicitly takes into account differences in the numbers of contacts per residue for different targets, a desired scoring feature. Finally, the overarching goal that contact predictions will be evaluated on the full set of native contacts might motivate groups to submit reasonable amount of contact predictions, unlike the current situation when the number of predicted contacts per target range between 10 and 63741.
Supplementary Material
Acknowledgments
This work was supported by the following grants and agencies: National Institutes of Health (NIH) grant GM118709, GM100482 and AI141816;
References
- 1.Moult J, Fidelis K, Kryshtafovych A, Schwede T, Tramontano A. Critical assessment of methods of protein structure prediction (CASP)-Round XII. Proteins. 2018;86 Suppl 1:7–15. [DOI] [PMC free article] [PubMed] [Google Scholar]
- 2.Moult J, Hubbard T, Bryant SH, Fidelis K, Pedersen JT. Critical assessment of methods of protein structure prediction (CASP): round II. Proteins. 1997;Suppl 1:2. [PubMed] [Google Scholar]
- 3.Zemla A, Venclovas C, Reinhardt A, Fidelis K, Hubbard TJ. Numerical criteria for the evaluation of ab initio predictions of protein structure. Proteins. 1997;Suppl 1:140. [DOI] [PubMed] [Google Scholar]
- 4.Schaarschmidt J, Monastyrskyy B, Kryshtafovych A, Bonvin A. Assessment of contact predictions in CASP12: Co-evolution and deep learning coming of age. Proteins. 2018;86 Suppl 1:51–66. [DOI] [PMC free article] [PubMed] [Google Scholar]
- 5.Monastyrskyy B, D’Andrea D, Fidelis K, Tramontano A, Kryshtafovych A. New encouraging developments in contact prediction: Assessment of the CASP11 results. Proteins. 2016;84 Suppl 1:131–144. [DOI] [PMC free article] [PubMed] [Google Scholar]
- 6.Monastyrskyy B, D’Andrea D, Fidelis K, Tramontano A, Kryshtafovych A. Evaluation of residue-residue contact prediction in CASP10. Proteins. 2014;82 Suppl 2:138–153. [DOI] [PMC free article] [PubMed] [Google Scholar]
- 7.Monastyrskyy B, Fidelis K, Tramontano A, Kryshtafovych A. Evaluation of residue-residue contact predictions in CASP9. Proteins. 2011;79 Suppl 10:119–125. [DOI] [PMC free article] [PubMed] [Google Scholar]
- 8.Ezkurdia I, Grana O, Izarzugaza JM, Tress ML. Assessment of domain boundary predictions and the prediction of intramolecular contacts in CASP8. Proteins. 2009;77 Suppl 9:196–209. [DOI] [PubMed] [Google Scholar]
- 9.Izarzugaza JM, Grana O, Tress ML, Valencia A, Clarke ND. Assessment of intramolecular contact predictions for CASP7. Proteins. 2007;69 Suppl 8:152–158. [DOI] [PubMed] [Google Scholar]
- 10.Aloy P, Stark A, Hadley C, Russell RB. Predictions without templates: new folds, secondary structure, and contacts in CASP5. Proteins. 2003;53 Suppl 6:436–456. [DOI] [PubMed] [Google Scholar]
- 11.Lesk AM, Lo Conte L, Hubbard TJ. Assessment of novel fold targets in CASP4: predictions of three-dimensional structures, secondary structures, and interresidue contacts. Proteins. 2001;Suppl 5:98–118. [DOI] [PubMed] [Google Scholar]
- 12.Orengo CA, Bray JE, Hubbard T, LoConte L, Sillitoe I. Analysis and assessment of ab initio three-dimensional prediction, secondary structure, and contacts prediction. Proteins. 1999;Suppl 3:149–170. [DOI] [PubMed] [Google Scholar]
- 13.Grana O, Baker D, MacCallum RM, et al. CASP6 assessment of contact prediction. Proteins. 2005;61 Suppl 7:214–224. [DOI] [PubMed] [Google Scholar]
- 14.Reddy BV, Blundell TL. Packing of secondary structural elements in proteins. Analysis and prediction of inter-helix distances. JMolBiol. 1993;233(3):464. [DOI] [PubMed] [Google Scholar]
- 15.Fleming PJ, Rose GD. Do all backbone polar groups in proteins form hydrogen bonds? Protein Sci. 2005;14(7):1911–1917.15937286 [Google Scholar]
- 16.Wyckoff HW. The compensating nature of substitutions in pancreatic ribonucleases. Brookhaven Symp Biol. 1968;21:252–258. [Google Scholar]
- 17.Wu CH, Huang H, Arminski L, et al. The Protein Information Resource: an integrated public resource of functional annotation of proteins. Nucleic Acids Res. 2002;30(1):35–37. [DOI] [PMC free article] [PubMed] [Google Scholar]
- 18.Gobel U, Sander C, Schneider R, Valencia A. Correlated mutations and residue contacts in proteins. Proteins. 1994;18(4):309–317. [DOI] [PubMed] [Google Scholar]
- 19.Shindyalov IN, Kolchanov NA, Sander C. Can three-dimensional contacts in protein structures be predicted by analysis of correlated mutations? Protein Eng. 1994;7(3):349–358. [DOI] [PubMed] [Google Scholar]
- 20.Orengo CA, Bray JE, Hubbard T, LoConte L, Sillitoe II. Analysis and assessment of ab initio three-dimensional prediction, secondary structure, and contacts prediction. Proteins. 1999;37(S3):149. [DOI] [PubMed] [Google Scholar]
- 21.Lesk AM. CASP2: report on ab initio predictions. Proteins. 1997;Suppl 1:151. [DOI] [PubMed] [Google Scholar]
- 22.Skolnick J, Kolinski A, Ortiz AR. MONSSTER: a method for folding globular proteins with a small number of distance restraints. JMolBiol. 1997;265(2):217. [DOI] [PubMed] [Google Scholar]
- 23.Skolnick J, Kolinski A, Ortiz A. Derivation of protein-specific pair potentials based on weak sequence fragment similarity. Proteins. 2000;38(1):3–16. [PubMed] [Google Scholar]
- 24.Olmea O, Rost B, Valencia A. Effective use of sequence correlation and conservation in fold recognition. J Mol Biol. 1999;293(5):1221–1239. [DOI] [PubMed] [Google Scholar]
- 25.Rubinstein R, Fiser A. Predicting disulfide bond connectivity in proteins by correlated mutations analysis. Bioinformatics. 2008;24(4):498–504. [DOI] [PubMed] [Google Scholar]
- 26.Fariselli P, Riccobelli P, Casadio R. Role of evolutionary information in predicting the disulfide-bonding state of cysteine in proteins. Proteins. 1999;36(3):340–346. [PubMed] [Google Scholar]
- 27.Dosztanyi Z, Fiser A, Simon I. Stabilization centers in proteins: identification, characterization and predictions. JMolBiol. 1997;272(4):597. [DOI] [PubMed] [Google Scholar]
- 28.Tudos E, Fiser A, Simon I. Different sequence environments of amino acid residues involved and not involved in long-range interactions in proteins. IntJPeptProtein Res. 1994;43(2):205. [DOI] [PubMed] [Google Scholar]
- 29.Cline MS, Karplus K, Lathrop RH, Smith TF, Rogers RG Jr., Haussler D. Information-theoretic dissection of pairwise contact potentials. Proteins. 2002;49(1):7. [DOI] [PubMed] [Google Scholar]
- 30.Shackelford G, Karplus K. Contact prediction using mutual information and neural nets. Proteins. 2007;69 Suppl 8:159–164. [DOI] [PubMed] [Google Scholar]
- 31.Fariselli P, Olmea O, Valencia A, Casadio R. Prediction of contact maps with neural networks and correlated mutations. Protein Eng. 2001;14(11):835–843. [DOI] [PubMed] [Google Scholar]
- 32.Fariselli P, Casadio R. A neural network based predictor of residue contacts in proteins. Protein Eng. 1999;12(1):15–21. [DOI] [PubMed] [Google Scholar]
- 33.Burger L, van Nimwegen E. Disentangling direct from indirect co-evolution of residues in protein alignments. PLoS Comput Biol. 2010;6(1):e1000633. [DOI] [PMC free article] [PubMed] [Google Scholar]
- 34.Anishchenko I, Ovchinnikov S, Kamisetty H, Baker D. Origins of coevolution between residues distant in protein 3D structures. Proc Natl Acad Sci U S A. 2017;114(34):9122–9127. [DOI] [PMC free article] [PubMed] [Google Scholar]
- 35.Morcos F, Pagnani A, Lunt B, et al. Direct-coupling analysis of residue coevolution captures native contacts across many protein families. Proc Natl Acad Sci U S A. 2011;108(49):E1293–1301. [DOI] [PMC free article] [PubMed] [Google Scholar]
- 36.Weigt M, White RA, Szurmant H, Hoch JA, Hwa T. Identification of direct residue contacts in protein-protein interaction by message passing. Proc Natl Acad Sci U S A. 2009;106(1):67–72. [DOI] [PMC free article] [PubMed] [Google Scholar]
- 37.Morcos F, Hwa T, Onuchic JN, Weigt M. Direct coupling analysis for protein contact prediction. Methods Mol Biol. 2014;1137:55–70. [DOI] [PubMed] [Google Scholar]
- 38.Jones DT, Buchan DW, Cozzetto D, Pontil M. PSICOV: precise structural contact prediction using sparse inverse covariance estimation on large multiple sequence alignments. Bioinformatics. 2012;28(2):184–190. [DOI] [PubMed] [Google Scholar]
- 39.Kamisetty H, Ovchinnikov S, Baker D. Assessing the utility of coevolution-based residue-residue contact predictions in a sequence- and structure-rich era. Proc Natl Acad Sci U S A. 2013;110(39):15674–15679. [DOI] [PMC free article] [PubMed] [Google Scholar]
- 40.Ma J, Wang S, Wang Z, Xu J. Protein contact prediction by integrating joint evolutionary coupling analysis and supervised learning. Bioinformatics. 2015;31(21):3506–3513. [DOI] [PMC free article] [PubMed] [Google Scholar]
- 41.Sun HP, Huang Y, Wang XF, Zhang Y, Shen HB. Improving accuracy of protein contact prediction using balanced network deconvolution. Proteins. 2015;83(3):485–496. [DOI] [PMC free article] [PubMed] [Google Scholar]
- 42.Feizi S, Marbach D, Medard M, Kellis M. Network deconvolution as a general method to distinguish direct dependencies in networks. Nat Biotechnol. 2013;31(8):726–733. [DOI] [PMC free article] [PubMed] [Google Scholar]
- 43.LeCun Y, Bengio Y, Hinton G. Deep learning. Nature. 2015;521(7553):436–444. [DOI] [PubMed] [Google Scholar]
- 44.Jones DT, Kandathil SM. High precision in protein contact prediction using fully convolutional neural networks and minimal sequence features. Bioinformatics. 2018;34(19):3308–3315. [DOI] [PMC free article] [PubMed] [Google Scholar]
- 45.Wang S, Sun S, Li Z, Zhang R, Xu J. Accurate De Novo Prediction of Protein Contact Map by Ultra-Deep Learning Model. PLoS Comput Biol. 2017;13(1):e1005324. [DOI] [PMC free article] [PubMed] [Google Scholar]
- 46.Adhikari B, Hou J, Cheng J. DNCON2: improved protein contact prediction using two-level deep convolutional neural networks. Bioinformatics. 2018;34(9):1466–1472. [DOI] [PMC free article] [PubMed] [Google Scholar]
- 47.Adhikari B, Hou J, Cheng J. Protein contact prediction by integrating deep multiple sequence alignments, coevolution and machine learning. Proteins. 2018;86 Suppl 1:84–96. [DOI] [PMC free article] [PubMed] [Google Scholar]
- 48.Buchan DWA, Jones DT. Improved protein contact predictions with the MetaPSICOV2 server in CASP12. Proteins. 2018;86 Suppl 1:78–83. [DOI] [PMC free article] [PubMed] [Google Scholar]
- 49.Liu Y, Palmedo P, Ye Q, Berger B, Peng J. Enhancing Evolutionary Couplings with Deep Convolutional Neural Networks. Cell Syst. 2018;6(1):65–74 e63. [DOI] [PMC free article] [PubMed] [Google Scholar]
- 50.Jones DT, Singh T, Kosciolek T, Tetchner S. MetaPSICOV: combining coevolution methods for accurate prediction of contacts and long range hydrogen bonding in proteins. Bioinformatics. 2015;31(7):999–1006. [DOI] [PMC free article] [PubMed] [Google Scholar]
- 51.Eickholt J, Cheng J. A study and benchmark of DNcon: a method for protein residue-residue contact prediction using deep networks. BMC Bioinformatics. 2013;14 Suppl 14:S12. [DOI] [PMC free article] [PubMed] [Google Scholar]
- 52.Michel M, Skwark MJ, Menendez Hurtado D, Ekeberg M, Elofsson A. Predicting accurate contacts in thousands of Pfam domain families using PconsC3. Bioinformatics. 2017;33(18):2859–2866. [DOI] [PubMed] [Google Scholar]
- 53.Stahl K, Schneider M, Brock O. EPSILON-CP: using deep learning to combine information from multiple sources for protein contact prediction. BMC Bioinformatics. 2017;18(1):303. [DOI] [PMC free article] [PubMed] [Google Scholar]
- 54.Nabuurs SB, Spronk CA, Krieger E, Maassen H, Vriend G, Vuister GW. Quantitative evaluation of experimental NMR restraints. J Am Chem Soc. 2003;125(39):12026–12034. [DOI] [PubMed] [Google Scholar]
- 55.Kryshtafovych A, Fidelis K, Moult J. CASP10 results compared to those of previous CASP experiments. Proteins. 2014;82 Suppl 2:164–174. [DOI] [PMC free article] [PubMed] [Google Scholar]
- 56.Kandathil SM, Greener JG, Jones DT. Prediction of inter-residue contacts with DeepMetaPSICOV in CASP13. Proteins. 2019. [DOI] [PMC free article] [PubMed] [Google Scholar]
- 57.Hou J, Wu T, Cao R, Cheng J. Protein tertiary structure modeling driven by deep learning and contact distance prediction in CASP13. Proteins. 2019. [DOI] [PMC free article] [PubMed] [Google Scholar]
- 58.Altschul SF, Madden TL, Schaffer AA, et al. Gapped BLAST and PSI-BLAST: a new generation of protein database search programs. Nucleic Acids Res. 1997;25(17):3389–3402. [DOI] [PMC free article] [PubMed] [Google Scholar]
- 59.Remmert M, Biegert A, Hauser A, Soding J. HHblits: lightning-fast iterative protein sequence searching by HMM-HMM alignment. Nature Methods. 2012;9(2):173–175. [DOI] [PubMed] [Google Scholar]
- 60.Kabsch W, Sander C. Dictionary of protein secondary structure: pattern recognition of hydrogen-bonded and geometrical features. Biopolymers. 1983;22(12):2577–2637. [DOI] [PubMed] [Google Scholar]
- 61.Gil N, Fiser A. The choice of sequence homologs included in multiple sequence alignments has a dramatic impact on evolutionary conservation analysis. Bioinformatics. 2019;35(1):12–19. [DOI] [PMC free article] [PubMed] [Google Scholar]
- 62.AlQuraishi M. AlphaFold at CASP13. Bioinformatics. 2019. [DOI] [PMC free article] [PubMed] [Google Scholar]
- 63.Li Y, Hu J, Zhang C, Yu DJ, Zhang Y. ResPRE: high-accuracy protein contact prediction by coupling precision matrix with deep residual neural networks. Bioinformatics. 2019. [DOI] [PMC free article] [PubMed] [Google Scholar]
- 64.Fernandez-Fuentes N, Fiser A. A modular perspective of protein structures: application to fragment based loop modeling. Methods Mol Biol. 2013;932:141–158. [DOI] [PMC free article] [PubMed] [Google Scholar]
- 65.Fernandez-Fuentes N, Fiser A. Saturating representation of loop conformational fragments in structure databanks. BMC Struct Biol. 2006;6:15. [DOI] [PMC free article] [PubMed] [Google Scholar]
- 66.Fernandez-Fuentes N, Dybas JM, Fiser A. Structural Characteristics of Novel Protein Folds. Plos Computational Biology. 2010;6(4). [DOI] [PMC free article] [PubMed] [Google Scholar]
- 67.Marti-Renom MA, Madhusudhan MS, Fiser A, Rost B, Sali A. Reliability of assessment of protein structure prediction methods. Structure. 2002;10(3):435–440. [DOI] [PubMed] [Google Scholar]
Associated Data
This section collects any data citations, data availability statements, or supplementary materials included in this article.


