

Abstract
Rhythms of various periodicities drive cyclical processes in organisms ranging from single cells to the largest mammals on earth, and on scales from cellular physiology to global migrations. The molecular mechanisms that generate circadian behaviours in model organisms have been well studied, but longer phase cycles and interactions between cycles with different periodicities remain poorly understood. Broadcast spawning corals are one of the best examples of an organism integrating inputs from multiple environmental parameters, including seasonal temperature, the lunar phase and hour of the day, to calibrate their annual reproductive event. We present a deep RNA‐sequencing experiment utilizing multiple analyses to differentiate transcriptomic responses modulated by the interactions between the three aforementioned environmental parameters. Acropora millepora was sampled over multiple 24‐hr periods throughout a full lunar month and at two seasonal temperatures. Temperature, lunar and diurnal cycles produce distinct transcriptomic responses, with interactions between all three variables identifying a core set of genes. These core genes include mef2, a developmental master regulator, and two heterogeneous nuclear ribonucleoproteins, one of which is known to post‐transcriptionally interact with mef2 and with biological clock‐regulating mRNAs. Interactions between diurnal and temperature differences impacted a range of core processes ranging from biological clocks to stress responses. Genes involved with developmental processes and transcriptional regulation were impacted by the lunar phase and seasonal temperature differences. Lastly, there was a diurnal and lunar phase interaction in which genes involved with RNA‐processing and translational regulation were differentially regulated. These data illustrate the extraordinary levels of transcriptional variation across time in a simple radial cnidarian in response to the environment under normal conditions.
Keywords: cnidarians, development and evolution, ecological genetics, genomics/proteomics, transcriptomics
1. INTRODUCTION
Rhythmic environmental changes occur across various timescales, and biological clocks help organisms to anticipate these changes. These clocks correspond largely to the periodicity of the environmental patterns that entrain them. For example, circadian rhythms drive daily oscillations from sleep–wake cycles (Dijk & Czeisler, 1995) to mental acuity (Mallis & DeRoshia, 2005), while longer‐period circalunar and circannual cycles drive reproductive and seasonal patterns (Kaiser et al., 2016; Sáenz De Miera et al., 2014). Circadian clocks are well understood and are based on transcription‐initiated processes (Dunlap, 1999), but the molecular underpinnings of longer cycles remain elusive and much of our knowledge in this regard is limited to hormonal cycles that are probably the terminal mediators of these systems (e.g., Crowder, Meyer, Fan, & Weis, 2017; Kaniewska, Alon, Karako‐Lampert, Hoegh‐Guldberg, & Levy, 2015; Takeda et al., 2018; Tarrant, 2005; Thorndyke & Goldsworthy, 1988).
Precise time‐keeping corresponding to multiple rhythmic periodicities is exemplified by broadcast spawning corals. Once a year, reef‐building corals synchronize their release of gametes with conspecifics to achieve high fertilization rates within the vastness of the oceans (Babcock et al., 1986). This strategy is also useful to coincide spawning with optimal conditions for offspring development, dispersal and survival (Mercier & Hamel, 2009). Consequently, reef‐building corals use varying environmental cues to control the exact timing of reproduction. Seasonal rhythms are probably driven by water temperatures (e.g., Keith et al., 2016), lunar cycles by moonlight (reviewed by Raible, Takekata, & Tessmar‐Raible, 2017), and daily rhythms by sunrise and sunset light cycles (e.g., Brady, Hilton, & Vize, 2009; Dunlap, 1999; Hoadley, Szmant, & Pyott, 2011; Reitzel, Tarrant, & Levy, 2013).
While each rhythmic environmental variable has been established as being important, little is known as to how these systems interact with each other. These interactions are likely to be important and could help explain why corals on a particular reef have highly predictable spawn timing, while neighbouring reefs have different spawning windows. For example, nearshore coral off the Great Barrier Reef (GBR) spawn a month earlier than those located on offshore reefs (Babcock et al., 1986). Furthermore, on the West coast of Australia, at a similar latitude similar to the GBR, some individuals spawn in the spring whereas others spawn in the autumn (Gilmour, Speed, & Babcock, 2016). Water temperatures change not only with season but also with time of day, tidal flow and the prevailing weather conditions. Lunar influences are complicated by weather and cloud cover and are associated with shifts in gravitation and tides (Wolstenholme, Nozawa, Byrne, & Burke, 2018) that in turn impact temperature, pH and dissolved oxygen levels (Ruiz‐Jones & Palumbi, 2017), although evidence to date indicates that moonlight is the key lunar cycle driver (Boch, Ananthasubramaniam, Sweeney, Doyle, & Morse, 2011). Daily cycles are impacted by weather, seasonal changes in day length and temperature, as well as lunar and tidal cycles as discussed above.
The above examples suggest that a single individual rhythmic environmental input is probably too varied to generate precisely timed once‐per‐year spawning behaviours. Our objective in this study was to determine how the effects of seasonal temperature, the lunar phase and time of the day interact at a transcriptomic level in a reef‐building coral, as intersecting rhythms may enable corals to generate precisely timed behaviours. Previous studies have explored some of these changes in cnidarians over shorter time periods in a variety of scenarios, including natural temperature flux and the lunar phase (e.g., Brady, Willis, Harder, & Vize, 2016; Crowder et al., 2017; Hoadley et al., 2011; Kaniewska et al., 2015; Oldach, Workentine, Matz, Fan, & Vize, 2017; Reitzel et al., 2013), but an in‐depth sampling and transcriptomic analysis of diurnal patterns over an entire lunar month at multiple temperatures has not been attempted. We present multiple distinct analyses that uncouple how different environmental rhythms interact and identify genes and pathways that are regulated by environmental rhythms. Such interactions may form the foundation of long‐term time‐keeping in corals.
2. MATERIALS AND METHODS
2.1. Sample collection and experimental design
Acropora millepora (Figure 1) colonies (n = 5) were collected on the northeast section of Heron Reef known as Libby's Point (23°26′03.5″S, 151°55′13.4″E). Colonies of 30 cm were retrieved via SCUBA diving using a hammer and chisel between 2 and 5 m depth on April 4, 2016 (GBRMPA collections permit G16/38344.1). Each coral colony was then broken into smaller mini colonies, which had 10 or more branches, and then labelled based on parent colony and distributed between the two experimental aquaria kept at summer (27°C) or winter temperatures (21.5°C). Each mini colony was randomly moved to a new location within each tank every 3 days throughout the experiment to minimize confounding effects of differing water flow or lighting (tank effects) in the experimental aquaria (66 cm × 176 cm × 40 cm). All coral colonies appeared healthy throughout the experiment and showed no visible indication of stress. The tanks were supplied continuously with common unfiltered seawater and a shade cloth was placed over both tanks to reduce full daylight to 250–300 µmol m−2 s−1 (measured with a LI‐COR LI‐192 underwater quantum sensor). The cool winter water condition (21.5°C) was achieved by chilling the water with a Hailea HC‐500a aquarium chiller. To avoid stress on the coral from sudden temperature shock, the corals were slowly acclimated from 27 to 21.5°C by decreasing the temperature by 2°C per day. The warm summer water condition was maintained at 27°C with three 300‐W aquarium heaters to simulate a summer temperature. Once the desired temperatures were established, the corals were conditioned in both tanks for 18 days before sampling. Water temperature in both tanks was measured continuously with two HOBO Pendant Temperature/Light 64 K data loggers. While every effort was made to make conditions in the two tanks identical except for temperature, it remains possible that tank effects could have occurred, and when the term “temperature” is used in this report, this caveat should be kept in mind.
Figure 1.
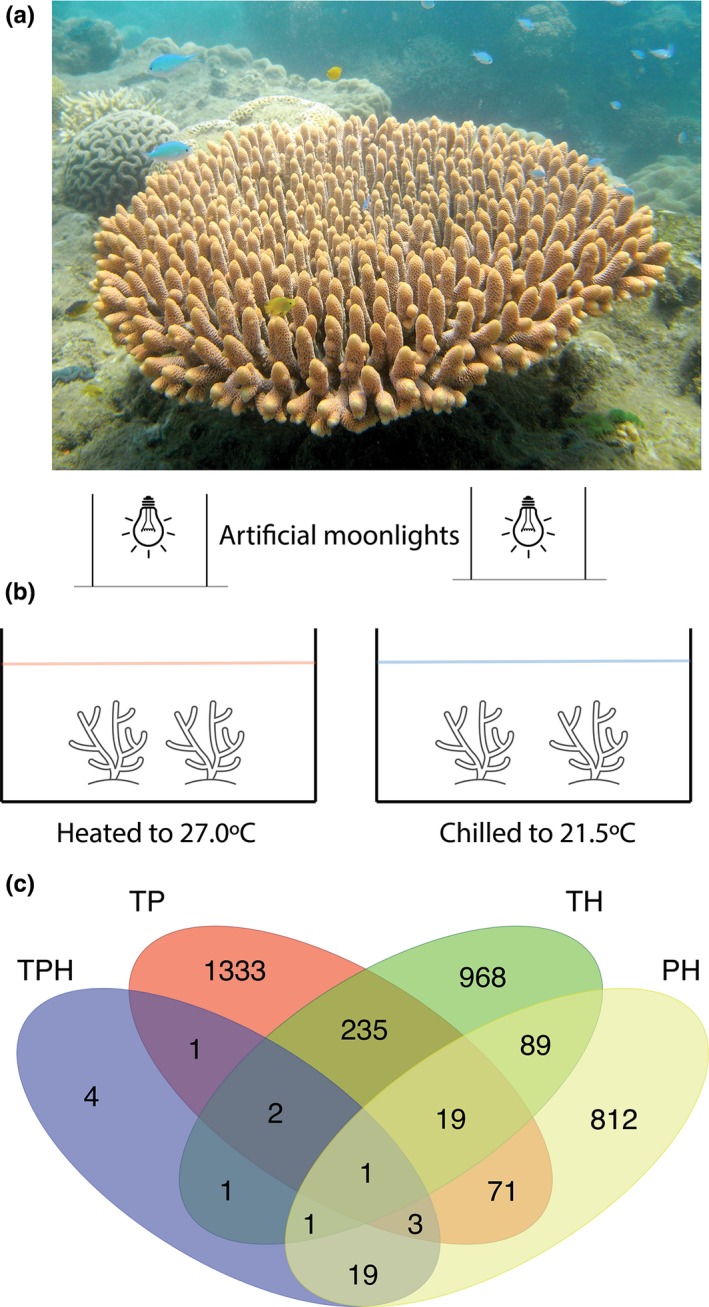
Interaction of temperature, the lunar phase and hour of the day on transcription in Acropora millepora. (a) Image of an A. millepora colony. (b) Schematic of our experimental set‐up with two temperature treatments under artificial moonlight with natural sunlight cycles. (c) Venn diagram of differentially expressed genes between all interaction‐based likelihood‐ratio tests. TP, temperature/lunar phase interaction; TH, temperature/hour interaction; PH, phase/hour interaction; TPH temperature/phase/hour interaction
2.2. Moonlight apparatus
Moonlight was supplied via artificial lights to avoid variations due to cloud cover and rainfall. After sunset, a large cover was placed over both aquaria to ensure no light pollution from surrounding buildings on the station could be perceived by the coral. The lunar light was constructed to replicate the intensity, timing and broad spectral qualities of moonlight. The lunar light apparatus consisted of a single 12‐W 5,000 k dimmable broad‐spectrum bulb (Crompton ES 5,000 k, spectrum given in Figure S1) enclosed in a box where two “1.2” (4 f stops) and one “0.6” (2 f stops) LEE neutral density filters were fitted over the lightbox opening. The neutral density filters were effective at dimming the brightness of the light source to match full moon levels (0.22 Lux, measured with an Extech Easy View 33 light meter). Both moonlight sources were connected to a dimmer switch that was manually adjusted to match the light intensities of different lunar phases using the light meter in a daily manner. Moonrise and moonset times were also matched to the local lunar cycle (Table S1) with an automatic timer that was reset daily. The cover was removed immediately before sunrise every day.
2.3. Experimental sampling
Samples of a 1.0‐g coral branch tip were removed with coral cutters from each coral colony (n = 5) at six time points separated by 4‐hr intervals (starting at 4 p.m. local time) from both temperature treatments, generating a daily transcriptome profile. This daily profile was repeated over a lunar month on the full moon (FM), third quarter (TQ), new moon (NM) and first quarter (FQ) moon phases for a total of 240 samples across the experiment.
Following collection, RNA was immediately isolated using Trizol reagent (Thermo‐Fisher) according to the manufacturer's instructions as described by Oldach et al. (2017). In brief, this method involves grinding the branch tip with a mortar and pestle to a slurry in Trizol and then following the manufacturer's protocol. RNA was precipitated via the addition of 0.25 volumes of salt solution (0.8 M sodium citrate + 1.2 M NaCl) to reduce polysaccharide precipitation and 0.25 volumes of isopropyl alcohol to collect RNA. Pellets were rinsed with 70% ethanol before being redissolved in water and stored in a −80°C freezer. DNA contamination was removed using DNase (Thermo‐Fisher), and RNA concentrations and quality were determined with an Agilent 4200 TapeStation assay. The top 211 samples were selected for library preparation and sequencing based on RNA quality. Illumina TruSeq stranded mRNA protocols were used to generate libraries and an Illumina NextSeq500 device was used to generate single‐end reads of 75 bp.
2.4. Bioinformatics and analyses
The quality of raw sequences were assessed with fastqc version 0.11.5 (Andrews, 2010) and 90% of reads had PHRED quality scores greater than 20. Raw sequences were deemed high quality and aligned to the A. millepora reference transcriptome (Moya et al., 2012) using bowtie2 version 2.3.3 with default settings (Langmead & Salzberg, 2012). rsem version 1.3.0 (Li & Dewey, 2011) was then used to calculate expression by counting the number of reads that were assigned to specific isogroups into a raw read count table. An isogroup is a 454‐transcriptome assembler term for the collection of alternative splice variants of the same gene. The raw read count table from rsem was imported and a table of basic descriptive statistics was calculated for each sample. As many of the genes were not represented with any read counts, the count table was filtered so that any row (gene) containing all zero counts was removed.
To account for differences in library sizes, the estimatedSizeFactors function was used in deseq2 version 1.16.1 (Love, Huber, & Anders, 2014). From this, a normalized count table was generated, which was used in all subsequent differential expression analyses and is available from Dryad.
2.5. Principal component analysis and outlier removal
Counts were first transformed with a regularized‐logarithm transformation (rlog) with deseq2. A principal component analysis was then plotted using the rlog counts to ascertain the clustering of sample‐to‐sample expression. The rlog transformation was only applied to visualize the ordinates of principal components and was not used in other analyses. Each variable (temperature, phase, hour, individual) was identified to determine which variable summarized the variance between the first and second principal component. Different individuals were tightly clustered in this analysis with the exception of two samples that grouped within different individual clusters (Figure S2). Due to the extremely consistent pattern of these data, it is possible these samples were mislabelled, so these two points were removed from analyses, giving a total of 209 samples.
2.6. Differential expression analyses
To determine which genes were differentially expressed as a result of environmental and experimental interactions, various likelihood ratio tests (LRTs) were applied using deseq2. Each LRT distinguishes deviances in the goodness of fit between a specified full generalized linear model with a reduced model. Therefore, the specific term or interaction removed from the full model reflects how that term or interaction contributes to the full model. A Benjamini–Hochberg method for multiple testing was applied to adjust p‐values (Benjamini & Hochberg, 1995) and genes were filtered based on adjusted p‐values <.05 to generate a list of differentially expressed genes (DEGs, Table S1). To determine if overlapping DEGs were over‐ or under‐represented between analyses, a hypergeometric test was performed.
2.7. Annotation
The annotations of the A. millepora transcriptome were updated by performing a sequence similarity‐based functional annotation using the blastx algorithm (Altschul, Gish, Miller, Myers, & Lipman, 1990) against NCBI's GenBank release 226.0. Sequences were queried against the National Center for Biotechnology Information (NCBI) protein sequence database to retrieve any corresponding annotations from related species. blast2go version 4.1.9 (Conesa et al., 2005) was used to find corresponding gene ontology (GO) terms, Enzyme Codes, InterPro and KEGG annotations for each gene sequence.
2.8. Gene set enrichment analyses
Gene set enrichment analysis (GSEA) was conducted with blast2go version 4.1.9. GSEAs are useful to highlight over‐represented sets of GO terms for each list of DEGs. blast2go calculates a statistic similar to the Kolmogorov–Smirnov statistic by generating enrichment scores for each GO term and uses a permutation test to produce a null distribution of enrichment scores. The enrichment scores for the DEGs are then compared to the null distribution, and it can be determined if a GO term is over‐represented.
Normalized counts of genes associated with biologically relevant GO terms determined significant from GSEAs were plotted on a heat‐map using heatmap2 as part of the gplots version 3.0.1 (Warnes et al., 2019) r package. Genes tagged with specific GO terms were also visualized individually by displaying average counts and 95% confidence intervals using ggplot2 version 2.2.1 (Wickham, 2016).
2.9. Hierarchical clustering
Annotated DEGs for each significant GO group identified by the GSEAs underwent a hierarchical agglomerative clustering based on Euclidian distances of expression patterns using heatmap2 as part of the gplots version 3.0.1(Warnes et al., 2019) package in r. The clustering process was visualized with heatmaps and a row dendrogram, which illustrates how similar one gene expression pattern is to another.
3. RESULTS
3.1. Responses to multiple environmental variables
The goal of this study was to explore how multiple environmental variables interact to generate changes in gene expression in a reef‐building coral. Temperature (T), hour of the day (H) and the lunar phase (P) were each associated with thousands of DEGs, many of which were similar to genes identified in other studies exploring a single environmental parameter (e.g., Barshis et al., 2013; data available in Table S1). The combined models presented here explored the interactions of two or more of these rhythmic environmental processes and identified 3,560 DEGs from different analyses (Figure 1). Of those, the majority of DEGs (87.5%) were unique to each analysis exploring a specific interaction between environmental variables. The remaining 447 DEGs were found in two or more analyses (Table 1). Using a hypergeometric test, we found that the DEGs that overlapped between temperature/hour (TH) and temperature/phase (TP) analyses were 1.5 times more over‐represented than what would be expected compared to a random sampling of genes in the data (p = 9.78e‐12). In contrast, the overlapping DEGs between PH and TP were 1.51 times under‐represented (p = 2.80e‐06) compared to a random list of genes, suggesting these lists are highly independent. The temperature/phase/hour (TPH) results shares most (87%) of their DEGs with the other analyses with PH having the majority (77%) of the overlapping genes, which is a 28.2‐fold increase over expectation (Table 2).
Table 1.
Likelihood ratio tests used for each analysis
| Likelihood ratio test | Acronym | Full model | Reduced model |
|---|---|---|---|
| Temperature × Hour | TH | ~genotype + temperature + phase + hour + temperature:phase + temperature:hour + phase:hour | ~genotype + temperature + phase + hour + temperature:phase + phase:hour |
| Temperature × Phase | TP | ~genotype + temperature + phase + hour + temperature:phase + temperature:hour + phase:hour | ~genotype + temperature + phase + hour + temperature:hour + phase:hour |
| Phase × Hour | PH | ~genotype + temperature + phase + hour + temperature:phase + temperature:hour + phase:hour | ~genotype + temperature + phase + hour + temperature:phase + temperature:hour |
| Temperature × Phase × Hour | TPH | ~genotype + temperature + phase + hour + temperature:phase + temperature:hour + phase:hour + temperature:phase:hour | ~genotype + temperature + phase + hour + temperature:phase + temperature:hour + phase:hour |
Table 2.
Hypergeometric test on overlapping gene representation table
| Terms | TPH | TP | TH | |||
|---|---|---|---|---|---|---|
| Fold enrichment | Hypergeometric p‐value | Fold enrichment | Hypergeometric p‐value | Fold enrichment | Hypergeometric p‐value | |
| TP | ↑ 9.41 | p < .0001 | ||||
| TH | ↑ 5.88 | p < .01 | ↑ 1.50 | p < .0001 | ||
| PH | ↑ 28.2 | p < .0001 | ↓ 1.51 | p < .0001 | NA | p = .085 |
Abbreviation: NA, not applicable; PH, Phase × Hour; TH, Temperature × Hour; TP, Temperature × Phase; TPH, Temperature × Phase × Hour.
3.2. The interaction of temperature and daily rhythms
Genes regulating biological clocks are commonly expressed in sinusoidal cycles that peak and fall over 24‐hr periods. While temperature effects on daily cycles have been explored in other phyla, including arthropods (Kaneko et al., 2013) and fungi (Dunlap & Loros, 2016) as well as short‐term effects on circadian transcription in bivalve mussels (Connor & Gracey, 2011), interactions between these variables remain poorly understood. Our second analysis identified 1,316 genes (p < .05, FDR < 0.05, Table S1) that displayed differential expression interactions between temperature and hour of the day in A. millepora. GSEA (see Section 2) of this group of DEGs indicated that the top two processes represented are “rhythmic process” and “circadian rhythm” (Table S1). The expression profiles of genes in these groups are illustrated in Figure 2. Many genes differ in the amplitude of expression level over a 24‐hr cycle (e.g., cycle, cry1.3 and clock), similar to circadian genes in other ectothermic organisms (Dunlap & Loros, 2016). In contrast to this pattern, one of the most striking temperature responses is in lark/rbm4, which displays a strong peak at noon at the high summer temperature, but no increase in daytime transcription at low winter temperatures (Figure 2). Lark encodes an RNA‐binding protein that has been shown to regulate translation of casein kinase 1δ/1ε (CKI) by promoting the production of specific alternative transcripts (Huang, McNeil, & Jackson, 2014). CK1 in turn kinases and regulates the activity of multiple clock proteins such as period, clock and pdp1 (Price, Fan, Keightley, & Means, 2015). While cnidarians have no identified period orthologue, and CK1 acts at the protein level, homologues of both clock and pdp1 (bzip1 and bzip3) are also present in the DEGs in this group along with lark. Lark/rbm4 has also been reported to regulate splicing of mef2 in mammals (Lin, 2015). No major phase shifts in clock gene transcription cycles were observed, although they were common in other groups of genes identified in the GSEA, including “cellular response to stress” (Figure 2).
Figure 2.
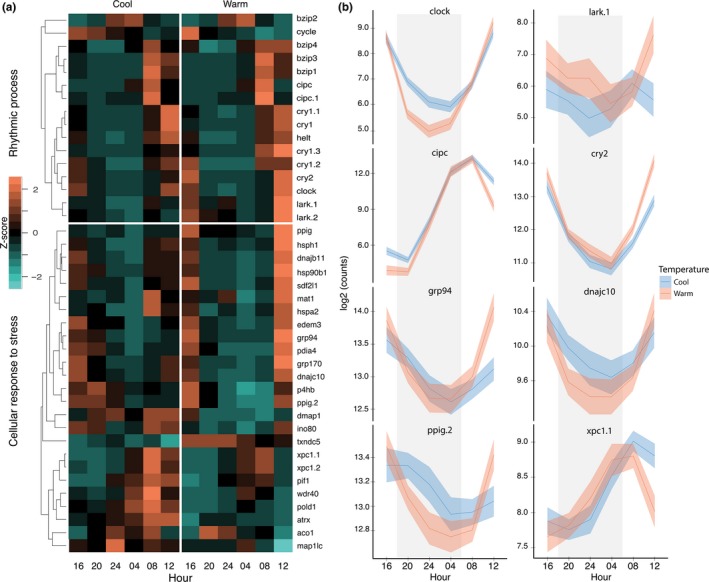
The interaction of temperature and daily rhythms. (a) Heatmaps of differentially expressed genes from the interaction of temperature and hour of the day, which were annotated by the GO terms “Rhythmic process” and “Cellular response to stress.” Gene counts were transformed into row z‐scores and then genes were hierarchically clustered based on Euclidean distance, and this clustering is represented through a dendrogram. (b) Daily expression plots of select genes. Solid lines represent the mean counts (log2), shaded areas (blue and red) are 95% confidence intervals, and grey areas denote nighttime. Hour indicates local clock hour (time of day)
The representation of the “cellular response to stress” genes as the next highest GSEA signature in response to temperature and daily rhythm interactions indicates that these genes undergo complex cycles of transcription under normal conditions, an observation previously made with regard to coral diel cycles (Levy et al., 2011). Our results demonstrate that these diel cycles also interact with changes in temperature in such a way that genes in this group, for example heat shock proteins grp94 (an hsp90) and dnajb11 (an hsp40), change over both time and temperature and represent normal variation in expression. One fascinating aspect of the response of these genes to temperature is that profiles for both of these genes show robust expression peaks at midday and afternoon at summer temperatures, corresponding to the normal time of maximal temperature on the reef (Figure 2). This noon/early afternoon peak is maintained in our stabilized experimental setup with constant temperatures over many weeks, indicating that these genes have been selected to be expressed at highest levels in the time window when the corals are most likely to be exposed to the greatest heat stress (Hofmann & Somero, 1995; Ruiz‐Jones & Palumbi, 2017). These cycles have reduced amplitude at low winter temperatures, coincident with there being a lower likelihood of thermal stress. The majority of stress genes illustrated in Figure 2 show this pattern, although there are exceptions, such as dmap1 which is expressed at its highest levels throughout the daily cycle in cool versus warm conditions, txndc5, which has the opposite pattern, and a group of stress genes peaking in the early morning in cool versus warm conditions (e.g., wdr40 and pold1, Figure 2). The normal and very stable cycles of expression of these genes should be taken into account by studies sampling corals on different dates or at different temperatures, especially studies concerned with the effects of thermal stress.
3.3. The interaction of temperature and lunar rhythms
Just as diel patterns of transcription changed in response to temperature shifts, so do patterns of gene expression associated with the lunar phase. In this case, our analysis found 1,665 genes with significant differences in transcription associated with the interaction between the lunar phase and seasonal temperature (p < .05, FDR < 0.05, Table S1). While biological rhythms were the dominant group of genes that changed in their diel patterns with temperature (Figure 2), the longer‐phase lunar cycle is impacted by temperature very differently. The major effect here is on transcription factors and genes associated with developmental processes (Figure 3), in addition to multiple groups regulating amino acid metabolism (Table S1). A wide range of lunar phase pattern changes occurs with a shift in temperature, from the level of expression, peak phase to the number of phase peaks (Figure 3). Two genes showing dynamic and identical patterns, stat5 and spdef, interact directly in mammalian cells (Park et al., 2007). These genes, along with atrx and elk1, shift from a 2‐week periodicity at low winter temperature to a broader single peak over the first quarter and full moons at the higher summer temperature (Figure 3). A 2‐week periodicity in maxima has been previously described across a lunar cycle (Oldach et al., 2017) and is also visible in the eya gene, a clock gene that has also previously been shown to shift transcription across a lunar cycle in coral (Brady et al., 2016). Eya is also one of the few genes in this set regulating biological rhythms. One additional potential clock gene is the timeless interacting protein, tipin (Figure 4), which has a pattern highly similar to eya.
Figure 3.
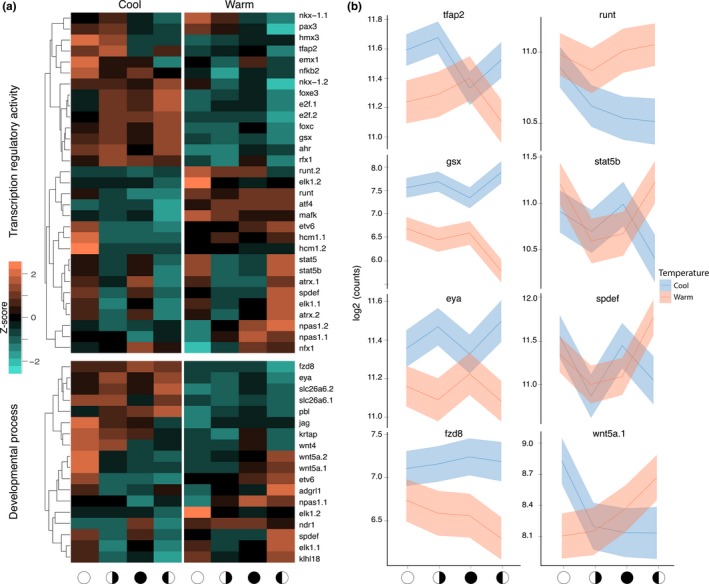
The interaction of temperature and lunar rhythms. (a) Differentially expressed genes from the interaction of temperature and the lunar phase, annotated as “Transcription regulatory activity” and “Developmental process.” Methods were as in Figure 2. (b) Daily expression plots of select genes. Solid lines represent the mean counts and shaded areas (blue and red) are 95% confidence intervals. The x‐axis indicates the lunar phase: open circle indicates a full moon, filled circle is a new moon and half circles represent the appropriate quarter moons
Figure 4.
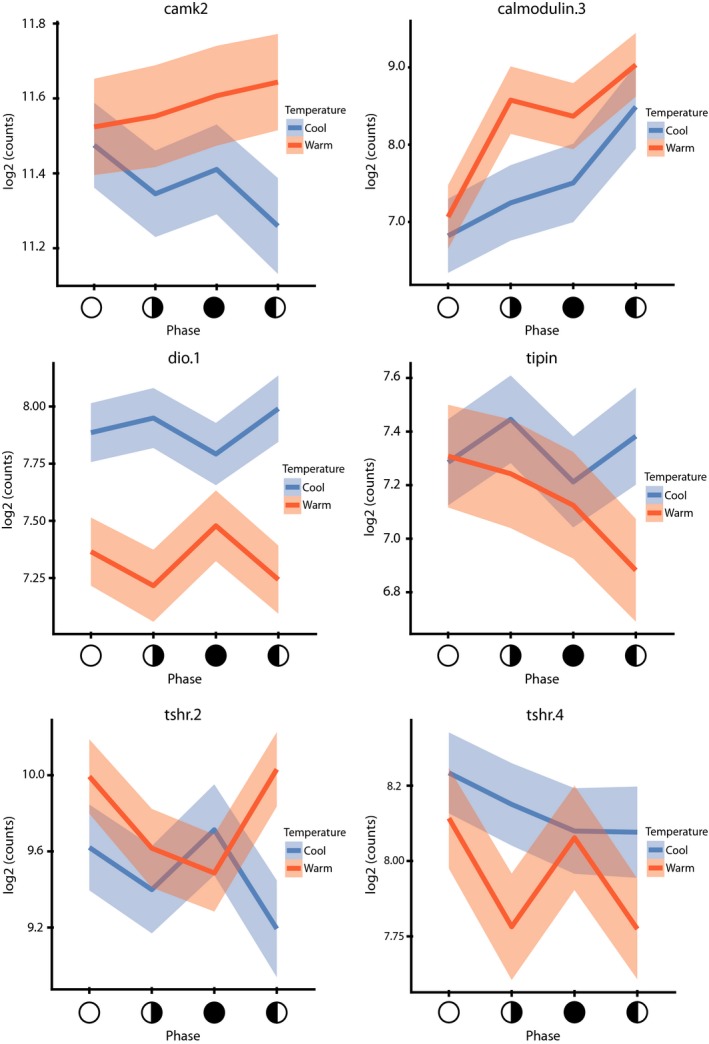
Temperature and lunar phase profiles of camk and thyroid hormone‐associated genes. Methods were as in Figure 2. Solid lines represent the mean counts and shaded areas (blue and red) are 95% confidence intervals. The x‐axis the indicates the lunar phase, and the symbols match those in Figure 3
In addition to the functional groups identified by GSEA, some smaller sets of DEGs have intriguing functions. One such example is a set of seven genes associated with thyroid hormone signalling, including eya (discussed above), deiodinase (dio), thyroid peroxidase and putative thyrotropin/thyroid stimulating hormone receptors (thsr). Of these, dio, eya and thsr.4 display highly similar and unusually dynamic expression profiles (Figure 4). Thyroid hormone plays a core role in seasonal reproductive transitions in a wide range of organisms (Hazlerigg & Loudon, 2008) and seasonal breeding is blocked by thyroidectomy in mammals (Lincoln & Hazlerigg, 2014) but has not previously been implicated in this role in lunar timing systems, other than in seaward migrations and smoltification in salmon (Grau, Dickhoff, Nishioka, Bern, & Folmar, 1981). The differential expression of this gene set in corals in response to temperature and the lunar phase implicates thyroid hormone‐like signalling in reproductive timing in Cnidaria. While steroids and iodinated compounds have been identified in cnidarians (Tarrant, 2005) they remain poorly characterized (Markov et al., 2009), and this finding warrants further research to determine if they play any role in corals. Other interesting genes that shift lunar expression with seasonal temperatures include calmodulin and calmodulin dependant kinase type II (camkII) (Figure 4). The camkII locus was identified as undergoing significant selection between marine midge populations with different lunar emergence times, and camkII splicing patterns are correlated with population emergence timing (Kaiser et al., 2016). We cannot evaluate splicing changes with our methodology and therefore cannot disambiguate changes in expression and splicing at this time, but our results clearly indicate that calmodulin/camkII‐driven processes display differential transcription across temperatures and the lunar phase in corals and that these genes may be broadly utilized in marine invertebrate long‐phase timing systems. The involvement of calcium signalling in corals has been previously been noted (Crowder et al., 2017; Hilton, Brady, Spaho, & Vize, 2012; Kaniewska et al., 2015).
3.4. Interaction between the lunar phase and daily rhythms
There were 1,015 genes that were differentially expressed due to the interactions of the lunar phase and daily rhythms and the majority (80%) of these genes are strikingly different from those discussed above. Furthermore, these genes are largely different from those we expected and predicted in previous publications (Brady et al., 2016; Oldach et al., 2017). The majority of enriched terms identified by a GSEA of interacting genes were associated with post‐transcriptional control, including the terms mRNA processing, RNA processing, mRNA metabolic process and translation (Table 3, for full results see Table S1).
Table 3.
Top gene set enrichment analysis sets responding to interactions between the lunar phase and daily rhythms. All nominal p‐values were <.05
| Gene ontology name | Gene set size | FWER p‐value |
|---|---|---|
| mRNA processing | 20 | .005 |
| RNA processing | 33 | .026 |
| mRNA metabolic process | 23 | .118 |
| Amide metabolic process | 24 | .3 |
| Peptide metabolic process | 24 | .324 |
| Translation | 24 | .331 |
Abbreviation: FWER, family‐wise error rate.
The expression pattern of the top 50 genes showing interactions between the lunar phase and daily rhythms are shown as a heatmap in Figure 5. Groups of genes peak in their daily rhythms of transcription at different lunar phases with the exception of the first quarter moon, which does not have any phase‐specific gene peaks in this subset. Examples of distinct patterns of expression are most clear between the full and new moon (Figure 5). During a 24 hr cycle under a full moon, where there is no real period of darkness, most interacting genes peak (e.g., eif3a, lark.1, rbm25.1) between 12 noon and 4 p.m. During a new moon, some genes display a similar peak while a novel group peaks at 10 p.m. (e.g., furin, npc1), extending to 4 a.m. in the unique case of mef2. In addition to post‐transcriptional regulation, ion transport and a melatonin receptor are noteworthy differentially regulated processes in this group (Table S1).
Figure 5.
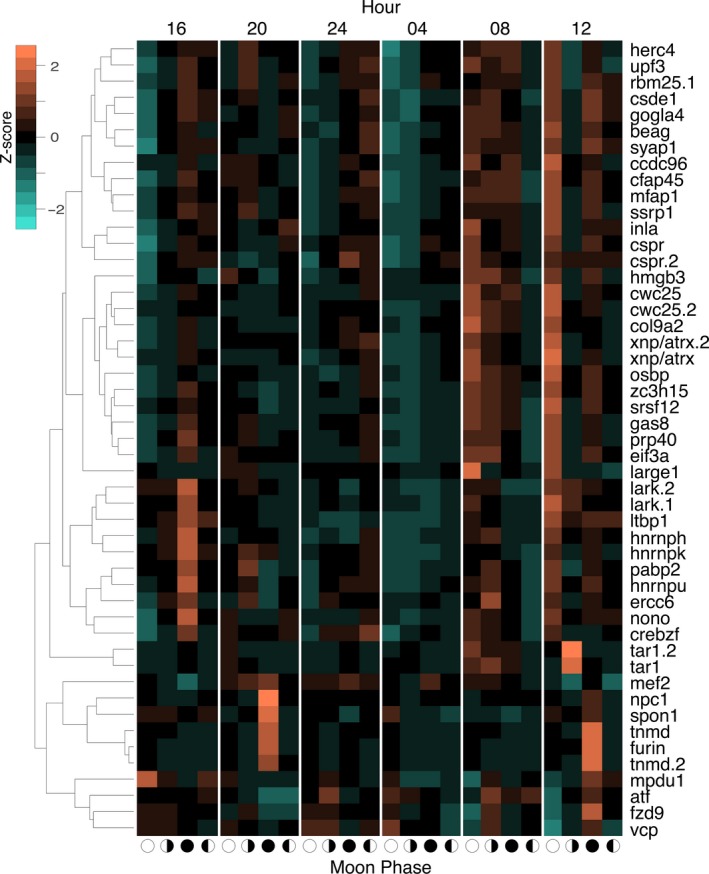
Heatmaps of the top 50 differentially expressed genes from the interaction of phase and hour of the day. Gene counts were transformed into row z‐scores and then genes were hierarchically clustered based on Euclidean distance, and this clustering is represented through a dendrogram. The x‐axis indicates the lunar phase, and the symbols match those in Figure 3
3.5. Interaction of temperature, the lunar phase and daily rhythms
While the pairwise interactions described above typically identified about 1,000 DEGs, as expected genes showing differential expression considering the interactions between all three factors (temperature, the lunar phase and hour of the day) comprised a much smaller group of 32. Selected examples of these are illustrated in Figure 6 and the full set, including unannotated genes, is listed in Table S1. Many of the identified genes had ambiguous annotations, such as tar1, and searching updated databases failed to identify informative functions for many of these genes. The top DEG is mef2 (p = 3.04E‐08), a transcription factor that has been described as acting as a “lynchpin” in transcriptional circuits regulating embryological development (Potthoff & Olson, 2007), and is also known to participate in the control of biological clocks (Blanchard et al., 2010). In Drosophila, the mef2 promoter responds directly to the clock/cycle protein dimer and drives both elements of the clock itself, as well as various clock‐regulated processes such as diel cycles of plasticity in lateroventral neurons (Sivachenko, Li, Abruzzi, & Rosbash, 2013). The expression of a developmental master regulator in response to the interaction of all three variables (seasonal, lunar and daily) is particularly fascinating given the recent proposal that cyclical expression of such genes may control long‐phase circannual rhythms by driving periodic pulses of stem cell differentiation and tissue remodelling (Lincoln & Hazlerigg, 2014). While mef2 has been shown to control diel processes, such as the neuronal remodelling just mentioned, our evidence indicates that it also participates in longer‐period cycles, such as lunar or seasonal.
Figure 6.
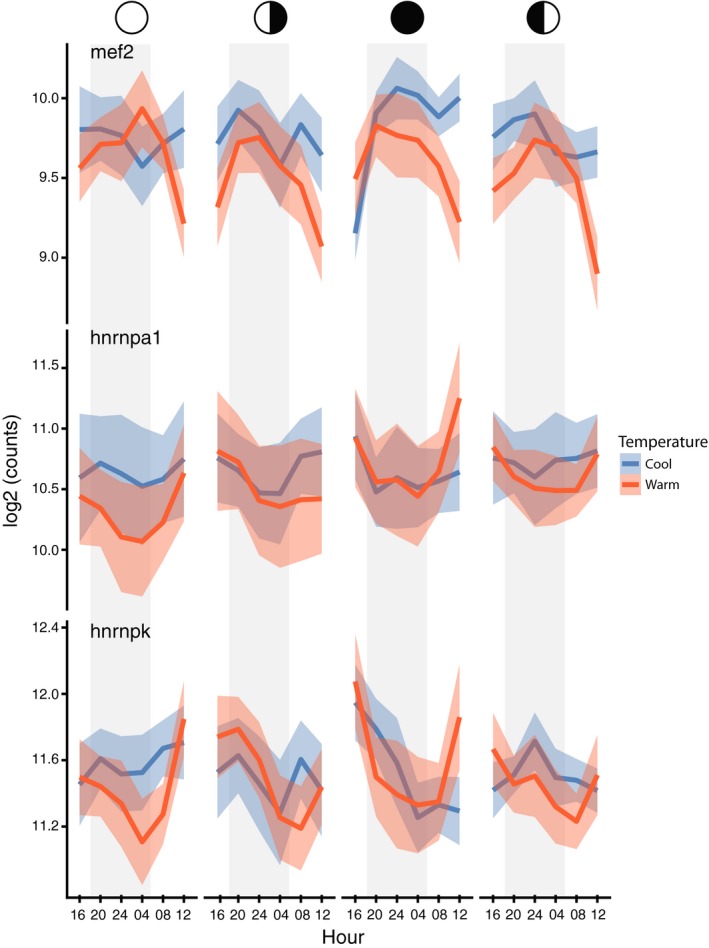
The three‐way interaction between temperature, lunar phase and hour of the day indicates that post‐transcriptional processes and the mef2 gene are key responses. Daily profiles of read counts (log2) for mef2, hnrnpa1 and hnrnpk were all statistically significant under a three‐way interaction between temperature, lunar phase and hour of the day. The open circle indicates a full moon, filled circle new moon and half circles the appropriate quarter moons. Solid lines represent the mean counts and shaded areas (blue and red) are 95% confidence intervals
Other genes that displayed changes of expression in response to all three environmental variables include hnrnpa1 (p = .035), which has been demonstrated to regulate mef2 expression and splicing in mammalian cells and also exerts post‐transcriptional control over multiple biological clock genes such as vrille/Nfil3 (Kim et al., 2017). A second heterogeneous nuclear ribonucleoprotein (hnRNP) responding to all three variables, the hnrnpk gene (p = .006), also regulates splicing and interacts with biological clocks (Nolte & Staiger, 2015). The fact that three genes with closely related clock functions all show differential responses to the interaction of the three environmental variables examined suggests that a core group of genes integrating developmental processes and biological clocks are regulated by a post‐transcriptional mechanism. The transcriptional profiles of both hnrnpa1 and hnrnpk can be observed to be approximately in antiphase to the expression of mef2, and also differ in lunar/temperature responsivity; both hnrnpa1 and hnrnpk show the greatest temperature differences at the full moon phase, while mef2 shows the greatest difference at the new moon (Figure 6). Interestingly, post‐transcriptional control in a long‐range rhythm has been described for calmodulin kinase 2 (camkII), which has been associated with changes in lunar emergence timing in a marine midge (Kaiser et al., 2016), Clunio marinus, and this mechanism may be broadly utilized in long‐range timing systems. Post‐transcriptional processes were also the dominant response to lunar phase/hour of the day interactions discussed above (Figure 5; Table 3). Other genes responding to these environmental variables also involved in regulating developmental processes include a third slicing regulator srsf4, the global epigenetic regulator p300/histone acetylase and the peptidase furin (Table S1).
3.6. Dynamic data visualization
In addition to the results displayed in the Figures 2, 3, 4, 5, 6 and Table S1, the complete set of these results can be visualized via a novel web tool. The http://coraltime.org system searches the read‐count table of the entire data set and displays results on a graph with the clock time on the x‐axis and the level of expression on the y‐axis (Figure S3). Checkboxes allow data from different lunar phases or temperatures to be added or removed as desired. This system allows researchers exploring different biological questions to interrogate our results without the need for bioinformatic analyses of the raw data.
4. DISCUSSION
Thousands of genes change their level of expression in A. millepora in response to seasonal temperatures, the lunar phase and hour of the day (Figure 1; Table S1). Interactions between these variables, identified by changes in transcription in response to two of these factors, change over 1,000 genes in all two‐way combinations tested. Given that so little is known about how long‐phase rhythms are regulated, the scale of this response is remarkable. Post‐transcriptional regulators were members of both temperature/phase/hour and temperature/hour data sets and predominated phase/hour interactions. We propose that post‐transcriptional control may be a major theme in the regulation of rhythmic processes in coral, including long‐phase seasonal and lunar cycles. An example of post‐transcriptionally driven patterns of camkII activity over a lunar month has been reported (Kaiser et al., 2016) and camkII is also differentially expressed in our results (Figure 4), indicating this kinase may be a broadly used factor in long‐phase timing systems. The fact that our top DEG showing interactions in expression to all three variables (mef2) is itself known to be regulated by another top gene (hnrnpa1, expressed in antiphase to mef2) indicates our strongest response identified by RNA‐sequencing may be due to a post‐transcriptional rather than transcriptional mechanism. Our results also demonstrate that circadian processes, visualized through transcription of biological clock‐associated genes, undergo large‐scale changes in response to seasonal temperature, also potentially due to post‐transcriptional control through lark/rbm4.
Differential expression of genes associated with the cellular response to stress are often found in coral studies modelling climate change or temperature flux in coral (e.g., Barshis et al., 2013). We demonstrate that many stress genes undergo complex cycles of transcription under stabilized conditions over the 46 days of our experiment. Such stress gene cycles that persist over a few days were noted by Levy et al. (2011), who also found that these genes continue to be expressed under constant darkness for 48 hr. Our results show that these stable patterns change with seasonal temperature, and this finding has two key implications. First, heat stress expression profiles are tuned over time to match average local environmental parameters. These cycles are matched to prevailing temperature peaks and are dampened at lower temperatures when the response is less likely to be crucial. This hard‐wired expression is in contrast to the “frontloading” hypothesis (Barshis et al., 2013) that proposes prior stress directly primes for subsequent stress events, as opposed to genetically selected and programmed cycles of stress gene expression such as we observe. Our results fit well with the genetic background adaptation to heat stress described by Dixon et al. (2015) and first hypothesized by Hofmann and Somero (1995). Second, studies comparing gene expression in coral at multiple time points (e.g., heat stress associated with climate change or reproductive event assessment) need to take normal long‐range cycles of expression into account before concluding that changes in expression are the result of a particular variable. One limitation of our study comes from a lack of replicate treatment aquaria. Considerable efforts were taken to mitigate confounds between experimental aquaria, and both set‐ups received continuous water supply from the same source and had identical lighting. While we are confident that the differences between treatments are in all likelihood from temperature, tank effects may have occurred and replicate aquaria should be used to verify these results in future experiments.
Finally, genes controlling developmental programmes are represented in the top genes of both temperature/phase/hour and temperature/phase interactions. As each of our samples was the tip of a coral branch (Figure 1), it included an axial polyp and around 100 radial polyps. The axial polyp has higher levels of gene expression associated with developmental processes, such as the wnt, notch and bmp pathways (Hemond, Kaluziak, & Vollmer, 2014), but only makes up around 1% of each sample. If axial tip growth and division varied between temperatures, over a lunar month, and over a 24‐hr day, then this percentage could vary and potentially impact our results. Arguing against this possibility is the lack of evidence that tip growth rates cycle across a lunar month, which is where we find the strongest developmental gene signature. If the vast bulk of sampled radial polyps were utilizing developmental genes to respond to environmental signals, this would better explain our results and seems much more likely. Developmental genes also participate in waves of histogenesis from stem cell reservoirs, as have been proposed to control long phase clocks and can be observed in both mammals and birds (Lincoln & Hazlerigg, 2014). The large sets of developmental genes that vary in their expression between seasonal temperatures, across a lunar month, and over a day provides strong support for cyclical waves of ontogeny over multiple time scales in a reef‐building coral. In addition to identifying novel transcription associated with multiple environmental variables, our results show that even in a stabilized system, the transcriptome is extraordinarily dynamic. Exploring this dynamism will be essential to truly understand not just timing systems but how corals interpret their environment in the natural world.
AUTHOR CONTRIBUTIONS
D.M.W. designed and conducted fieldwork, performed bioinformatics and co‐authored the manuscript. D.W., T.J.P. and K.K. built the coraltime system for data visualization. S.W. and P.D.V. designed and supervised fieldwork and provided logistics. P.D.V. wrote the manuscript and designed and participated in bioinformatics and data analyses. All authors reviewed and approved the final manuscript.
Supporting information
ACKNOWLEDGEMENTS
We thank the Heron Island Research Station staff for support and logistics, Praneet Chaturvedi, Vaneet Lotay and Ying Wang for data wrangling, Phil Langill for spectral analysis, and Sara Smith Wuitchik and Julia Vize for fieldwork assistance. This work was supported by an NSERC Discovery Award to P.D.V.
Wuitchik DM, Wang D, Pells TJ, Karimi K, Ward S, Vize PD. Seasonal temperature, the lunar cycle and diurnal rhythms interact in a combinatorial manner to modulate genomic responses to the environment in a reef‐building coral. Mol Ecol. 2019;28:3629–3641. 10.1111/mec.15173
DATA AVAILABILITY STATEMENT
All sequences are available from the NCBI SRA under accession SRP148286. The target transcriptome and a normalized read‐count table is available in Dryad (https://doi.org/10.5061/dryad.g40g7k0) and all other data are provided as Table S1. The coraltime web tool Javascript code is available upon request.
REFERENCES
- Altschul, S. , Gish, W. , Miller, W. , Myers, E. , & Lipman, D. (1990). Basic local alignment search tool. Journal of Molecular Biology, 215, 403–410. 10.1016/S0022-2836(05)80360-2 [DOI] [PubMed] [Google Scholar]
- Andrews, S. (2010). FastQC: A quality control tool for high throughput sequence data. Available online at http://www.bioinformatics.babraham.ac.uk/projects/fastqc [Google Scholar]
- Babcock, R. C. , Bull, G. D. , Harrison, P. I. , Heyward, A. J. , Oliver, J. K. , Wallace, C. C. , & Willis, B. L. (1986). Synchronous spawnings of 105 scleractinian corals species on the Great Barrier Reef. Marine Biology, 90, 379–394. [Google Scholar]
- Barshis, D. J. , Ladner, J. T. , Oliver, T. A. , Seneca, F. O. , Traylor‐Knowles, N. , & Palumbi, S. R. (2013). Genomic basis for coral resilience to climate change. Proceedings of the National Academy of Sciences of the USA, 110, 1387–1392. 10.1073/pnas.1210224110 [DOI] [PMC free article] [PubMed] [Google Scholar]
- Benjamini, Y. , & Hochberg, Y. (1995). Controlling the false discovery rate: A practical and powerful approach to multiple testing. Journal of the Royal Statistacal Society. Series B, 57, 289–300. [Google Scholar]
- Blanchard, F. J. , Collins, B. , Cyran, S. A. , Hancock, D. H. , Taylor, M. V. , & Blau, J. (2010). The transcription factor Mef2 is required for normal circadian behavior in Drosophila. Journal of Neuroscience, 30, 5855–5865. 10.1523/JNEUROSCI.2688-09.2010 [DOI] [PMC free article] [PubMed] [Google Scholar]
- Boch, C. , Ananthasubramaniam, B. , Sweeney, A. M. , Doyle, F. J. , & Morse, D. E. (2011). Effects of light dynamics on coral spawning synchrony. The Biological Bulletin, 220(3), 161–173. 10.1086/BBLv220n3p161 [DOI] [PubMed] [Google Scholar]
- Brady, A. K. , Hilton, J. D. , & Vize, P. D. (2009). Coral spawn timing is a direct response to solar light cycles and is not an entrained circadian response. Coral Reefs, 28, 677–680. 10.1007/s00338-009-0498-4 [DOI] [Google Scholar]
- Brady, A. K. , Willis, B. L. , Harder, L. D. , & Vize, P. D. (2016). Lunar phase modulates circadian gene expression cycles in the broadcast spawning coral Acropora millepora . Biological Bulletin, 230, 130–142. [DOI] [PubMed] [Google Scholar]
- Conesa, A. , Götz, S. , García‐gómez, J. M. , Terol, J. , Talón, M. , & Robles, M. (2005). Blast2GO: A universal tool for annotation, visualization and analysis in functional genomics research. Bioinformatics Applications Note, 21, 3674–3676. [DOI] [PubMed] [Google Scholar]
- Connor, K. M. , & Gracey, A. Y. (2011). Circadian cycles are the dominant transcriptional rhythm in the intertidal mussel Mytilus californianus . Proceedings of the National Academy of Sciences of the USA, 108, 16110–16115. 10.1073/pnas.1111076108 [DOI] [PMC free article] [PubMed] [Google Scholar]
- Crowder, C. M. , Meyer, E. , Fan, T.‐Y. , & Weis, V. M. (2017). Impacts of temperature and lunar day on gene expression profiles during a monthly reproductive cycle in the brooding coral. Molecular Ecology, 26(15), 3913–3925. [DOI] [PubMed] [Google Scholar]
- Dijk, D. J. , & Czeisler, C. A. (1995). Contribution of the circadian pacemaker and the sleep homeostat to sleep propensity, sleep structure, electroencephalographic slow waves, and sleep spindle activity in humans. The Journal of Neuroscience, 15, 3526–3538. 10.1523/JNEUROSCI.15-05-03526.1995 [DOI] [PMC free article] [PubMed] [Google Scholar]
- Dixon, G. B. , Davies, S. W. , Aglyamova, G. V. , Meyer, E. , Bay, L. K. , & Matz, M. V. (2015). Genomic determinants of coral heat tolerance across latitudes. Science, 348, 1460–1462. 10.1126/science.1261224 [DOI] [PubMed] [Google Scholar]
- Dunlap, J. C. (1999). Molecular bases for circadian clocks. Cell, 96, 271–290. 10.1016/S0092-8674(00)80566-8 [DOI] [PubMed] [Google Scholar]
- Dunlap, J. , & Loros, J. (2016). Making time: Conservation of biological clocks from fungi to animals. Microbiology Spectrum, 5, 773–779. [DOI] [PMC free article] [PubMed] [Google Scholar]
- Gilmour, J. , Speed, C. W. , & Babcock, R. (2016). Coral reproduction in Western Australia. PeerJ, 4, e2010 10.7717/peerj.2010 [DOI] [PMC free article] [PubMed] [Google Scholar]
- Grau, E. G. , Dickhoff, W. W. , Nishioka, R. S. , Bern, H. A. , & Folmar, L. C. (1981). Lunar phasing of the thyroxine surge preparatory to seaward migration of salmonid fish. Science, 211, 607–609. 10.1126/science.7455703 [DOI] [PubMed] [Google Scholar]
- Hazlerigg, D. , & Loudon, A. (2008). New insights into ancient seasonal life timers. Current Biology, 18, 795–804. 10.1016/j.cub.2008.07.040 [DOI] [PubMed] [Google Scholar]
- Hemond, E. M. , Kaluziak, S. T. , & Vollmer, S. V. (2014). The genetics of colony form and function in Caribbean Acropora corals. BMC Genomics, 15, 1–21. 10.1186/1471-2164-15-1133 [DOI] [PMC free article] [PubMed] [Google Scholar]
- Hilton, J. D. , Brady, A. K. , Spaho, S. A. , & Vize, P. D. (2012). Photoreception and signal transduction in corals: Proteomic and behavioral evidence for cytoplasmic calcium as a mediator of light responsivity. Biological Bulletin, 223, 291–299. 10.1086/BBLv223n3p291 [DOI] [PubMed] [Google Scholar]
- Hoadley, K. D. , Szmant, A. M. , & Pyott, S. J. (2011). Circadian clock gene expression in the coral favia fragum over diel and lunar reproductive cycles. PLoS ONE, 6, e19755 10.1371/journal.pone.0019755 [DOI] [PMC free article] [PubMed] [Google Scholar]
- Hofmann, G. E. , & Somero, G. N. (1995). Evidence for protein damage at environmental temperatures: Seasonal changes in levels of ubiquitin conjugates and hsp70 in the intertidal mussel Mytilus trossulus . Journal of Experimental Biology, 198, 1509–1518. [DOI] [PubMed] [Google Scholar]
- Huang, Y. , McNeil, G. P. , & Jackson, F. R. (2014). Translational regulation of the DOUBLETIME/CKIδ/ε kinase by LARK contributes to circadian period modulation. PLoS Genetics, 10, 1–13. 10.1371/journal.pgen.1004536 [DOI] [PMC free article] [PubMed] [Google Scholar]
- Kaiser, T. S. , Poehn, B. , Szkiba, D. , Preussner, M. , Sedlazeck, F. J. , Zrim, A. , … Tessmar‐Raible, K. (2016). The genomic basis of circadian and circalunar timing adaptations in a midge. Nature, 540, 69–73. 10.1038/nature20151 [DOI] [PMC free article] [PubMed] [Google Scholar]
- Kaneko, H. , Head, L. M. , Ling, J. , Tang, X. , Liu, Y. , Hardin, P. E. , … Hamada, F. N. (2013). Circadian rhythm of temperature preference and its neural control in Drosophila. Current Biology, 22, 1851–1857. 10.1016/j.cub.2012.08.006 [DOI] [PMC free article] [PubMed] [Google Scholar]
- Kaniewska, P. , Alon, S. , Karako‐Lampert, S. , Hoegh‐Guldberg, O. , & Levy, O. (2015). Signaling cascades and the importance of moonlight in coral broadcast mass spawning. eLife, 4, 1–14. [DOI] [PMC free article] [PubMed] [Google Scholar]
- Keith, S. A. , Maynard, J. A. , Edwards, A. J. , Guest, J. R. , Bauman, A. G. , van Hooidonk, R. , … Baird, A. H. (2016). Coral mass spawning predicted by rapid seasonal rise in ocean temperature. Proceedings of the Royal Society B: Biological Sciences, 283, 20160011 10.1098/rspb.2016.0011 [DOI] [PMC free article] [PubMed] [Google Scholar]
- Kim, H.‐J. , Lee, H.‐R. , Seo, J.‐Y. , Ryu, H. G. , Lee, K.‐H. , Kim, D.‐Y. , & Kim, K.‐T. (2017). Heterogeneous nuclear ribonucleoprotein A1 regulates rhythmic synthesis of mouse Nfil3 protein via IRES‐mediated translation. Scientific Reports, 7, 1–15. 10.1038/srep42882 [DOI] [PMC free article] [PubMed] [Google Scholar]
- Langmead, B. , & Salzberg, S. L. (2012). Fast gapped‐read alignment with Bowtie 2. Nature Methods, 9, 357–359. 10.1038/nmeth.1923 [DOI] [PMC free article] [PubMed] [Google Scholar]
- Levy, O. , Kaniewska, P. , Alon, S. , Eisenberg, E. , Karako‐Lampert, S. , Bay, L. K. , … Hoegh‐Guldberg, O. (2011). Complex diel cycles of gene expression in coral‐algal symbiosis. Science, 331, 175 10.1126/science.1196419 [DOI] [PubMed] [Google Scholar]
- Li, B. , & Dewey, C. N. (2011). RSEM : Accurate transcript quantification from RNA‐Seq data with or without a reference genome. BMC Bioinformatics, 12, 323. [DOI] [PMC free article] [PubMed] [Google Scholar]
- Lin, J. C. (2015). RBM4‐MEF2C network constitutes a feed‐forward circuit that facilitates the differentiation of brown adipocytes. RNA Biology, 12, 208–220. 10.1080/15476286.2015.1017213 [DOI] [PMC free article] [PubMed] [Google Scholar]
- Lincoln, G. , & Hazlerigg, D. (2014). Stem cell regulation of circannual rhythms In Numata H., & Helm B. (Eds.), Annual, lunar, and tidal clocks: Patterns and mechanisms of nature's enigmatic rhythms (pp. 227–245). Tokyo, Japan: Springer Japan. [Google Scholar]
- Love, M. I. , Huber, W. , & Anders, S. (2014). Moderated estimation of fold change and dispersion for RNA‐Seq data with DESeq2. Genome Biology, 15, 550 10.1186/s13059-014-0550-8 [DOI] [PMC free article] [PubMed] [Google Scholar]
- Mallis, M. M. , & DeRoshia, C. W. (2005). Circadian rhythms, sleep, and performance in space. Aviation, Space and Environmental Medicine, 76, 94–107. [PubMed] [Google Scholar]
- Markov, G. V. , Tavares, R. , Dauphin‐Villemant, C. , Demeneix, B. A. , Baker, M. E. , & Laudet, V. (2009). Independent elaboration of steroid hormone signaling pathways in metazoans. Proceedings of the National Academy of Sciences of the USA, 106, 11913–11918. 10.1073/pnas.0812138106 [DOI] [PMC free article] [PubMed] [Google Scholar]
- Mercier, A. , & Hamel, J. F. (2009). Endogenous and exogenous control of gametogenesis and spawning in echinoderms. Advances in Marine Biology, 55, 1–291. https://europepmc.org/abstract/med/195 [DOI] [PubMed] [Google Scholar]
- Moya, A. , Huisman, L. , Ball, E. E. , Hayward, D. C. , Grasso, L. C. , Chua, C. M. , … Miller, D. J. (2012). Whole transcriptome analysis of the coral Acropora millepora reveals complex responses to CO2‐driven acidification during the initiation of calcification. Molecular Ecology, 21, 2440–2454. [DOI] [PubMed] [Google Scholar]
- Nolte, C. , & Staiger, D. (2015). RNA around the clock – Regulation at the RNA level in biological timing. Frontiers in Plant Science, 06, 1–15. 10.3389/fpls.2015.00311 [DOI] [PMC free article] [PubMed] [Google Scholar]
- Oldach, M. , Workentine, M. , Matz, M. V. , Fan, T.‐Y. , & Vize, P. D. (2017). Transcriptome dynamics over a lunar month in a broadcast spawning Acroporid coral. Molecular Ecology, 38, 42–49. 10.1111/mec.14043 [DOI] [PubMed] [Google Scholar]
- Park, K.‐S. , Korfhagen, T. R. , Bruno, M. D. , Kitzmiller, J. A. , Wan, H. , Wert, S. E. , … Whitsett, J. A. (2007). SPDEF regulates goblet cell hyperplasia in the airway epithelium. Journal of Clinical Investigation, 117, 978–988. 10.1172/JCI29176 [DOI] [PMC free article] [PubMed] [Google Scholar]
- Potthoff, M. J. , & Olson, E. N. (2007). MEF2: A central regulator of diverse developmental programs. Development, 134, 4131–4140. 10.1242/dev.008367 [DOI] [PubMed] [Google Scholar]
- Price, J. L. , Fan, J. Y. , Keightley, A. , & Means, J. C. (2015). The role of casein kinase I in the Drosophila circadian clock. Methods in Enzymology, 551, 175–195. [DOI] [PubMed] [Google Scholar]
- Raible, F. , Takekata, H. , & Tessmar‐Raible, K. (2017). An overview of monthly rhythms and clocks. Frontiers in Neurology, 8, 1–14. 10.3389/fneur.2017.00189 [DOI] [PMC free article] [PubMed] [Google Scholar]
- Reitzel, A. M. , Tarrant, A. M. , & Levy, O. (2013). Circadian clocks in the cnidaria: Environmental entrainment, molecular regulation, and organismal outputs. Integrative and Comparative Biology, 53, 118–130. 10.1093/icb/ict024 [DOI] [PMC free article] [PubMed] [Google Scholar]
- Ruiz‐Jones, L. J. , & Palumbi, S. R. (2017). Tidal heat pulses on a reef trigger a fine‐tuned transcriptional response in corals to maintain homeostasis. Science Advances, 3, 1–10. 10.1126/sciadv.1601298 [DOI] [PMC free article] [PubMed] [Google Scholar]
- Sáenz De Miera, C. , Monecke, S. , Bartzen‐Sprauer, J. , Laran‐Chich, M.‐P. , Pévet, P. , Hazlerigg, D. G. , & Simonneaux, V. (2014). A circannual clock drives expression of genes central for seasonal reproduction. Current Biology, 24, 1500–1506. 10.1016/j.cub.2014.05.024 [DOI] [PubMed] [Google Scholar]
- Sivachenko, A. , Li, Y. , Abruzzi, K. C. , & Rosbash, M. (2013). The transcription factor Mef2 links the Drosophila core clock to Fas2, neuronal morphology, and circadian behavior. Neuron, 79, 281–292. 10.1016/j.neuron.2013.05.015 [DOI] [PMC free article] [PubMed] [Google Scholar]
- Takeda, N. , Kon, Y. , Quiroga Artigas, G. , Lapébie, P. , Barreau, C. , Koizumi, O. , … Deguchi, R. (2018). Identification of jellyfish neuropeptides that act directly as oocyte maturation‐inducing hormones. Development, 145, 1–10. 10.1242/dev.156786 [DOI] [PubMed] [Google Scholar]
- Tarrant, A. M. (2005). Endocrine‐like signaling in cnidarians: Current understanding and implications. Integrative and Comparative Biology, 45, 201–214. [DOI] [PubMed] [Google Scholar]
- Thorndyke, M. , & Goldsworthy, G. (1988). Neurohormones in invertebrates. Cambridge, UK and New York, NY: Cambridge University Press. [Google Scholar]
- Warnes, G. , Bolker, B. , Bonebakker, L. , Gentleman, R. , Liaw, W. H. A. , Lumley, T. , … Venables, B. (2019). gplots: Various R programming tools for plotting data. https://cran.r-project.org/package=gplots [Google Scholar]
- Wickham, H. (2016). ggplot2: Elegant graphics for data analysis. New York, NY: Springer‐Verlag. [Google Scholar]
- Wolstenholme, J. , Nozawa, Y. , Byrne, M. , & Burke, W. (2018). Timing of mass spawning in corals: Potential influence of the coincidence of lunar factors and associated changes in atmospheric pressure from northern and southern hemisphere case studies. Invertebrate Reproduction & Development, 4259, 1–11. 10.1080/07924259.2018.1434245 [DOI] [Google Scholar]
Associated Data
This section collects any data citations, data availability statements, or supplementary materials included in this article.
Supplementary Materials
Data Availability Statement
All sequences are available from the NCBI SRA under accession SRP148286. The target transcriptome and a normalized read‐count table is available in Dryad (https://doi.org/10.5061/dryad.g40g7k0) and all other data are provided as Table S1. The coraltime web tool Javascript code is available upon request.