

Abstract
Background and purpose
Whether the neuromelanin‐positive substantia nigra pars compacta area (NM‐SNc) on neuromelanin magnetic resonance imaging (NM‐MRI) and the specific binding ratio (SBR) on 123I‐N‐v‐fluoropropyl‐2b‐carbomethoxy3b‐(4‐iodophenyl)nortropane single photon emission computed tomography (DaT‐SPECT) can be correlated with motor fluctuations (MFs) in advanced Parkinson's disease (PD) was investigated.
Methods
Thirty‐five PD patients (60 ± 13 years) and 23 healthy individuals as controls (59 ± 19 years) were enrolled. The relationships between NM‐MRI and DaT‐SPECT were prospectively examined in two subgroups divided according to the presence or absence of MFs. Multivariate analysis was performed using the Cox proportional hazard model to screen for association factors.
Results
The NM‐SNc size was correlated with the SBR (Spearman's ρ = 0.43, P < 0.05). The NM‐SNc size was significantly reduced in PD with MFs compared with the subgroup without (P < 0.001), whereas the SBR did not significantly differ between the groups. NM‐SNc size was a significant association factor for MFs (hazard ratio 0.94, P = 0.04). In receiver operating characteristic analysis of the factors for MF occurrence, the area under the receiver operating characteristic curve of the NM‐SNc size showed a significant difference of 0.89 (P < 0.05) but no significant difference was found in the SBR.
Conclusions
NM‐SNc size was significantly correlated with the SBR in PD, but several factors in advanced PD were more closely associated with NM‐SNc size than the SBR. NM‐MRI might reflect the status of advanced PD more accurately than DaT‐SPECT. Therefore, NM‐MRI appears to provide a better marker for discriminating advanced PD than DaT‐SPECT.
Keywords: advanced Parkinson's disease, dopamine transporter SPECT, magnetic resonance imaging, motor fluctuations, neuromelanin imaging
INTRODUCTION
Parkinson's disease (PD) is a progressive neurodegenerative disorder involving the loss of dopaminergic cells in the substantia nigra pars compacta (SNc) 1. Disease progression may be associated with a deterioration of motor function and increased anti‐parkinsonian drug dose, resulting in an increased burden of managing PD. Levodopa is the most effective drug for relieving motor disability in PD, but increasing levodopa dosage, a longer levodopa treatment period and lower age at onset of PD are related to motor fluctuations (MFs), including levodopa‐induced dyskinesia (LID) and wearing off 2, 3, 4. Thus, the occurrence of MFs in PD is associated with disease progression. Additionally, MFs are usually associated with worsening quality of life 5. Therefore, monitoring the progression of nigrostriatal neuronal degeneration is useful in the management of PD. Recent developments in imaging techniques have enabled detection of the progression of nigrostriatal neuronal degeneration. 123I‐N‐v‐fluoropropyl‐2b‐carbomethoxy 3b‐(4‐iodophenyl)nortropane (123I‐FP‐CIT) labeled dopamine transporters (DaTs) may reveal dopaminergic neuronal terminal degeneration by single photon emission computed tomography (DaT‐SPECT). It was previously reported that DaT‐SPECT can be used to assess dopaminergic terminal function, which may be related to the improvement of motor symptoms after levodopa administration 6.
Specific fast spin‐echo T1‐weighted magnetic resonance imaging (MRI) at 3 Tesla (neuromelanin MRI; NM‐MRI) can detect neuromelanin in dopaminergic neurons in the SNc 7, 8, 9, 10. Kuya et al. 8 reported a significant correlation between the size of the NM‐positive SNc area (NM‐SNc) on NM‐MRI and the mean putaminal specific binding ratio (SBR) on DaT‐SPECT. Therefore, both neuroimaging tools might be useful for monitoring and evaluating dopaminergic neuronal degeneration.
Recently, it was reported that decreased NM‐SNc size on NM‐MRI correlates with the prevalence of MFs in idiopathic PD and PARK2 disease 9. In addition, Hong et al. 11 reported that lower DaT activity on 18F‐FP‐CIT positron emission tomography (PET) might be a significant predictor of the development of LID. However, it is controversial whether striatal DaT imaging predicts the degeneration of nigral neurons in PD 12. Hence, it remains unclear whether NM‐MRI or DaT‐SPECT is more accurate for monitoring MFs in advanced PD. To answer this question, the correlation between the NM‐SNc by NM‐MRI and the SBR was investigated. Whether clinical features, DaT‐SPECT or NM‐MRI provides the most useful tool for diagnosing MFs in advanced PD was explored.
METHODS
Participants
Participants were 35 PD patients and 23 healthy age‐matched controls (Table 1). Data were prospectively collected between March 2014 and April 2015. All patients with PD met the Movement Disorders Society clinical diagnostic criteria for PD. NM‐MRI data were obtained from all participants. In addition, 23 PD patients underwent both NM‐MRI and DaT‐SPECT (Table 2). This study was approved by the Ethics Committee of Juntendo University Hospital. Written informed consent was obtained from all participants prior to the study. The details of the study population are described in Appendix S1.
Table 1.
Participants’ background
| Variables | All | PD | Control | P |
|---|---|---|---|---|
| n = 58 | n = 35 | n = 23 | ||
| Age (years) | 59 ± 16 | 60 ± 13 | 59 ± 19 | 0.77* |
| Males, no. (%) | 34 (58) | 23 (66) | 11 (48) | 0.28** |
| NM‐SNc (pixels) | 63 (42–101) | 46 (22.3–79.7) | 94.2 (62.1–112) | <0.001* |
| SBRa | – | 2.4 (1.69–3.15) | – | – |
NM‐SNc, neuromelanin‐positive substantia nigra pars compacta area; PD, Parkinson's disease; SBR, specific binding ratio.Data are expressed as mean ± SD, n (%) (age, males); median (interquartile range) (NM‐SNc, SBR). *Mann–Whitney U test; **chi‐squared test; a23 PD patients who had undergone both DaT‐SPECT and NM‐MRI.
Table 2.
Baseline characteristics of the participants
| Variables | PD all (NM‐MRI only) | PD with MFs | PD without MFs | P |
|---|---|---|---|---|
| n = 35 | n = 14, 40% | n = 21, 60% | ||
| Age (years) | 60 ± 13 | 56 ± 11 | 64 ± 13 | NS** |
| Males, no. (%) | 23 (66) | 8 (57) | 15 (71) | NS* |
| Handedness, right (%) | 35 (100) | 14 (100) | 21 (100) | NS* |
| LD (mg) | 413 ± 260 | 574 ± 200 | 308 ± 244 | 0.002** |
| LEDD (mg) | 743 ± 383 | 1046 ± 320 | 540 ± 271 | <0.001** |
| Disease duration (years) | 7.56 ± 4.06 | 10.7 ± 3.21 | 5.57 ± 3.98 | <0.001** |
| H&Y stage | 2.09 ± 1.20 | 2.58 ± 1.13 | 1.80 ± 1.03 | 0.016** |
| UPDRS III | 17.0 ± 11.3 | 25.0 ± 10.8 | 14.0 ± 9.73 | 0.004** |
| NM‐SNc (pixels) | 46 (22.3–79.7) | 20.0 (14.8–36.0) | 65.5 (46.0–100) | <0.0001** |
| Age at onset (years) | 54.1 ± 14.4 | 45.9 ± 10.6 | 59.0 ± 14.2 | 0.004** |
| Variables | PD (DaT‐SPECT and NM‐MRI) | PD with MFs | PD without MFs | P |
|---|---|---|---|---|
| n = 23 | n = 10, 44% | n = 13, 56% | ||
| Age (years) | 61 ± 16 | 55 ± 11 | 66 ± 17 | N.S.** |
| Males, no. (%) | 14 (61) | 4 (40) | 10 (76) | N.S.* |
| Handedness, right (%) | 23 (100) | 10 (100) | 13 (100) | N.S.* |
| LD (mg) | 432 ± 229 | 535 ± 181 | 354 ± 238 | 0.04** |
| LEDD (mg) | 762 ± 329 | 1009 ± 245 | 572 ± 252 | <0.001** |
| Disease duration (years) | 8.39 ± 3.98 | 10.5 ± 2.92 | 6.77 ± 4.02 | 0.02** |
| H&Y stage | 2.13 ± 1.22 | 2.50 ± 1.08 | 1.84 ± 1.28 | NS** |
| UPDRS III | 20.1 ± 12.6 | 26.2 ± 11.5 | 15.3 ± 11.6 | 0.04** |
| NM‐SNc (pixels) | 44 (19.8–61.6) | 19.8 (15.1–35.6) | 54.8 (45.5–91.1) | <0.0001** |
| SBR | 2.4 (1.69–3.15) | 1.98 (1.63–2.52) | 2.84 (1.68–2.52) | NS** |
| Age at onset (years) | 52.6 ± 16.0 | 44.8 ± 9.93 | 58.61 ± 17.5 | 0.02** |
DaT‐SPECT, dopamine transporter single photon emission computed tomography; H&Y stage, Hoehn and Yahr stage; LD, levodopa daily dose; LEDD, levodopa equivalent daily dose; MFs, motor fluctuations; NM‐MRI, neuromelanin magnetic resonance imaging; NM‐SNc, neuromelanin‐positive substantia nigra pars compacta area; PD, Parkinson's disease; SBR, specific binding ratio; UPDRS III, Unified Parkinson's Disease Rating Scale part III.Data are expressed as mean ± SD, n (%) (age, male, handedness, affected side, LD, LEDD, disease duration, H&Y stage, UPDRS III; median (interquartile range) (NM‐SNc, SBR). *Chi‐squared test; **Mann–Whitney U test.
Brain image protocol and analysis
The details of brain MRI protocol, image analysis and covariate assessment are described in Appendix S1.
Statistical analysis
The details of the statistical analysis are described in Appendix S1.
RESULTS
The clinical characteristics of the participants and the NM‐SNc and SBR results are shown in Tables 1 and 2. Hyperintense areas determined by an individual background threshold (+2 SD) in all cases were found to be well distributed in the SNc.
There was no difference between PD patients and controls in the relative variation of background signals, ruling out significant differences in image quality [median relative variation in background signal (interquartile range): PD, 18.2% (17.4%–20.0%); controls, 19.4% (17.1%–20.4%); Mann–Whitney U test, P = 0.59]. The assessment of reproducibility of receiver operating characteristic (ROC) placements based on the SNc pixel counts between independent raters revealed strong agreement (intraclass correlation coefficient 0.94). NM‐MRI results showed a significantly smaller NM‐SNc in patients with PD than in controls (Table 1 and Fig. S1).
The NM‐SNc was significantly correlated with the SBR (ρ = 0.43, P < 0.05; Fig. 1a). Age‐related effects were corrected by age matching between controls and PD patients. The NM‐SNc was significantly correlated with age in the normal group (ρ = 0.541, P < 0.05). A similar age‐related correlation for NM‐related contrast was observed in the PD group (ρ = 0.278, P < 0.05), whereas the SBR was not correlated with age (ρ = 0.069, P = 0.753). Furthermore, the correlation remained in the measurement of both the left and right hemispheres (right ρ = 0.42, P < 0.05; left ρ = 0.49, P < 0.05; Fig. 1b, c). In the advanced PD group, no significant correlation was found between the NM‐SNc and the SBR (ρ = 0.486, P = 0.329; Fig. 1d). This association was weakened further in the presence of severe deterioration of dopaminergic neurons in the affected side. The NM‐SNc and SBR were significantly smaller in the affected side than in the non‐affected side [affected side, 75.0 (43.4–97.5) pixels, non‐affected side, 114 (80.0–138) pixels, P < 0.05; affected side, 2.18 (1.70–3.01), non‐affected side, 2.85 (1.87–3.24), P < 0.05, respectively].
Figure 1.
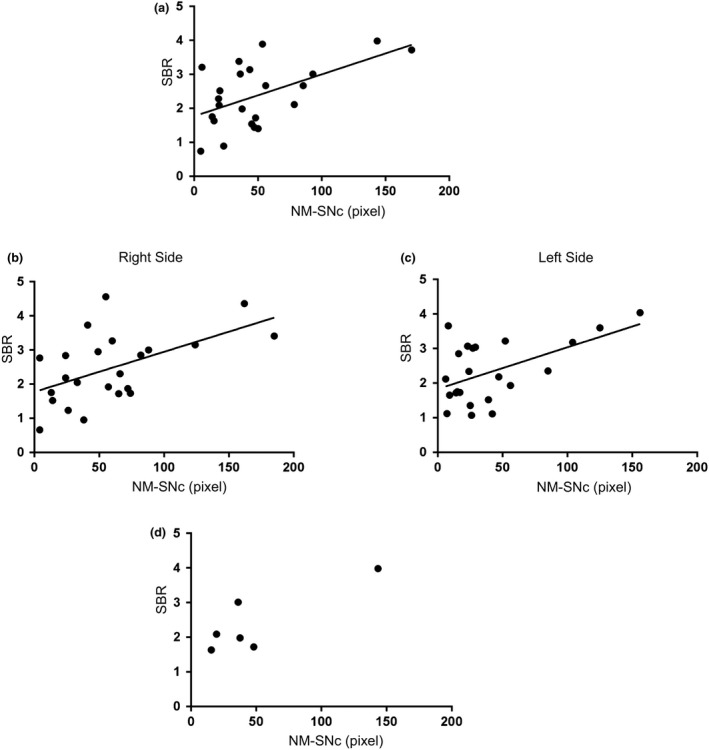
Correlation between SNc area on NM‐MRI and SBR on DaT‐SPECT. (a) In 23 patients with PD, the size of NM‐SNc was associated with SBR on dopamine transporter imaging by DaT‐SPECT. (b), (c) The correlation was confirmed in both the right and left sides in 23 patients with PD. (d) Associations between NM‐SNc (pixel) on NM‐MRI and SBR on DaT‐SPECT of the severe PD group (six patients, Hoehn and Yahr 3 or higher). (a)–(d) Spearman's rank correlation test.
The NM‐SNc was significantly negatively correlated with Unified Parkinson's Disease Rating Scale part III (UPDRS III) scores (ρ = 0.42, P < 0.05; Fig. 2a), disease duration (ρ = −0.35, P < 0.05; Fig. 2b) and levodopa equivalent daily dose (LEDD) (ρ = −0.39, P < 0.05; Fig. 2c) and positively correlated with age at onset (ρ = 0.37, P < 0.05; Fig. 2d) whilst the SBR did not correlate with any (Fig. 2e–h).
Figure 2.
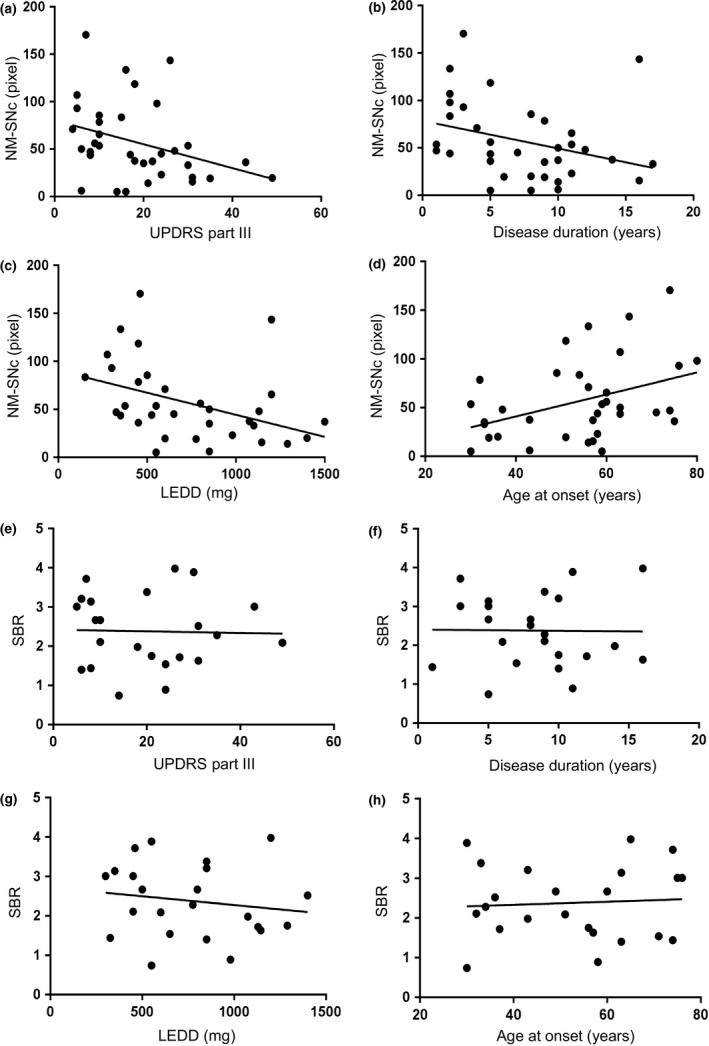
Correlation between the NM‐SNc size or SBR and UPDRS III score, disease duration, LEDD and age at onset. Correlation between the size of the NM‐SNc (pixels) on NM‐MRI or SBR on DaT‐SPECT and UPDRS III score (a), (e), disease duration (b), (f), LEDD (c), (g) and age at onset (d), (h). (a)–(d) In 35 patients with PD, NM‐SNc size was associated with UPDRS III score, with disease duration, with LEDD and with age at onset (e)–(h). (a)–(h) Spearman's rank correlation test.
To investigate the correlation between imaging biomarkers and MFs, the 35 PD patients who underwent NM‐MRI were divided into two groups based on the presence of MFs. This cohort included 21 PD patients without MFs (Table 2). Additionally, the 23 patients who underwent both DaT‐SPECT and NM‐MRI were also divided into two groups based on the presence of MFs: 10 patients with MFs and 13 without (Table 2). The PD with MFs group showed a significantly smaller NM‐SNc compared with the PD without MFs group (Table 2, Fig. 3a, b). In contrast, the SBR did not significantly differ between the PD with and without MFs groups (Table 2, Fig. 3c). Disease duration was longer in the PD with MFs than without MFs group (Table 2). The levodopa daily dose (LD) and LEDD of the PD with MFs group were higher than those of the PD without MFs group (Table 2). UPDRS III scores were significantly different between the two groups (Table 2). Age at PD onset was lower in the PD with MFs than in the PD without MFs group (Table 2).
Figure 3.
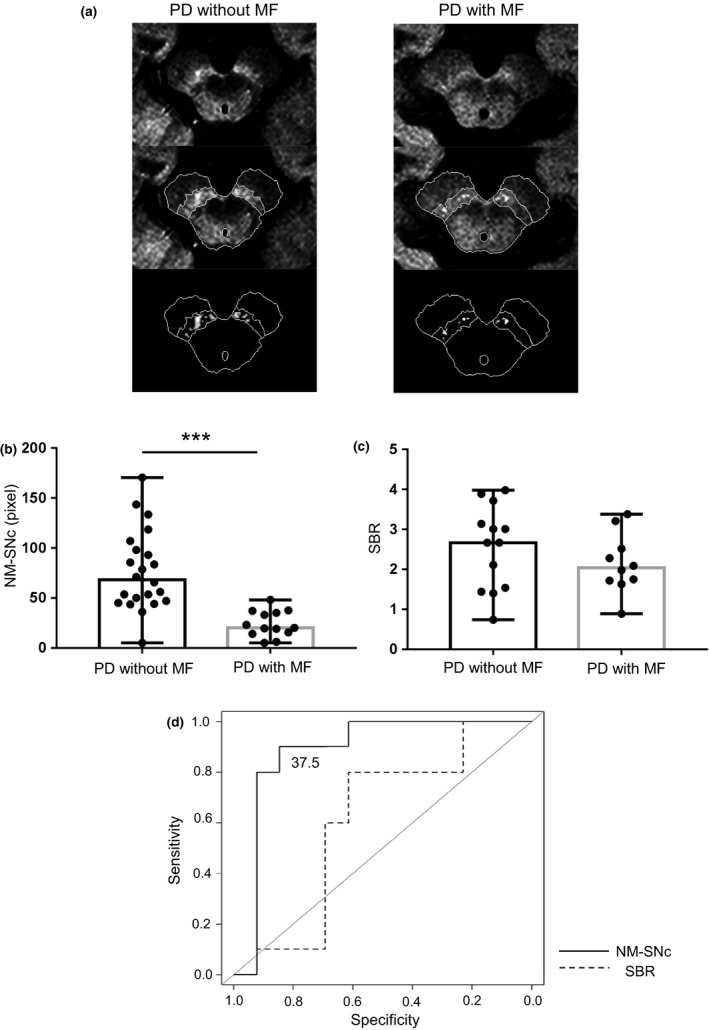
Comparison of NM‐MRI or SBR between groups with and without MFs in PD. The size of the NM‐SNc (pixels) by NM‐MRI was compared between PD patients with MFs (N = 14) and those without MFs (N = 21). (a), (b) SNc area was significantly decreased in PD patients with MFs (Mann–Whitney U tests, PD with versus without MFs, ***P < 0.001). (c) No significant difference in SBR was found between PD patients with and without MFs (Mann–Whitney U tests, not significant). (d) ROC curve analysis was used to examine predictors of MF onset in 23 patients with PD. The AUC of the NM‐SNc size showed a significant difference of 0.89 (P < 0.05) but no significant difference was found in the SBR. The cutoff value was 37.5 (pixels) using the Youden index (sensitivity 0.846, specificity 0.90). Data are expressed as median.
Receiver operating characteristic curves were used to assess the association factors for MF occurrence amongst PD patients. The area under the ROC curve (AUC) of the NM‐SNc showed a significant difference of 0.89 (P < 0.05) but no significant difference was found in the AUC of the SBR (Fig. 3d), indicating that the NM‐SNc might be a marker associated with MFs.
The multivariate Cox regression hazard model revealed that NM‐SNc is a significant association factor for MFs in advanced PD (Table 3).
Table 3.
Summary of the association factors of the time to motor fluctuation occurrence in 23 patients with Parkinson's disease
| Variables | HR | 95% CI | P |
|---|---|---|---|
| NM‐SNc (pixel) | 0.94 | 0.88–0.99 | 0.04 |
| UPDRS III score | 1.07 | 0.97–1.18 | 0.140 |
| SBR (%) | 2.74 | 0.34–21.7 | 0.339 |
| LD (mg) | 1.00 | 0.99–1.01 | 0.176 |
| Female | 5.55 | 0.53–57.5 | 0.151 |
| Age at onset (years) | 0.96 | 0.84–1.09 | 0.510 |
CI, confidence interval; HR, hazard ratio; LD, levodopa daily dose; NM‐SNc, neuromelanin‐positive substantia nigra pars compacta area; SBR, specific binding ratio; UPDRS III, Unified Parkinson's Disease Rating Scale part III.
DISCUSSION
The current results revealed that the NM‐SNc was significantly smaller in PD patients compared with healthy controls and was correlated with the SBR. DaT‐SPECT reflects dopaminergic neuronal axon terminal function in the putamen, whereas NM‐MRI directly visualizes melanin in the SNc. Sasaki et al. 13 reported that the paramagnetic T1 shortening area in NM‐MRI was clearly correlated with NM‐SNc in gross specimens, suggesting that the high signal intensity areas corresponded to NM‐containing neurons 8, 13, 14. Colloby et al. 15 reported that striatal 123I‐FP‐CIT uptake was significantly correlated with the number of NM‐containing neurons in the SNc. Previous neuropathological studies reported an association between the number of surviving NM‐containing neurons and the functional state of those neurons’ axon terminals 16, 17. Therefore, NM‐SNc may predict not only the number of dopaminergic neurons but also the terminal function 8. Furthermore, PD pathology occurs asymmetrically and motor symptoms manifest unilaterally. Here, it is demonstrated that both NM‐SNc and SBR lateralization were correlated with clinical symptoms, similar to a previous report 8. Thus, both imaging biomarkers can predict impairment of the nigrostriatal pathway due to dopaminergic neuronal degeneration.
However, no correlation was found between the NM‐SNc and SBR in the advanced PD group in the current study (Fig. 1d). Investigation of postmortem SNc neuron counts in PD revealed that DaT‐SPECT fails to reflect the precise number of dopaminergic neurons 12. The SBR in PD might be associated with dysfunction of axon terminals rather than degeneration of dopaminergic neurons in the SNc. Reductions in DaT are observed from the early stages of the disease. Therefore, the SBR might decrease more than dopaminergic neuronal degeneration 18, whereas the loss of melanized neurons lags behind the loss of tyrosine‐positive neurons 17. Thus, decreasing melanin reflects the progression of dopaminergic neuronal degeneration. In advanced PD, although the SBR might not be closely related to dopaminergic neuronal degeneration, NM‐MRI can detect the melanized structures, resulting from precisely depicting the progression of dopaminergic neuronal degeneration. In the current study, no correlation was found between the SBR and UPDRS III scores (Fig. 2e), whereas the NM‐SNc was significantly negatively correlated with UPDRS III scores (Fig. 2a). In this context, DaT‐SPECT appears to be more useful for early PD diagnosis, whereas NM‐MRI might be useful for determining dopaminergic neuronal degeneration in advanced PD. The SBR decreased in early PD patients with no correlation with disease duration (Fig. 2f), whereas the NM‐SNc was significantly negatively correlated with disease duration (Fig. 2b).
Common risk factors for MFs, such as younger age of onset and long disease duration 2, 3, 4, 5, were identified in our cohort of patients. NM‐SNc size was correlated with longer disease duration consequent to early age at onset and dopaminergic drug dose, reflecting the status of advanced PD. Therefore, NM‐MRI may be a more accurate marker for discriminating the advanced status of PD than DaT‐SPECT. Cilia et al. 19 investigated a large‐scale cohort of PD patients in Ghana and reported that MFs were associated with a long disease duration and high daily LD, similar to the current results. Previous studies reported that MFs might be correlated with presynaptic changes due to severe degeneration of dopaminergic neurons 11, 20. Presynaptic degeneration may induce abnormal fluctuation of postsynaptic dopaminergic stimulation under levodopa treatment, resulting in MFs 21. Considering the smaller NM‐SNc in PD with MFs than in PD without MFs (Fig. 3a, b), NM‐SNc might be correlated with MFs in advanced PD.
In the current study, however, no significant differences in the SBR between PD patients with and without MFs were found (Fig. 3c). Hong et al. 11 reported that DaT SPECT was a predictive marker of LID. The researchers also found that younger age at onset of PD and higher levodopa dosages were related to the development of LID. Conversely, Roussakis et al. 22 did not find any significant differences using DaT‐SPECT of 123I‐FP‐CIT binding to DaT between PD patients with and without LID. Considering the lack of correlation between striatal DaT binding and postmortem SNc neuron counts 12, the levels of SNc dopaminergic neuronal degeneration might not correlate with decreases in terminal DaT after a certain level of damage has occurred. Thus, DaT‐SPECT might not be as suitable for monitoring MFs in advanced PD as NM‐MRI.
The current study has several limitations that should be considered. First, the number of patients who underwent DaT‐SPECT was smaller than the number who underwent NM‐MRI. This may have affected the results such as the correlations between SBR and UPDRS III score or disease duration and might have led to different results compared with previous studies. Secondly, the PD with MFs group tended to be younger than those without MFs, but this difference was not significant. Younger age at onset of disease is a risk factor for MFs 2, 3, 4, 5; hence our results may have been influenced by participants’ age. However, the model for predictive factors of the time to the occurrence of MFs revealed that NM‐SNc size was the most strongly associated factor (Table 3). Thirdly, the study cohort was relatively small and DaT‐SPECT was not performed on healthy controls. Fourthly, our patients were diagnosed clinically but did not undergo confirmation via autopsy. Fifthly, whilst this study had a cross‐sectional design, longitudinal studies are needed. Our results, however, concur with previous pathological analyses and clinical investigations of the association between MFs and SNc dopaminergic neuronal degeneration in advanced PD 19, 20.
CONCLUSION
Neuromelanin MRI appears to be useful for the assessment of dopaminergic neuron degeneration, whereas DaT‐SPECT might be more useful for predicting dysfunction rather than the degeneration of the nigrostriatal pathway in advanced PD. Importantly, reduction in NM‐SNc correlated with disease progression, suggesting that NM‐MRI is more accurate for monitoring MFs due to degeneration of dopaminergic neurons in advanced PD with longer disease duration consequent to early age at onset. Therefore, NM‐MRI might provide a better marker for discriminating advanced PD compared with DaT‐SPECT.
Supporting information
Figure S1. NM‐MRI of controls and patients with PD.
Appendix S1. Methods
ACKNOWLEDGEMENTS
The authors are grateful to Dr Juan Miguel P. Bautista (Department of Neurology, Juntendo University School of Medicine and St Luke's Medical Center QC, Philippines) for his contributions to the discussion. Benjamin Knight, MSc, from Edanz Group (http://www.edanzediting.com/ac) is thanked for editing a draft of this paper and all participants of this study are also thanked. This study was supported by a Strategic Research Foundation Grant‐in‐Aid for Private Universities, and Grants‐in‐Aid for Scientific Research on Priority Areas (to TH, 16K09675 and NH, 18H04043); by the Brain Mapping by Integrated Neurotechnologies for Disease Studies Project (Brain/MINDS) (to SA and NH); by a Japan Science and Technology Agency grant for the creation of innovative technology for medical applications based on the global analyses and regulation of disease‐related metabolites (to NH); by Japan Agency for Medical Research and Development (AMED) under Grant Number 19ek0109358 and 19ek0109393 (to NH); by Brain/MINDS Beyond program from AMED under Grant Number JP18dm0307024 (to KK); by Grants‐in‐Aid from the Research Committee of CNS Degenerative Disease, Research on Policy Planning and Evaluation for Rare and Intractable Diseases, Health, Labour and Welfare Sciences Research Grants, the Ministry of Health, Labour and Welfare, Japan (to NH).
Contributor Information
T. Hatano, Email: thatano@juntendo.ac.jp.
N. Hattori, Email: nhattori@juntendo.ac.jp.
REFERENCES
- 1. Greenfield JG, Bosanquet FD. The brain‐stem lesions in parkinsonism. J Neurol Neurosurg Psychiatry 1953; 16: 213–226. [DOI] [PMC free article] [PubMed] [Google Scholar]
- 2. Schrag A, Quinn N. Dyskinesias and motor fluctuations in Parkinson's disease. A community‐based study. Brain 2000; 123: 2297–2305. [DOI] [PubMed] [Google Scholar]
- 3. Papapetropoulos S, Argyriou AA, Ellul J, Chroni E. Comparison of motor fluctuations and L‐dopa‐induced dyskinesias in patients with familial and sporadic Parkinson's disease. Eur J Neurol 2004; 11: 115–119. [DOI] [PubMed] [Google Scholar]
- 4. Olanow CW, Kieburtz K, Rascol O, et al Factors predictive of the development of levodopa‐induced dyskinesia and wearing‐off in Parkinson's disease. Mov Disord 2013; 28: 1064–1071. [DOI] [PubMed] [Google Scholar]
- 5. Kalia LV, Lang AE. Parkinson's disease. Lancet 2015; 386: 896–912. [DOI] [PubMed] [Google Scholar]
- 6. Nakajima A, Shimo Y, Sekimoto S, et al Dopamine transporter imaging predicts motor responsiveness to levodopa challenge in patients with Parkinson's disease: a pilot study of DATSCAN for subthalamic deep brain stimulation. J Neurol Sci 2018; 385: 134–139. [DOI] [PubMed] [Google Scholar]
- 7. Enochs WS, Petherick P, Bogdanova A, Mohr U, Weissleder R. Paramagnetic metal scavenging by melanin: MR imaging. Radiology 1997; 204: 417–423. [DOI] [PubMed] [Google Scholar]
- 8. Kuya K, Shinohara Y, Miyoshi F, Fujii S, Tanabe Y, Ogawa T. Correlation between neuromelanin‐sensitive MR imaging and (123)I‐FP‐CIT SPECT in patients with parkinsonism. Neuroradiology 2016; 58: 351–356. [DOI] [PubMed] [Google Scholar]
- 9. Hatano T, Okuzumi A, Kamagata K, et al Neuromelanin MRI is useful for monitoring motor complications in Parkinson's and PARK2 disease. J Neural Transm (Vienna) 2017; 124: 407–415. [DOI] [PubMed] [Google Scholar]
- 10. Taniguchi D, Hatano T, Kamagata K, et al Neuromelanin and midbrain volumetry in progressive supranuclear palsy and Parkinson's disease. Mov Disord 2018; 33: 1488–1492. [DOI] [PubMed] [Google Scholar]
- 11. Hong JY, Oh JS, Lee I, et al Presynaptic dopamine depletion predicts levodopa‐induced dyskinesia in de novo Parkinson disease. Neurology 2014; 82: 1597–1604. [DOI] [PubMed] [Google Scholar]
- 12. Saari L, Kivinen K, Gardberg M, Joutsa J, Noponen T, Kaasinen V. Dopamine transporter imaging does not predict the number of nigral neurons in Parkinson disease. Neurology 2017; 88: 1461–1467. [DOI] [PubMed] [Google Scholar]
- 13. Sasaki M, Shibata E, Tohyama K, et al Neuromelanin magnetic resonance imaging of locus ceruleus and substantia nigra in Parkinson's disease. NeuroReport 2006; 17: 1215–1218. [DOI] [PubMed] [Google Scholar]
- 14. Ohtsuka C, Sasaki M, Konno K, et al Differentiation of early‐stage parkinsonisms using neuromelanin‐sensitive magnetic resonance imaging. Parkinsonism Relat Disord 2014; 20: 755–760. [DOI] [PubMed] [Google Scholar]
- 15. Colloby SJ, McParland S, O'Brien JT, Attems J. Neuropathological correlates of dopaminergic imaging in Alzheimer's disease and Lewy body dementias. Brain 2012; 135: 2798–2808. [DOI] [PubMed] [Google Scholar]
- 16. Hansen AK, Knudsen K, Lillethorup TP, et al In vivo imaging of neuromelanin in Parkinson's disease using 18F‐AV‐1451 PET. Brain 2016; 139: 2039–2049. [DOI] [PubMed] [Google Scholar]
- 17. Kordower JH, Olanow CW, Dodiya HB, et al Disease duration and the integrity of the nigrostriatal system in Parkinson's disease. Brain 2013; 136: 2419–2431. [DOI] [PMC free article] [PubMed] [Google Scholar]
- 18. Schwarz J, Storch A, Koch W, Pogarell O, Radau PE, Tatsch K. Loss of dopamine transporter binding in Parkinson's disease follows a single exponential rather than linear decline. J Nucl Med 2004; 45: 1694–1697. [PubMed] [Google Scholar]
- 19. Cilia R, Akpalu A, Sarfo FS, et al The modern pre‐levodopa era of Parkinson's disease: insights into motor complications from sub‐Saharan Africa. Brain 2014; 137: 2731–2742. [DOI] [PMC free article] [PubMed] [Google Scholar]
- 20. de la Fuente‐Fernandez R, Schulzer M, Mak E, Calne DB, Stoessl AJ. Presynaptic mechanisms of motor fluctuations in Parkinson's disease: a probabilistic model. Brain 2004; 127: 888–899. [DOI] [PubMed] [Google Scholar]
- 21. Olanow CW, Obeso JA, Stocchi F. Continuous dopamine‐receptor treatment of Parkinson's disease: scientific rationale and clinical implications. Lancet Neurol 2006; 5: 677–687. [DOI] [PubMed] [Google Scholar]
- 22. Roussakis AA, Politis M, Towey D, Piccini P. Serotonin‐to‐dopamine transporter ratios in Parkinson disease: relevance for dyskinesias. Neurology 2016; 86: 1152–1158. [DOI] [PubMed] [Google Scholar]
Associated Data
This section collects any data citations, data availability statements, or supplementary materials included in this article.
Supplementary Materials
Figure S1. NM‐MRI of controls and patients with PD.
Appendix S1. Methods