

Abstract
We previously demonstrated that Bmi1 deficiency leads to osteoporosis phenotype by inhibiting the proliferation and osteogenic differentiation of bone marrow mesenchymal stem cells (MSCs), but it is unclear whether overexpression of Bmi1 in MSCs stimulates skeletal development and rescues Bmi1 deficiency‐induced osteoporosis. To answer this question, we constructed transgenic mice (Bmi1Tg) that overexpressed Bmi1 driven by the Prx1 gene and analyzed their skeletal phenotype differences with that of wild‐type littermates. We then hybridized Bmi1Tg to Bmi1−/− mice to generate Bmi1−/− mice overexpressing Bmi1 in MSCs and compared their skeletal phenotypes with those of Bmi1−/− and wild‐type mice using imaging, histopathological, immunohistochemical, histomorphometric, cellular, and molecular methods. Bmi1Tg mice exhibited enhanced bone growth and osteoblast formation, including the augmentation of bone size, cortical and trabecular volume, number of osteoblasts, alkaline phosphatase (ALP)‐positive and type I collagen‐positive areas, number of total colony forming unit fibroblasts (CFU‐f) and ALP+ CFU‐f, and osteogenic gene expression levels. Consistently, MSC overexpressing Bmi1 in the Bmi1−/− background not only largely reversed Bmi1 systemic deficiency‐induced skeletal growth retardation and osteoporosis, but also partially reversed Bmi1 deficiency‐induced systemic growth retardation and premature aging. To further explore the mechanism of action of MSCs overexpressing Bmi1 in antiosteoporosis and antiaging, we examined changes in oxidative stress and expression levels of p16 and p19. Our results showed that overexpression of Bmi1 in MSCs inhibited oxidative stress and downregulated p16 and p19. Taken together, the results of this study indicate that overexpression of Bmi1 in MSCs exerts antiaging and antiosteoporosis effects by inactivating p16/p19 signaling and inhibiting oxidative stress. stem cells 2019;37:1200–1211
Keywords: Bmi1, Mesenchymal stem cells, Transgenic mouse model, Osteoporosis, Oxidative stress
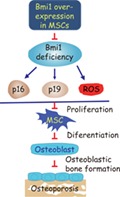
Bmi1 overexpression in mesenchymal stem cells can inactivate p16/p19 signaling and inhibit oxidative stress, stimulate mesenchymal stem cell proliferation and differentiation into osteoblasts, subsequently enhancing osteoblastic bone formation to exert an antiosteoporosis effect.
Significance Statement.
This study demonstrates that mesenchymal stem cell (MSC) overexpressing Bmi1 exerts anti‐aging and antiosteoporosis effects. These findings might provide a strategy to enhance the functionality of MSCs for use in therapeutic applications. The results suggest a clinical relevance of Bmi1 in MSCs, for example, upregulation of BMI1 expression in human MSCs by hypoxic‐cultures or treatment with sonic hedgehog activators, then using them for bone marrow concentrate therapy to enhance MSC potency in antiaging and antiosteoporosis.
Introduction
In the Eμ‐myc transgenic mice, Bmi1 (B‐cell‐specific Moloney murine leukemia virus integration site 1) was found to be a common target for Moloney insertion, resulting in virally accelerated B‐lymphoid tumors, hence its name 1. It was found that Bmi1 has been identified as a member of the polycomb repressor complex 1, which mediates gene silencing by regulating chromatin structure and is for normal and cancer stem cell self‐renewal. Although 30 years of research have elucidated the transcriptional regulation, post‐translational modifications, and Bmi1 function in development, cell cycle, DNA damage response, senescence, stem cell self‐renewal and cancer, the overall potential of a protein with such varied functions remains to be studied 2.
Adult stem cell types that depend on Bmi1 include hematopoietic, neural, intestinal, mammary stem cells, and mesenchymal stem cells (MSCs) 3, 4, 5, 6, 7. Murine and human Bmi1 showed high similarity in cDNA (92.4%) and protein levels (98%), making mice a major model organism of Bmi1 8. Bmi1 knockout (Bmi1−/−) mouse model established by homologous gene recombination technology found that Bmi1−/− mice showed a premature aging phenotype, which was associated with decreased self‐renewal ability of neural stem cells and hematopoietic stem cells 9, 10, 11. Our study found that Bmi1−/− mice exhibited premature osteoporosis associated with reduced MSC self‐renewal and decreased the ability to differentiate into osteoblasts 12. Recently, study showed that the upregulation of BMI1 induced by hypoxic‐cultures stimulated the proliferation of human umbilical cord blood‐MSCs, whereas knockdown of BMI1 in hypoxic cells inhibited their proliferation 13. in vitro study also showed that overexpression of BMI1 resulted in osteogenic priming of human adipose tissue‐derived MSCs under nondifferentiating conditions and enhanced osteogenesis upon differentiation, whereas knockdown of BMI1 reduced their osteogenic differentiation 14. However, it is unknown whether overexpression of Bmi1 in MSCs in vivo affects the proliferation and differentiation of MSCs.
Overexpression of BMI1 in human myoblasts increases mitochondrial activity, leading to increased energy status, while increasing ATP production and protecting against DNA damage in a severe malnutrition mouse model in vitro and xenografts 15. Transgenic mice that specifically overexpress Bmi1 in lymphocytes, neurons or glial cells exhibit susceptibility to development of B‐cell and T‐cell lymphomas, mid lobe and anterior lobe pituitary tumors or medulloblastomas 16, 17. A previous study has shown that overexpression of Bmi1 in lymphocytes results in axial bone transformation along the entire anterior–posterior axis 18, but there is change in the number of vertebrae. Recently, we examined the skeletal phenotype of EμBmi1 transgenic mice with overexpressing Bmi1 in lymphocytes 19. Our results suggest that overexpression of Bmi1 in lymphocytes can stimulate skeletogenesis by improving the osteogenic microenvironment 19. We wonder to know whether overexpression of Bmi1 in MSCs can stimulate skeletogenesis and rescue premature osteoporosis caused by Bmi1 global deficiency.
To answer above questions, we generated Bmi1 transgenic mice (Bmi1Tg), with Bmi1 gene expression driven by the Prx1 gene, which represents the mesenchymal lineage, their skeletal phenotypes were compared with their wild‐type (WT) littermates. Then we crossed Bmi1Tg with Bmi1−/− mice to generate a Bmi1−/− mouse overexpressing Bmi1 in MSCs and their skeletal phenotypes were compared with those of Bmi1−/− and WT mice.
Materials and Methods
Animals
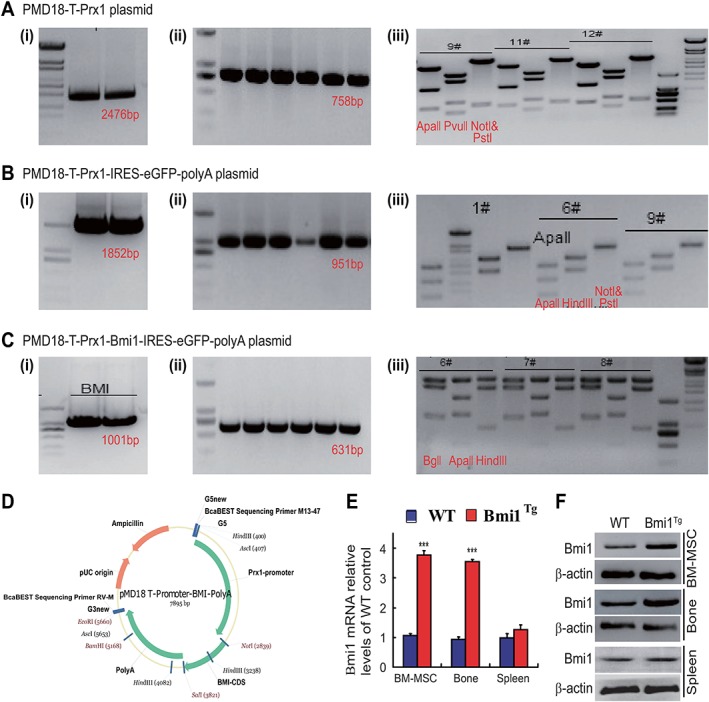
The generation of Prx1‐Bmi1 transgenic (Bmi1Tg) mice: first, a 2,476 bp fragment corresponding to the Prx1 transcript was amplified, digested with Hind III/Bam HI enzymes (Fig. 1A, 1I), and ligated to the PMD18‐T plasmid fragment, which yielded a PMD18‐T‐Prx1 recombinant. PMD18‐T‐Prx1 plasmids were identified by polymerase chain reaction (PCR) (Fig. 1Aii), and confirmed by restriction enzyme digestion (Fig. 1Aiii) and sequencing. Second, an 1,852 bp fragment corresponding to IRES‐eGFP‐polyA was amplified, digested with Sal I/EcoR I enzymes (Fig. 1B, 1I), and ligated to the PMD18‐T‐Prx1 plasmid fragment, which yielded a PMD18‐T‐Prx1‐IRES‐eGFP‐polyA recombinant. PMD18‐T‐Prx1‐IRES‐eGFP‐polyA plasmids were identified by PCR (Fig. 1Bii), and confirmed by restriction enzyme digestion (Fig. 1Biii) and sequencing. At last, an 1,001 bp fragment corresponding to the Bmi1 transcript was amplified, digested with Sal I/Not I enzymes (Fig. 1C, 1I), and ligated to the PMD18‐T‐Prx1‐IRES‐eGFP‐polyA plasmid fragment, which yielded a PMD18‐T‐Prx1‐Bmi1‐IRES‐eGFP‐polyA recombinant. PMD18‐T‐Prx1‐Bmi1‐IRES‐eGFP‐polyA plasmids were identified by PCR (Fig. 1Cii), and confirmed by restriction enzyme digestion (Fig. 1Ciii) and sequencing. The map of PMD18‐T‐Prx1‐Bmi1‐IRES‐eGFP‐polyA plasmid vector was shown (Fig. 1D). Next, the PMD18‐T‐Prx1‐Bmi1‐IRES‐eGFP‐polyA plasmid was linearized and microinjected into the pronucleus of the fertilized egg. The injected embryos were then transferred to the fallopian tube of the pseudopregnant mother. The founder mouse carries the inserted foreign gene in its genome at birth.
Figure 1.
Generation and characteristics of a transgenic mouse model of Bmi1 overexpression in mesenchymal stem cells (MSCs).
(A): A 2,476 bp fragment corresponding to the Prx1 transcript was amplified and cloned into PMD18‐T vector, which yielded a PMD18‐T‐Prx1 recombinant. (B): An 1,852 bp fragment corresponding to the IRES‐eGFP‐polyA was amplified and cloned into PMD18‐T‐Prx1 vector, which produced a PMD18‐T‐Prx1‐IRES‐eGFP‐polyA recombinant. (C): An 1,001 bp fragment corresponding to the Bmi1 transcript was amplified and cloned into PMD18‐T‐Prx1‐IRES‐eGFP‐polyA vector, which generated a PMD18‐T‐Prx1‐Bmi1‐IRES‐eGFP‐polyA recombinant. (i): The fragment purified by agarose gel. (ii): Determination of the insert by PCR assay. (iii): Determination of the insert by enzyme digestion as indicated in the figures. (D): Map of PMD18‐T‐Prx1‐Bmi1‐IRES‐eGFP‐polyA plasmid vector, which was used to generate Bmi1TG mice. Bmi1 gene expression is driven by the Prx1 gene, which represents a mesenchymal lineage. (E): Real‐time (RT)‐PCR of bone marrow (BM) MSCs, long bone and spleen extracts from 8‐week‐old wild‐type (WT), and Bmi1Tg mice for expression of Bmi1 mRNA. Messenger RNA expression assessed by RT‐PCR is calculated as a ratio relative to GAPDH, and expressed relative to WT mice. (F): Western blots of BM‐MSCs, long bone and spleen extracts from 8‐week‐old WT and Bmi1Tg mice for expression of Bmi1. β‐Actin was used as loading control for Western blots. Each value is the mean ± SEM of determinations in five mice of each group. ***, p < .001 compared with WT mice.
Bmi1−/− mice generously provided by Dr. Anton Berns, were genotyped as described previously 12. Bmi1Tg mice and Bmi1 heterozygous (Bmi1+/−) mice were mated to generate Bmi1TgBmi1−/− pups. Lines were maintained by mating Bmi1TgBmi‐1+/− (or Bmi1WTBmi1+/−) males and females on a C57BL/6J genetic background. All mice were incubated and maintained at the specific pathogen free (SPF) Experimental Animal Center of Nanjing Medical University. The use of animals in this study was approved by the Institutional Animal Care and Use Committee of Nanjing Medical University.
Radiographs and Microcomputed Tomography
Femora were removed and all soft tissues were dissected for contact radiography or microcomputed tomography as described 20. A volume of interest for bone mineral density (BMD) quantitative analysis of trabecular bone was defined that extends from the proximal end to the distal end of the tibia. Three‐dimensional images were generated using a constant threshold of 275 for all samples. For each sample, measurements of BMD, trabecular number, and volume were measured as previously described 21.
Histology, Histochemistry, and Immunohistochemistry
Tibiae were removed and histologically processed as described previously 12. The paraffin sections were stained with hematoxylin and eosin, histochemically for total collagen and ALP activity, immunohistochemically for type I collagen as described 22.
Bone Marrow MSC Cultures
Bone marrow (BM) cells were flushed out from tibiae and femurs of 6‐week‐old or 8‐week‐old mice with phosphate buffered saline (PBS). Red blood cells were lysed using lysis buffer (ThermoFisher Scientific A1049201, Waltham, MA USA). (a) For CFU‐f and ALP positive CFU‐f (CFU‐fAP) colony formation assays, BM cells were cultured in 60 mm dishes at 4 × 10⁶ cells per dish in α‐minimum Eagle's medium (MEM) containing 10% fetal calf serum (FCS) (Hyclone Laboratories, South Logan, UT, USA) with or without 50 μg/ml ascorbic acid and 10 mM β‐glycerophosphate for 12 days. At the end of the culture period, cells were stained for CFU‐f or CFU‐fAP. (b) For BM‐MSCs cultures, BM‐MSCs are a heterogeneous population of postnatal precursor cells with the ability to adhere to culture dishes, producing CFU‐f 23. BM cells were cultured at 4 × 10⁶ cells per dish in 60 mm dishes with α‐MEM containing 10% FCS for 7 days. All the cells were digested, collected, and transferred into a Petri dish as the first passage and continually cultured for another 7 days to allow cell growth to confluence. The third generation BM‐MSCs were analyzed by Western blot for Bmi1 expression.
Real‐Time RT‐PCR
For analysis of gene expression, total RNA was isolated from fresh tissue using TRIzol reagent (Invitrogen, Carlsbad, CA) according to the manufacturer's standard protocol. Reverse transcription reactions were performed using PrimeScript First Strand cDNA Synthesis Kit (Takara Bio, Shiga, Japan). The primer sequences for the real‐time (RT) PCR were shown in Table 1, and RT‐PCR was performed as described previously 24.
Table 1.
Sequences of primers used for RT‐PCR
| Name | S/AS | Sequence | Tm (°C) | bp |
|---|---|---|---|---|
| Runx2 | Forward | GTGACACCGTGTCAGCAAAG | 55 | 356 |
| Reverse | GGAGCACAGGAAGTTGGGAC | |||
| ALP | Forward | CTTGCTGGTGGAAGGAGGCAGG | 55 | 393 |
| Reverse | GGAGCACAGGAAGTTGGGAC | |||
| COL‐I | Forward | TCTCCACTCTTCTAGTTCCT | 55 | 269 |
| Reverse | TTGGGTCATTTCCACATGC | |||
| OCN | Forward | CAAGTCCCACACAGCAGCTT | 55 | 370 |
| Reverse | AAAGCCGAGCTGCCAGAGTT | |||
| SOD1 | Forward | GGTGAACCAGTTGTGTTGTC | 56 | 203 |
| Reverse | CCGTCCTTTCCAGCAGTC | |||
| GPX1 | Forward | AGTCCACCGTGTATGCCTTCT | 56 | 105 |
| Reverse | GAGACGCGACATTCTCAATGA | |||
| GAPDH | Forward | TGGATTTGGACGCATTGGTC | 55 | 211 |
| Reverse | TTTGCACTGGTACGTGTTGAT |
RT‐PCR primers used with their name, orientation (S, sense; AS, antisense), sequence, annealing temperature (Tm), and length of amplicon (bp).
Intracellular Reactive Oxygen Species Analysis
To measure the levels of intracellular reactive oxygen species (ROS), 5 mM diacetyldichloro fluoresce (DCFDA, Invitrogen) was used to incubate BM‐MSCs and placed in a shaker for 30 minutes at 37°C and analyzed in a fluorescence‐activated cell sorter (FACS) Calibur flow cytometer (Becton Dickinson, Heidelberg, Germany).
Western Blot Analysis
For the examination of protein expression level, proteins were extracted from mouse tibiae. They were separated on SDS‐PAGE and transferred to polyvinylidene fluoride membranes. Membrane was blotted with primary antibodies against SOD1 (Abcam, MA), p16 (Santa Cruz, MA), p19 (Cell Signaling Technology, Danvers, MA), and β‐actin (Bioworld Technology, St. Louis Park, MN) were used as loading control. Immunoblotting was carried out as we described previously 22.
Statistical Analysis
All the described data represent at least three separate experiments (n > 5 per group) and are expressed as the mean ± SEM. Comparisons between the two groups were analyzed using a two‐tailed unpaired Student's t test. Comparisons between three or more groups were performed using one‐way analysis of variance followed by Bonferroni post hoc multiple comparisons. Significant level was p < .05.
Results
The Characteristics of the Mouse Model with Bmi1 Overexpression in MSCs
In order to clarify the expression of Bmi1 gene and protein in BM‐MSCs, bone tissue and spleen of Bmi1Tg mice, we examined the alterations of Bmi1 expression levels using RT‐PCR and Western blots. Results showed that the expression levels of Bmi1 gene and protein were obvious higher in Bmi1Tg BM‐MSCs and long bone, but not significantly in Bmi1Tg spleen relative to them of WT mice (Fig. 1E, 1F). These results confirmed that we had established a mouse model with Bmi1 overexpression in MSCs successfully.
Effect of Bmi1 Overexpression in MSCs on the Mouse and Skeletal Growth and Bone Mass
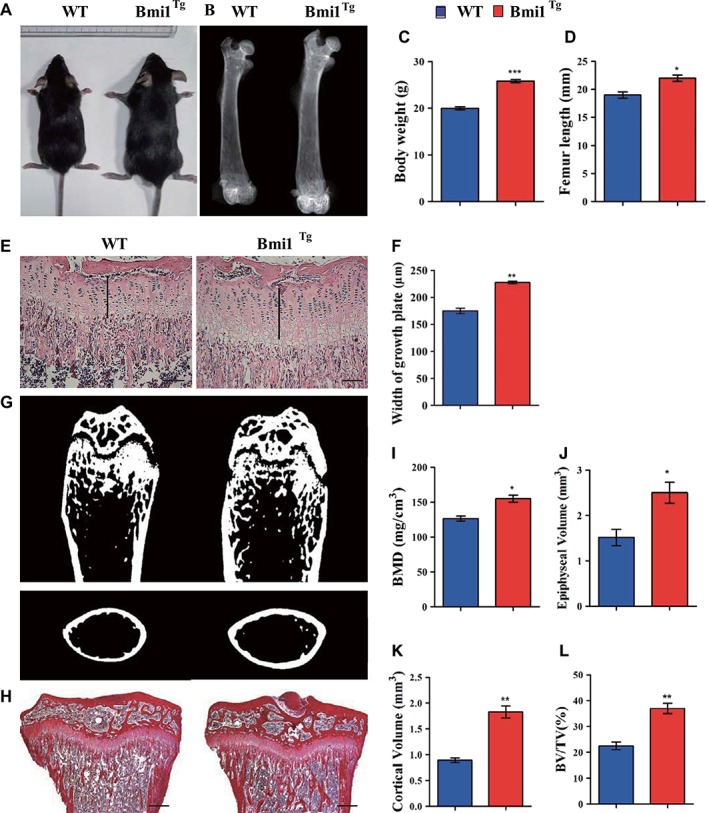
To determine whether Bmi1 overexpression in MSCs affected mouse growth including skeletal growth and bone mass, the body size and weight, length, and mass of long bones were compared between Bmi1Tg mice and WT mice at 8 weeks of aging. Results showed that the body size and weight (Fig. 2A, 2C), the length of long bones and the width of cartilaginous growth plates (Fig. 2B, 2D, 2F), BMD, epiphyseal, cortical, and trabecular bone volume (Fig. 2G, 2L) were increased significantly in Bmi1Tg mice compared with WT mice. These results demonstrated that Bmi1 overexpression in MSCs could stimulate mouse growth including skeletal growth and increased bone mass.
Figure 2.
Effect of Bmi1 overexpression in mesenchymal stem cells (MSCs) on the mouse and skeletal growth and bone mass.
(A): Photographs of representative mice at 8 weeks of age are shown. (B): Representative contact radiographs of the femora. (C): Body weight of 8‐week‐old mice. (D): The length of femora. (E): Representative micrographs of paraffin‐embedded sections of tibiae stained with hematoxylin and eosin. Scale bars represent 200 μm. (F): Width of growth plates and (G) representative longitudinal and cross‐sectional images of three‐dimensional reconstructed distal ends of femora and diaphyses utilizing microcomputed tomography. (H): Representative micrographs of paraffin‐embedded sections of tibiae stained histochemically for total collagen. Scale bars represent 400 μm. (I): Bone mineral density measurements, (J) epiphyseal volume, (K) cortical volume, and (L) trabecular bone volume/total volume. Each value is the mean ± SEM of determinations in five mice of each group. *, p < .05; **, p < .01; ***, p < .001 compared with WT mice.
Effect of Bmi1 Overexpression in MSCs on Osteoblastic Bone Formation and Osteogenesis
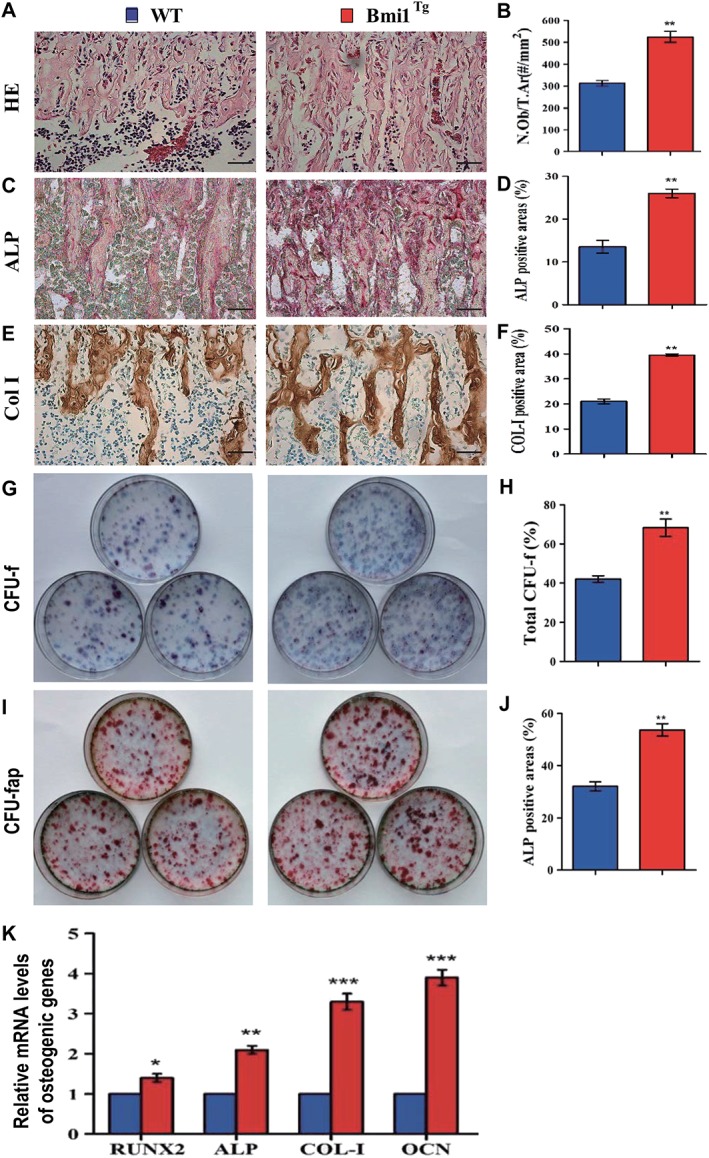
To determine whether increased bone mass caused by Bmi1 overexpression in MSCs was associated with enhancing osteoblastic bone formation and osteogenesis, we examined alterations of osteoblastic bone formation and osteogenesis in Bmi1Tg mice in vivo and ex vivo BM‐MSC cultures. Results revealed that osteoblast number, ALP‐positive and type I collagen (Col‐I)‐positive bone areas (Fig. 3A, 3F), total numbers of CFU‐f, and ALP+ CFU‐f (Fig. 3G, 3J) were all significantly increased in the Bmi1Tg mice compared with WT mice. The expression of genes involved in osteogenesis was examined using RT‐PCR. Expression levels of the osteogenic genes, including Runx2, ALP, Col‐I, and osteocalcin, were upregulated significantly in Bmi1Tg mice compared with WT mice (Fig. 3K). These results indicate that Bmi1 overexpression in MSCs could stimulate the proliferation of BM‐MSCs and accelerate their osteogenic differentiation, subsequently, increase osteoblastic bone formation.
Figure 3.
Effect of Bmi1 overexpression in MSCs on osteoblastic bone formation and osteogenesis.
Representative micrographs of paraffin sections of tibial metaphyseal regions stained (A) with hematoxylin and eosin, (C) histochemically for alkaline phosphatase (ALP), and (E) immunohistochemically for type I collagen (col‐I). Scale bars represent 50 μm in (A), (C), and (E). (B): Osteoblast number relative to tissue area (N.Ob/t.Ar, #/mm2), (D) ALP‐positive areas, and (F) col‐I immunopositive areas were measured by computer‐assisted image analysis. Primary bone marrow (BM) cells from 8‐week‐old WT and Bmi1Tg mice were cultured ex vivo in osteogenic differentiation medium for 18 days and resulting cultures were stained with (G) methylene blue for the total number of colonies (colony forming unit fibroblasts [CFU‐F]) and (I) cytochemically for ALP to show CFU‐Fap. (H): Total CFU‐f‐positive areas and (J) ALP‐positive areas relative to culture dish area. (K): Real‐time (RT)‐PCR analysis of BM‐MSC extracts for the expression of Runx2, ALP, Col‐I and OCN. Messenger RNA expression assessed by RT‐PCR is expressed as a ratio to Gapdh expression. Each value is the mean ± SEM of determinations in five mice of each group. *, p < .05; **, p < .01; ***, p < .001 compared with WT mice.
Effect of Bmi1 Overexpression in MSCs on Lifespan and Skeletal Growth in Bmi‐1−/− Mice
To further assess whether the Bmi1 overexpression in MSCs might rescue the premature aging and skeletal growth defect caused by Bmi1 global deficiency 19, we first examined the effect of Bmi1 overexpression on lifespan and body weight of Bmi1−/− mice. Results showed that the mean survival time was only 6 weeks (2–9 weeks) in Bmi‐1−/− mice, whereas it prolonged to 17 weeks (8–23 weeks) in Bmi1Tg Bmi1−/− mice (Fig. 4A). Body size and weight (Fig. 4B, 4C), the length of tibiae and the width of the cartilaginous growth plate (Fig. 4D, 4G) were significantly increased in Bmi1TgBmi1−/− mice compared with Bmi1−/− mice, however, these parameters did not reach the levels of WT mice. These results demonstrated that Bmi1 overexpression in MSCs could improve the premature aging and skeletal growth defect caused by Bmi1 global deficiency.
Figure 4.
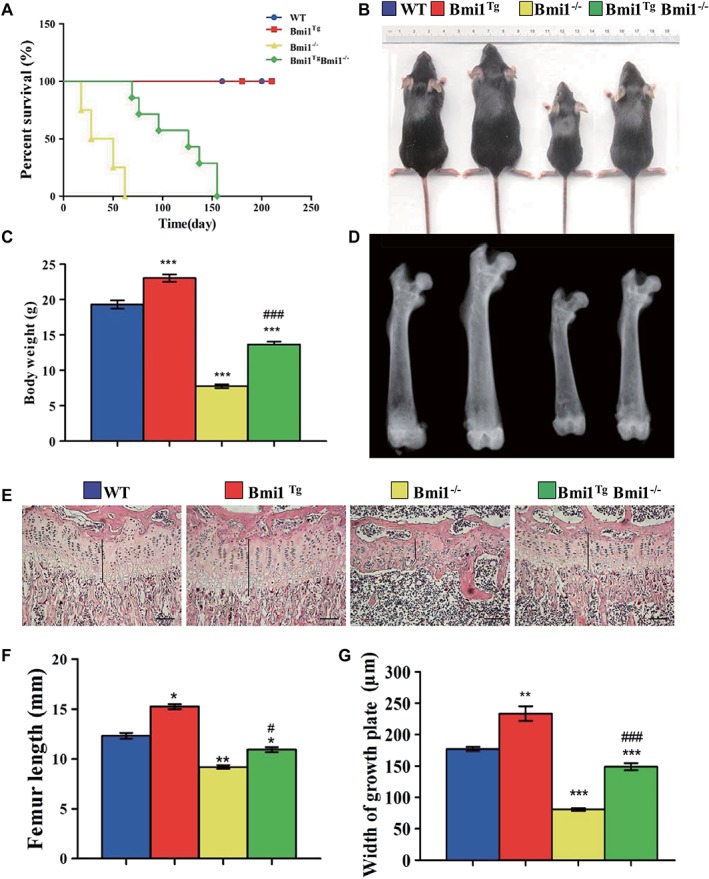
Effect of Bmi1 overexpression in MSCs on lifespan and skeletal growth in Bmi‐1−/− mice.
(A): Survival curves of wild‐type (WT), Bmi1Tg, Bmi1−/−, and Bmi1TgBmi1−/− mice. (B): Photographs of representative mice at 6 weeks of age. (C): Body weight of 6‐week‐old mice. (D): Representative radiographs of the femora from 6‐week‐old mice. (E): Representative micrographs from paraffin‐embedded sections of tibias stained with hematoxylin and eosin. Scale bars represent 200 μm. (F): The length of femora. (G): The width of the cartilaginous growth plate. Each value is the mean ± SEM of determinations in five mice of each group. *, p < .05; **, p < .01; ***, p < .001 compared with WT mice; #, p < .05; ###, p < .001 compared with Bmi1−/− mice.
Effect of Bmi1 Overexpression in MSCs on Osteoblastic Bone Formation in Bmi1−/− Mice
To investigate whether the Bmi1 overexpression in MSCs could rescue defective osteoblastic bone formation caused by Bmi1 global deficiency, the alterations of osteoblastic bone formation parameters were examined in vivo. Results showed that the BMD, cortical and trabecular bone volume, osteoblast numbers, ALP‐positive, and col‐I‐positive bone areas were all significantly increased in Bmi1TgBmi1−/− mice compared with Bmi1−/− mice, however, these parameters did not reach the levels of WT mice (Fig. 5A, 5K). Thus, Bmi1 overexpression in MSCs could partially reverse osteoporotic phenotype in Bmi1−/− mice by stimulating osteoblastic bone formation.
Figure 5.
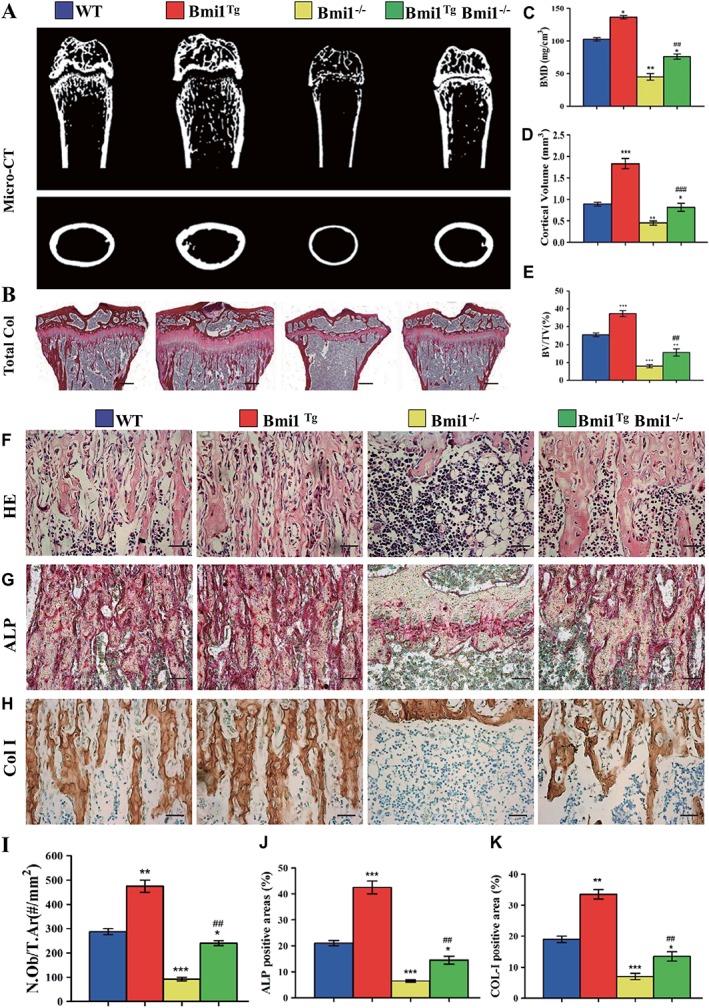
Effect of Bmi1 overexpression in mesenchymal stem cells (MSCs) on osteoblastic bone formation in Bmi1−/− mice.
(A): Representative longitudinal and cross‐sectional images of three‐dimensional reconstructed distal ends of femurs and mid shaft diaphyses utilizing microcomputed tomography. (B): Representative micrographs of paraffin‐embedded sections of tibias stained histochemically for total collagen. Scale bars represent 400 μm. (C): Bone mineral density measurements, (D) epiphyseal volume, and (E) trabecular bone volume/tissue volume. Representative micrographs of paraffin sections of tibial metaphyseal regions stained (F) with hematoxylin and eosin, (G) histochemically for alkaline phosphatase (ALP), and (H) immunohistochemically for type I collagen (col‐I). Scale bars represent 50 μm in (F), (G), and (H). (I): Osteoblast number relative to tissue area (N.Ob/t.Ar, #/mm2), (J) ALP‐positive areas, and (K) col‐I‐immunopositive areas were measured by computer‐assisted image analysis. Each value is the mean ± SEM of determinations in five mice of each group. *, p < .05; **, p < .01; ***, p < .001 compared with WT mice. ##, p < .01; ###, p < .001 compared with Bmi1−/− mice.
Effect of Bmi1 Overexpression in MSCs on Osteogenesis of BM‐MSCs in Bmi1−/− Mice
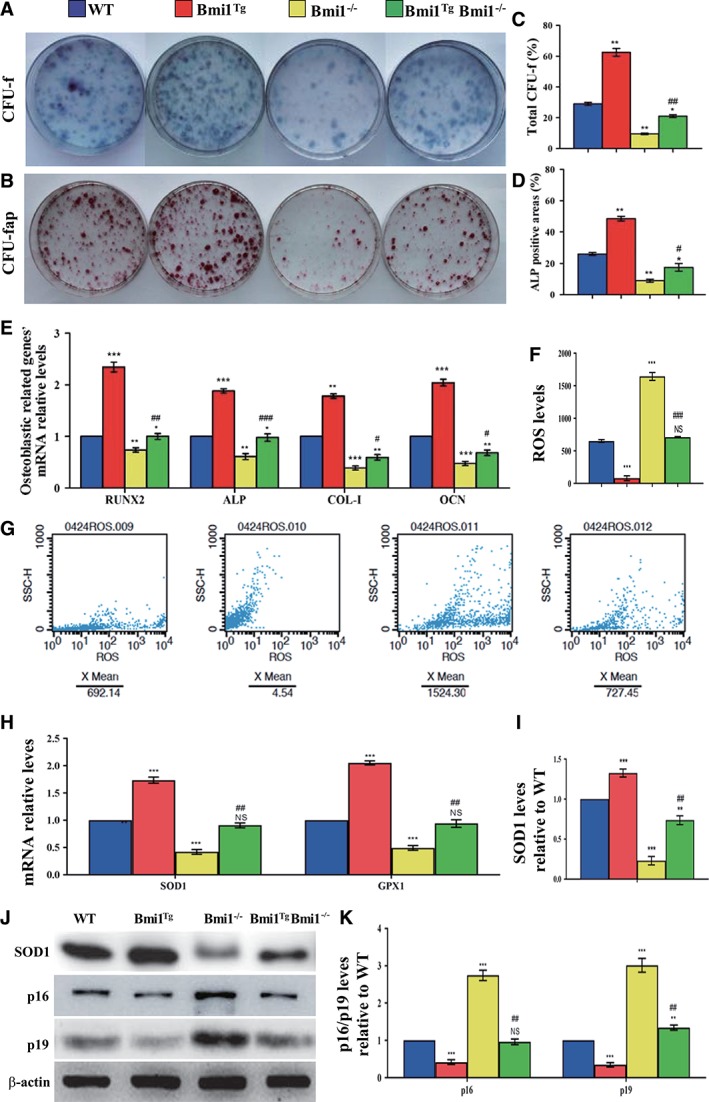
To further investigate whether Bmi1 overexpression in MSCs could improve osteogenesis of BM‐MSCs in Bmi1−/− mice, CFU‐f assays were performed by ex vivo BM cell cultures. Results revealed that CFU‐f and CFU‐fap areas were increased significantly in Bmi1TgBmi1−/− mice compared with Bmi1−/− mice, however, these parameters did not reach the levels of WT mice (Fig. 6A, 6D). We also examined the expression of genes involved in osteogenesis using RT‐PCR. Expression levels of the osteogenic genes, including Runx2, ALP, type I collagen, and osteocalcin, were upregulated significantly in Bmi1TgBmi1−/− mice compared with Bmi1−/− mice, however, these parameters did not reach the levels of WT mice (Fig. 6E). These results supported that Bmi1 overexpression in MSCs could improve osteoblastic bone formation in Bmi1−/− mice by enhancing osteogenesis of BM‐MSCs.
Figure 6.
Effect of Bmi1 overexpression in mesenchymal stem cells (MSCs) on the proliferation and differentiation of bone marrow (BM) MSCs in Bmi1−/− mice.
Primary BM cells from 6‐week‐old WT, Bmi1Tg, Bmi1−/−, and Bmi1TgBmi1−/− mice were cultured ex vivo in osteogenic differentiation medium for 18 days and resulting cultures were stained with (A) methylene blue for total number of colonies (colony forming unit fibroblasts [CFU‐F]) and (B) cytochemically for alkaline phosphatase (ALP) to show CFU‐Fap. (C): Total CFU‐f‐positive areas and (D) ALP‐positive areas relative to culture dish area. (E): Real‐time (RT)‐PCR analysis of BM‐MSC extracts for the expression of Runx2, ALP, Col‐I and OCN. Messenger RNA expression assessed by RT‐PCR is expressed as a ratio to Gapdh expression. (F): Reactive oxygen species (ROS) levels in BM‐MSCs were determined by flow cytometric analysis. (G): Representative graphs of flow cytometry analysis for ROS levels in BM‐MSCs. (H): Gene expression levels of antioxidative enzymes. (J): Western blots of BM‐MSC extracts for expression of SOD1, p16, and p19. β‐Actin was used as loading control for Western blots. (I): SOD1 and (K) p16 and p19 protein levels relative to β‐actin protein level were assessed by densitometric analysis and expressed relative to levels of WT BM‐MSCs. Each value is the mean ± SEM of determinations in five mice of each group. *, p < .05; **, p < .01; ***, p < .001 compared with WT mice. #, p < .05; ##, p < .01; ###, p < .001 compared with Bmi1−/− mice.
Effect of Bmi1 Overexpression in MSCs on Redox Balance and p16/p19 Signaling Molecules in Bmi1−/− Mice
To explain how Bmi1 overexpression in MSCs can stimulate proliferation of BM‐MSCs and their differentiation into osteoblasts in Bmi1 deficient mice, we examined ROS levels and expression levels of antioxidative enzymes in BM‐MSCs. ROS level in BM‐MSCs was reduced obviously in Bmi1Tg mice but was increased dramatically in Bmi1−/− mice compared with WT mice; however, this parameter was reduced in Bmi1TgBmi1−/− mice compared with Bmi1−/− mice (Fig. 6F, 6G). Expression levels of antioxidative enzymes including SOD1 and GPX1 mRNA (Fig. 6H) and SOD1 protein (Fig. 6I, 6J) were upregulated dramatically in Bmi1Tg mice, but downregulated significantly in Bmi1−/− mice compared with WT mice, however, these parameters were upregulated significantly in Bmi1TgBmi1−/− mice in comparison with Bmi1−/− mice. In contrast, the p16 and p19 protein expression levels were downregulated in Bmi1Tg mice but upregulated in Bmi1−/− mice compared with WT mice, however, they were downregulated in Bmi1TgBmi1−/− mice compared with Bmi1−/− mice (Fig. 6J, 6K). These resulted suggest that Bmi1 overexpression in MSCs could stimulate proliferation of BM‐MSCs and their differentiation into osteoblasts by inhibiting oxidative stress and inactivating p16/p19 signaling pathway.
Discussion
In this study, we for the first time generated a transgenic mouse model with Bmi1 overexpression in MSCs driven by the Prx1 gene. We demonstrated that the expression levels of Bmi1 at both mRNA and protein levels were upregulated threefold to fourfold in skeletal tissue and BM‐MSCs from Bmi1Tg mice relative to those from WT mice. By phenotypic analyses, we demonstrated that Bmi1 overexpression in MSCs not only accelerated skeletal growth and osteoblastic bone formation through stimulating osteogenesis of BM‐MSCs, but also accelerated whole body growth. Furthermore, we crossed Bmi1Tg mice with Bmi1−/− mice to generate Bmi1TgBmi1−/− mice, and compared their phenotypes with those of Bmi1−/− and WT mice. Our results showed that the Bmi1 overexpression in MSCs not only largely reversed Bmi1 global deficiency‐induced skeletal growth retardation and osteoporosis, but also partially reversed Bmi1 global deficiency‐induced premature aging by inhibiting oxidative stress and inactivating p16/p19 signaling.
It has been shown in a previous study that the upregulation of BMI1 induced by hypoxic‐cultures stimulated the proliferation of human umbilical cord blood‐MSCs, whereas knockdown of BMI1 in hypoxic cells inhibited their proliferation in vitro 13. Our previous study revealed that deletion of Bmi1 in mice leads to osteopenia caused by an exhaustion of the MSC pool in the bone due to impaired the proliferation of BM‐MSCs, a consequence of upregulated p16Ink4a/p19Arf expression 12. In the present study, our results demonstrated that overexpression of Bmi1 in MSCs accelerates skeletal growth and increases bone mass by stimulating the osteogenesis of BM‐MSCs, a consequence of downregulated p16Ink4a/p19Arf expression. Consistently, Bmi1 overexpression in MSCs in the Bmi1−/− background largely rescued the osteoporotic phenotype of Bmi1−/− mice by partially reversing deregulated p16Ink4a/p19Arf expression and defective proliferation and osteogenic differentiation of BM‐MSCs. Previous studies have shown that Bmi1 is essential for efficient self‐renewal of adult https://www.thermofisher.com/ca/en/home/life-science/stem-cell-research/hematopoietic-stem-cells.html as well as adult neural stem cells 9, 10. Bmi1 target, the Ink4a locus 25, uses different promoters to encode the forced expression of p16Ink4a and p19Arf 26. High expression of p16Ink4a and p19Arf in HSCs led to senescence and apoptosis, respectively 10. In neural stem cells, p16Ink4a deficiency partially restored the self‐renewal ability of Bmi1‐deficient stem cells 9. We recently showed that p16 deletion largely rescued Bmi1 deficiency‐induced renal aging phenotypes by promoting proliferation and inhibiting senescence of renal interstitial fibroblasts 27. Therefore, results from this study indicate clearly that Bmi1 is required for the maintenance of MSC self‐renewal by inactivating p16Ink4a and p19Arf signaling to accelerate skeletal growth and prevent osteoporosis.
It has recently been shown that in vitro overexpression of BMI1 enhanced osteogenesis of human adipose tissue‐derived MSCs, whereas knockdown of BMI1 reduced their osteogenic differentiation 14. Our previous study showed that Bmi1 deficiency reduced osteogenesis of BM‐MSCs with downregulation of osteogenic gene expression 12. In this study, we found that overexpression of Bmi1 in MSCs stimulated the osteogenesis of BM‐MSCs in both WT mice and Bmi1 deficient mice with upregulation of osteogenic gene expression. Our results revealed that overexpression of Bmi1 in MSCs not only leads to increased ALP‐positive CFU‐f significantly in ex vivo CFU‐f assay, but also clearly increased ALP positive osteoblasts and type I collagen deposition in bone matrix in vivo in both WT and Bmi1 deficient mice. These results indicate that overexpression of Bmi1 in MSCs can stimulate the osteogenesis of MSCs, consequently promote skeletal growth and osteoblastic bone formation.
In this study, we noted that Bmi1 overexpression in MSCs could not rescue completely Bmi1 global deficiency‐induced skeletal growth retardation and osteoporotic phenotypes, although it can accelerate skeletal growth and osteoblastic bone formation through stimulating the osteogenesis of BM‐MSCs in WT mice. It may be related to Bmi1 gene widely expression in embryonic stem cells, placenta, thymus, heart, testicles, and brain 9, 10, 28, especially, not only in MSCs 13, but also in lymphocytes 29. Our previous findings demonstrate that overexpression of Bmi1 only in lymphocytes stimulates osteogenesis of BM‐MSCs by releasing osteogenic factors and lowering ROS levels, thereby accelerating osteogenic bone formation 19, suggesting that overexpression of Bmi1 in lymphocytes can improve the osteogenic microenvironment and stimulate osteogenesis. Therefore, our results suggest that cooperation between osteogenic cells and osteogenic microenvironmental cells are required for maintaining of skeletal homeostasis. Regular Bmi1 expression in both osteogenic cells and osteogenic microenvironmental cells are required for skeletal growth and osteoblastic bone formation.
Many abnormalities have occurred in Bmi1 global deficient mice including a severe defect in stem cell self‐renewal and a shortened lifespan 9, 10, 11, 12 25. Bmi1 deficiency leads to elevated ROS levels, and acetylcysteine (NAC) supplementation can partially correct the premature aging phenotype caused by Bmi1 deletion Bmi1 30. Our recent study demonstrated that the treatment with antioxidant NAC could improve Bmi1 global deficiency induced defects in dentin and alveolar bone formation 31. Therefore, Bmi1 exerts its physiological function not only by inactivating p16 and p19 signaling pathways, but also through inhibiting oxidative stress 30. In the current study, we also found that Bmi1 overexpression in MSCs not only largely reversed Bmi1 global deficiency‐induced skeletal growth retardation and osteoporosis, but also partially reversed Bmi1 global deficiency‐induced whole‐body growth retardation and premature aging. Our results revealed that overexpression of Bmi1 in MSCs inhibited Bmi1 global deficiency‐induced oxidative stress by upregulation of antioxidant enzyme gene expression.
MSC treatment is entering a challenging phase after completion of many preclinical and clinical trials. The main obstacles encountered in the treatment of MSC are inconsistent stem cell efficacy, poor cell transplantation and survival, and age/disease‐associated host tissue damage, indicating an urgent need to optimize therapeutic platforms and enhance stem cell efficacy 32. A previous study has demonstrated that hypoxic‐cultures can upregulate BMI1 expression levels in human umbilical cord blood‐MSCs 13. Sonic hedgehog signals to the downstream transcription factor GLI through its receptor, patched and smoothened, to control Bmi1 protein levels 33. Our results from this study indicate that Bmi1 overexpression in MSCs can stimulate the osteogenesis of BM‐MSCs by inactivating p16/p19 signaling and inhibiting oxidative stress. Our results suggest a clinical relevance of Bmi1 in MSCs, for example, upregulation of BMI1 expression in human MSCs by hypoxic‐cultures or treatment with sonic hedgehog activators, then using then for MSC therapy to enhance MSC potency in antiaging and antiosteoporosis.
Conclusion
Taken together, results from this study indicate that overexpression of Bmi1 in MSCs exerts antiaging and antiosteoporosis actions by inactivating p16/p19 signaling and inhibiting oxidative stress, suggesting that these findings might provide a strategy to enhance the functionality of MSCs for use in therapeutic applications.
Author Contributions
G.C.: study conduct, data collection, data analysis, data interpretation, drafting manuscript, final approval of manuscript; Y.Z.: study conduct, data collection, data analysis, data interpretation, final approval of manuscript; S.Y.: study conduct, data collection, data analysis, final approval of manuscript; W.S.: study conduct, data collection, data analysis, drafting manuscript, final approval of manuscript; D.M.: study design, data analysis, data interpretation, drafting manuscript, revising manuscript content, integrity of the data analysis, final approval of manuscript.
Disclosure of Potential Conflicts of Interest
The authors indicated no potential conflicts of interest.
Data Availability Statement
The data that support the findings of this study are available from the corresponding author upon reasonable request.
Acknowledgments
Research was supported by grants from the National Natural Science Foundation of China (81730066 and 81230009 to D.M.), from the National Basic Research Program of China (2014CB942900 to D.M.), from Youth Innovation Talent Program of Department of Education of Guangdong Province in China (A1‐AFD018171Z1322 to G.C.), and from Natural Science Foundation of Jiangsu Province in China (BK20180034 to W.S.).
References
- 1. van Lohuizen M, Verbeek S, Scheijen B et al. Identification of cooperating oncogenes in E mu‐myc transgenic mice by provirus tagging. Cell 1991;65:737–752. [DOI] [PubMed] [Google Scholar]
- 2. Bhattacharya R, Mustafi SB, Street M et al. Bmi‐1: At the crossroads of physiological and pathological biology. Genes Dis 2015;2:225–239. [DOI] [PMC free article] [PubMed] [Google Scholar]
- 3. Lessard J, Sauvageau G. Bmi‐1 determines the proliferative capacity of normal and leukaemic stem cells. Nature 2003;423:255–260. [DOI] [PubMed] [Google Scholar]
- 4. Leung C, Lingbeek M, Shakhova O et al. Bmi1 is essential for cerebellar development and is overexpressed in human medulloblastomas. Nature 2004;428:337–341. [DOI] [PubMed] [Google Scholar]
- 5. Liu S, Dontu G, Mantle ID et al. Hedgehog signaling and Bmi‐1 regulate self‐renewal of normal and malignant human mammary stem cells. Cancer Res 2006;66:6063–6071. [DOI] [PMC free article] [PubMed] [Google Scholar]
- 6. Sangiorgi E, Capecchi MR. Bmi1 is expressed in vivo in intestinal stem cells. Nat Genet 2008;40:915–920. [DOI] [PMC free article] [PubMed] [Google Scholar]
- 7. Schuringa JJ, Vellenga E. Role of the polycomb group gene BMI1 in normal and leukemic hematopoietic stem and progenitor cells. Curr Opin Hematol 2010;17:294–299. [DOI] [PubMed] [Google Scholar]
- 8. Alkema MJ, Wiegant J, Raap AK et al. Characterization and chromosomal localization of the human proto‐oncogene BMI‐1. Hum Mol Genet 1993;2:1597–1603. [DOI] [PubMed] [Google Scholar]
- 9. Molofsky AV, Pardal R, Iwashita T et al. Bmi‐1 dependence distinguishes neural stem cell self‐renewal from progenitor proliferation. Nature 2003;425:962–967. [DOI] [PMC free article] [PubMed] [Google Scholar]
- 10. Park I, Qian D, Kiel M et al. Bmi‐1 is required for maintenance of adult self‐renewing haematopoietic stem cells. Nature 2003;423:302–305. [DOI] [PubMed] [Google Scholar]
- 11. van der Lugt NM, Domen J, Linders K et al. Posterior transformation, neurological abnormalities, and severe hematopoietic defects in mice with a targeted deletion of the bmi‐1 proto‐oncogene. Genes Dev 1994;8:757–769. [DOI] [PubMed] [Google Scholar]
- 12. Zhang HW, Ding J, Jin JL et al. Defects in mesenchymal stem cell self‐renewal and cell fate determination lead to an osteopenic phenotype in Bmi‐1 null mice. J Bone Miner Res 2010;25:640–652. [DOI] [PubMed] [Google Scholar]
- 13. Lee JY, Yu KR, Kim HS et al. BMI1 inhibits senescence and enhances the immunomodulatory properties of human mesenchymal stem cells via the direct suppression of MKP‐1/DUSP1. Aging 2016;8:1670–1689. [DOI] [PMC free article] [PubMed] [Google Scholar]
- 14. Becker M, Potapenko T, Niklaus A et al. Polycomb protein BMI1 regulates osteogenic differentiation of human adipose tissue‐derived mesenchymal stem cells downstream of GSK3. Stem Cells Dev 2016;25:922–933. [DOI] [PubMed] [Google Scholar]
- 15. Dibenedetto S, Niklison‐Chirou M, Cabrera CP et al. Enhanced energetic state and protection from oxidative stress in human myoblasts overexpressing BMI1. Stem Cell Rep 2017;9:528–542. [DOI] [PMC free article] [PubMed] [Google Scholar]
- 16. Alkema MJ, Jacobs H, van Lohuizen M et al. Pertubation of B and T cell development and predisposition to lymphomagenesis in Emu Bmi1 transgenic mice require the Bmi1 RING finger. Oncogene 1997;15:899–910. [DOI] [PubMed] [Google Scholar]
- 17. Westerman BA, Blom M, Tanger E et al. GFAP‐Cre‐mediated transgenic activation of Bmi1 results in pituitary tumors. PLoS One 2012;7:e35943. [DOI] [PMC free article] [PubMed] [Google Scholar]
- 18. Alkema MJ, van der Lugt NM, Bobeldijk RC et al. Transformation of axial skeleton due to overexpression of bmi‐1 in transgenic mice. Nature 1995;374:724–727. [DOI] [PubMed] [Google Scholar]
- 19. Zhou X, Dai X, Wu X et al. Overexpression of Bmi1 in lymphocytes stimulates skeletogenesis by improving the osteogenic microenvironment. Sci Rep 2016;6:29171. [DOI] [PMC free article] [PubMed] [Google Scholar]
- 20. Xue Y, Zhang Z, Karaplis AC et al. Exogenous PTH‐related protein and PTH improve mineral and skeletal status in 25‐hydroxyvitamin D‐1alpha‐hydroxylase and PTH double knockout mice. J Bone Miner Res 2005;20:1766–1777. [DOI] [PubMed] [Google Scholar]
- 21. Sun W, Zhang H, Wang H et al. Targeting Notch‐activated M1 macrophages attenuates joint tissue damage in a mouse model of inflammatory arthritis. J Bone Miner Res 2017;32:1469–1480. [DOI] [PMC free article] [PubMed] [Google Scholar]
- 22. Zhang Y, Chen G, Gu Z et al. DNA damage checkpoint pathway modulates the regulation of skeletal growth and osteoblastic bone formation by parathyroid hormone‐related peptide. Int J Biol Sci 2018;14:508–517. [DOI] [PMC free article] [PubMed] [Google Scholar]
- 23. Akiyama K, You YO, Yamaza T et al. Characterization of bone marrow derived mesenchymal stem cells in suspension. Stem Cell Res Ther 2012;3:40. [DOI] [PMC free article] [PubMed] [Google Scholar]
- 24. Zhu M, Zhang J, Dong Z et al. The p27 pathway modulates the regulation of skeletal growth and osteoblastic bone formation by parathyroid hormone‐related peptide. J Bone Miner Res 2015;30:1969–1979. [DOI] [PubMed] [Google Scholar]
- 25. Jacobs JJ, Kieboom K, Marino S et al. The oncogene and Polycomb‐group gene bmi‐1 regulates cell proliferation and senescence through the ink4a locus. Nature 1999;397:164–168. [DOI] [PubMed] [Google Scholar]
- 26. Quelle DE, Zindy F, Ashmun RA et al. Alternative reading frames of the INK4a tumor suppressor gene encode two unrelated proteins capable of inducing cell cycle arrest. Cell 1995;83:993–1000. [DOI] [PubMed] [Google Scholar]
- 27. Jin J, Tao J, Gu X et al. P16 (INK4a) deletion ameliorated renal tubulointerstitial injury in a stress‐induced premature senescence model of Bmi‐1 deficiency. Sci Rep 2017;7:7502. [DOI] [PMC free article] [PubMed] [Google Scholar]
- 28. Dai X, Zhang Q, Yu Z et al. Bmi1 deficient mice exhibit male infertility. Int J Biol Sci 2018;14:358–368. [DOI] [PMC free article] [PubMed] [Google Scholar]
- 29. Li J, Wang Q, Yang R et al. BMI‐1 mediates estrogen‐deficiency‐induced bone loss by inhibiting reactive oxygen species accumulation and T cell activation. J Bone Miner Res 2017;32:962–973. [DOI] [PubMed] [Google Scholar]
- 30. Liu J, Cao L, Chen J et al. Bmi1 regulates mitochondrial function and the DNA damage response pathway. Nature 2009;459:387–392. [DOI] [PMC free article] [PubMed] [Google Scholar]
- 31. Yin Y, Xue X, Wang Q et al. Bmi1 plays an important role in dentin and mandible homeostasis by maintaining redox balance. Am J Transl Res 2016;8:4716–4725. [PMC free article] [PubMed] [Google Scholar]
- 32. Tyndall A. Successes and failures of stem cell transplantation in autoimmune diseases. Hematol Am Soc Hematol Educ Program 2011;2011:280–284. [DOI] [PubMed] [Google Scholar]
- 33. Muyrers‐Chen I, Hernandez‐Munoz I, Lund AH et al. Emerging roles of Polycomb silencing in X‐inactivation and stem cell maintenance. Cold Spring Harb Symp Quant Biol 2004;69:319–326. [DOI] [PubMed] [Google Scholar]
Associated Data
This section collects any data citations, data availability statements, or supplementary materials included in this article.
Data Availability Statement
The data that support the findings of this study are available from the corresponding author upon reasonable request.