Abstract
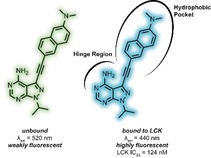
The development of a fluorescent LCK inhibitor that exhibits favourable solvatochromic properties upon binding the kinase is described. Fluorescent properties were realised through the inclusion of a prodan‐derived fluorophore into the pharmacophore of an ATP‐competitive kinase inhibitor. Fluorescence titration experiments demonstrate the solvatochromic properties of the inhibitor, in which dramatic increase in emission intensity and hypsochromic shift in emission maxima are clearly observed upon binding LCK. Microscopy experiments in cellular contexts together with flow cytometry show that the fluorescence intensity of the inhibitor correlates with the LCK concentration. Furthermore, multiphoton microscopy experiments demonstrate both the rapid cellular uptake of the inhibitor and that the two‐photon cross section of the inhibitor is amenable for excitation at 700 nm.
Keywords: fluorescence, inhibitors, kinase, solvatochromism
A fluorescent LCK inhibitor has been obtained through the conjugation of a prodan‐derived fluorophore to the pharmacophore of an ATP‐competitive kinase inhibitor. Fluorescence titration experiments demonstrate the favourable solvatochromic properties of the inhibitor upon binding the kinase. Microscopy and flow cytometry experiments demonstrate that the fluorescence intensity of the inhibitor correlates with LCK concentration.

Small molecule bioactives that exhibit innate fluorescent properties serve as highly valuable tools to probe fundamental events in healthy and diseased cells and tissue. Even more so are those that exhibit diagnostic changes in their emissive properties (i.e. changes in fluorescence intensity or colour) in concert with binding to their respective biomolecular target.1 Such characteristics allow the researcher to distinguish between bound and unbound molecules, gaining further insight into subcellular localisation and the underlying mechanisms of substrate activation or inhibition.
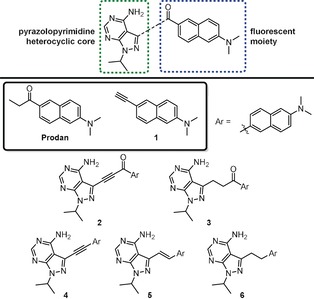
The prodan fluorophore (Figure 1) has been highly utilised to probe biological systems due to its desirable spectroscopic properties, including high fluorescence quantum yield and molar absorption coefficient, pronounced solvatochromism, good photostability as well as a large cross section for two‐photon absorption (75 GM in EtOH).2 To date, prodan has seen extensive use as an environment‐sensitive dye to probe the binding sites of proteins3 and DNA,4 as well as the structural and dynamic changes in cellular membrane properties.5 Furthermore, prodan and its analogues (Supporting Information, Figure S1) have also demonstrated their utility as two‐photon excitable fluorophores for in‐depth live‐tissue imaging6 and the imaging of lipid membranes,7 amyloid‐β plaques,8 and toxic cadmium deposits in cells.9
Figure 1.

Potential prodan‐derived pyrazolopyrimidine kinase inhibitors.
The aberrant regulation of kinase enzymes is associated with virtually all major disease areas and are therefore regarded as important drug targets.10 Despite the advantages of fluorescence imaging in live cells, there are only a handful of examples in which fluorescent kinase inhibitors have been employed as a tool to study kinase inhibition in a cellular setting,11 while even fewer have been utilised for in vivo imaging studies.12
In light of this, we describe herein the design, synthesis, and photophysical as well as the biological characterisation of small prodan‐based ATP‐competitive kinase inhibitors (Figure 1). The effect of the conjugation of the linker between the fluorescent moiety and the heterocyclic core (i.e. alkane vs. alkyne) as well as the importance of the carbonyl group in the prodan fluorophore was of particular interest.
The pyrazolo[3,4‐d]pyrimidine heterocycle serves as an important scaffold in a number of ATP‐competitive kinase inhibitors (Supporting Information, Figure S2).13 We therefore anticipated that the introduction of the fluorescent moiety at the 3‐position of the heterocycle would readily be accommodated in the active site, as the prodan moiety would extend out into the hydrophobic back pocket. As the fluorescent moiety would experience a much less polar environment compared to aqueous solution, a fluorophore that displays pronounced solvatochromism could therefore report, by photonic means, that binding to the kinase has occurred.
The prodan‐derivatives were synthesised and their photophysical properties thoroughly evaluated (see the Supporting Information for synthetic details). Absorption and emission spectra of prodan and compounds 1–6 were recorded in solvent systems of varying polarity (Table 1 and Supporting Information, Tables S1–S2 for additional spectroscopic properties). Both prodan and 1 (Figure 1) were chosen to represent the parent fluorophores. Prodan as well as 2 and 3 display a red‐shifted absorption in aqueous solution compared to aprotic solvents, while the opposite effect is observed for 5 and 6. The absorption maximum of 4 shows very little dependency on the solvent polarity (Table 1 and Supporting Information, Figure S7). In comparison to prodan and the other derivatives, the absorption maximum of 2 is significantly red‐shifted, reflecting the most extended conjugated system (Table 1 and Supporting Information, Figure S5). Furthermore, all compounds with an extended conjugated system (2, 4, and 5) exhibit a higher molar absorption coefficient compared to prodan (Table 1). As for the fluorescence properties, all compounds display positive solvatochromism (red‐shifted fluorescence with increasing polarity). It is encouraging to note that the pronounced solvatochromism is preserved also for the compounds that do not contain the carbonyl moiety from the prodan motif (1 and 4–6; Table 1 and Supporting Information, Figures S4 and S7–S9). Compounds 2, 5, and 6 are the weakest emitters in aqueous solution (Φ F<0.01), while 3 and 4 display moderately stronger fluorescence (Φ F=0.06 and 0.03, respectively, Table 1). However, for all derivatives in less polar organic solvents (toluene and acetonitrile), the fluorescence quantum yields are significantly higher, along with a pronounced blue‐shift due to the strong solvatochromism of these fluorescent entities. In aqueous solution, it is clear that 2–6 display weaker fluorescence compared to the parent fluorophores prodan and 1. Although no redox‐data are available, a very likely explanation is photoinduced electron transfer quenching, known to be accelerated in polar media.14
Table 1.
Spectroscopic data for prodan and derivatives.
|
Compound |
Solvent |
λ abs [nm][a] |
ϵ max [M−1 cm−1] |
λ em [nm][b] |
Φ F [c] |
τ aver [ns][d] |
|---|---|---|---|---|---|---|
|
Prodan[e] |
AQ |
358 |
18 127[f] |
525 |
0.19 |
1.0 |
|
|
ACN |
352 |
nd |
457 |
0.86 |
3.4 |
|
|
Tol |
350 |
18 899 |
414 |
0.57 |
2.1 |
|
1 |
AQ[e] |
314 |
6022[f] |
437 |
0.57 |
9.3 |
|
|
ACN[g] |
325 |
nd |
424 |
0.59 |
7.1 |
|
|
Tol[g] |
325 |
5500 |
403 |
0.66 |
6.0 |
|
2 [h] |
AQ[i] |
482 |
20 926[f] |
628 |
0.001 |
nd[j] |
|
|
ACN[k] |
424 |
nd |
619 |
0.02 |
0.13 |
|
|
Tol[k] |
422 |
26 060 |
504 |
0.55 |
3.4 |
|
3 |
AQ |
375 |
13 832[f] |
528 |
0.06 |
0.77 |
|
|
ACN |
360 |
nd |
475 |
0.67 |
2.9 |
|
|
Tol |
360 |
16 080 |
432 |
0.74 |
2.0 |
|
4 |
AQ |
350 |
27 268[f] |
523 |
0.03 |
0.38 |
|
|
ACN |
348 |
nd |
456 |
0.71 |
2.4 |
|
|
Tol |
349 |
29 419 |
413 |
0.71 |
2.9 |
|
5 |
AQ[e] |
356 |
29 686[f] |
599 |
0.006 |
0.088 |
|
|
ACN[g] |
367 |
nd |
500 |
0.98 |
2.3 |
|
|
Tol[g] |
367 |
26 057 |
437 |
0.97 |
1.6 |
|
6 |
AQ[e] |
341 |
3522[f] |
433 |
0.005 |
0.051 |
|
|
ACN[g] |
360 |
nd |
417 |
0.51 |
6.6 |
|
|
Tol[g] |
359 |
3637 |
404 |
0.54 |
5.3 |
AQ=1 % DMSO in 10 mm phosphate buffer (pH 7.4). ACN=acetonitrile. Tol=toluene. nd=not determined. [a] Wavelength of absorption maximum. [b] Wavelength of emission maximum. [c] Fluorescence quantum yields were determined by taking 1,9‐diphenylanthracene in cyclohexane (Φ F=0.97) as a reference. [d] Average fluorescence lifetime. See Table S2 of the Supporting Information for complete lifetime data. An excitation wavelength of 377 nm was used for all compounds, with the exception of compound 2, for which an excitation wavelength of 405 nm was used. [e] Excitation wavelength was 350 nm. [f] Due to poor solubility in aqueous solution at high concentrations, the molar absorption coefficient was determined in DMSO. [g] Excitation wavelength was 360 nm. [h] Fluorescence quantum yields were determined by taking Rhodamine 6G in EtOH (Φ F=0.94) as a reference. [i] Excitation wavelength was 480 nm. [j] Lifetime was too short to be resolved in the single photon counting (SPC) experiment. [k] Excitation wavelength was 470 nm.
The significant decrease in fluorescence quantum yields in aqueous solution is also reflected in the fluorescence lifetimes. With the exception of 1, all derivatives display shorter lifetimes in aqueous solution compared to toluene and acetonitrile (Table 1 and Supporting Information, Table S2). These results support the notion that the internal charge transfer state of prodan and 2–6 undergo a rapid non‐radiative decay in aqueous solution.
Due to their favourable fluorescent properties in aqueous solution, 3 and 4 were evaluated for their ability to inhibit protein kinases. In efforts to gauge both the efficacy and selectivity of compounds 3 and 4, initial testing consisted of a kinome screen against a panel of 65 kinases (at 1 μm, Supporting Information, Table S3). This panel was selected to reflect that of the human kinome and included examples from each of the major kinase subfamilies. Whilst the non‐conjugated derivative 3 exhibited little to no kinase inhibition (>60 % remaining kinase activity was observed for all 65 kinases tested), the conjugated derivative 4 exhibited strong inhibitory properties towards Aurora‐A, Blk, and LCK (≤15 % remaining kinase activity). No inhibitory activity against 52 kinases (>76 % remaining kinase activity) was observed. Cell‐free IC50 assays were then performed to further assess the inhibitory properties of 4 against Aurora‐A, Blk, and LCK (Supporting Information, Table S4). Compound 4 was found to exhibit moderate activity against Aurora‐A and Blk with IC50 values of 222 nm and 554 nm, respectively, while an IC50 of 124 nm was obtained for LCK. In light of these results, 4 has emerged as an interesting molecular tool in which fluorescence can be employed to study LCK inhibition.
Given the strong solvatochromic properties of 4 and the hydrophobic active site of kinases, it was envisioned that binding of the prodan‐based LCK inhibitor 4 may result in the onset of intense blue‐shifted emission. Fluorescence titration experiments were undertaken to investigate this notion, in which aliquots of a solution of 4 were added to a solution of LCK (1 μm). Over the course of the experiment, changes in both the emission maximum and intensity were monitored and subsequently plotted to afford the corresponding binding isotherm (Figure 2 and Supporting Information, Figure S11). A dramatic increase in emission intensity as well as a blue‐shift was indeed observed upon binding LCK (at 1:1 4:LCK, emission intensity is 400‐fold higher than for unbound 4). After the addition of 1.0 equivalent of inhibitor, the curve plateaued. This strongly suggests a 1:1 binding stoichiometry to the active site. Moreover, the linear nature of the binding isotherm below this inflection point shows that the binding is near quantitative at all concentrations and infers that binding is too strong to allow for the determination of the binding constant.15 Upon increasing the amount of inhibitor, a second binding regime was observed (Supporting Information, Figure S11), likely to be explained by nonspecific binding. Displacement experiments with the non‐fluorescent ATP‐competitive LCK inhibitor TC‐S7003 (IC50=7 nm)16 strongly support the aforementioned notion. Upon titrating TC‐S7003 (0–2.0 equiv) to a 1:1 complex of 4:LCK, a dramatic decrease in emission from 4 was observed (Figure 2 C), implying that 4 binds almost exclusively to the ATP‐binding site of LCK at concentrations lower than 1 equivalent.
Figure 2.

A) Normalised emission spectra of 4 (blue) and 1:1 4:LCK (red) in Tris buffer at pH 7.5. B) Changes in intensity at 442 nm upon increasing equivalents of 4. Concentration of LCK is 1 μm. C) Changes in the emission spectrum upon the addition of TC‐S7003 to 1:1 4:LCK. Concentration of 4:LCK is 1 μm. Emission spectra before (black) and after the addition of 2.0 equiv (blue) of TC‐S7003.
Fluorescence titration experiments using JAK2 (a kinase in which 4 did not exhibit kinase activity for in the kinome screen) in place of LCK were also performed. Upon monitoring changes in the emission maximum and intensity, the resulting binding isotherm shows no signs of strong specific binding at concentrations below 1 μm (Supporting Information, Figure S13). Furthermore, significant increases in fluorescent intensity were not observed upon increasing concentration of 4 (0–30 equiv).
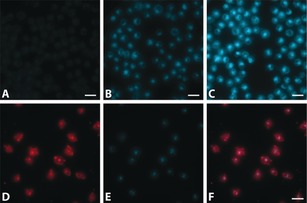
Fluorescence microscopy was used to investigate the properties of 4 in a cellular context. LCK‐positive Jurkat cells were incubated with 4 at concentrations of 5 nm–5 μm for 15 minutes (Supporting Information, Figure S16). Strong intracellular emission was observed at 0.5 and 5 μm, demonstrating rapid cellular uptake (Figure 3 B,C). The observed cellular accumulation of 4 is in agreement with the reported LCK localisation (cytosolic side of the plasma membrane, intracellular vesicles, and the Golgi apparatus).17 In a separate experiment, Jurkat cells incubated with 4 at 5 μm were co‐stained with an LCK‐specific antibody conjugated with Alexa 647 (anti‐LCK‐AF647). Partial co‐localisation was clearly observed in intracellular vesicles, suggesting that the observed emission intensities from 4 correlate with the intracellular LCK concentration (Figure 3 D,F).
Figure 3.

Images of Jurkat cells incubated for 15 mins with 4 at A) 50 nm, B) 0.5 μm, and C) 5 μm. Jurkat cells co‐stained with D) anti‐LCK‐AF647 and E) 4 (0.5 μm), with F) showing the overlay of the two channels. Scale bar: 25 μm.
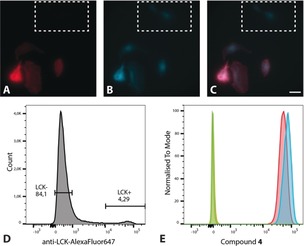
Furthermore, LCK‐negative A498 cells transfected with a plasmid encoding wild‐type untagged LCK were treated with 4 (0.5 μm), co‐stained with anti‐LCK‐AF647, and analysed using microscopy (Figure 4 A–C). In comparison to the population of non‐transfected cells (see Figure 4 A, region indicated by the white box), the transfected cells exhibited a large degree of co‐localisation of 4 with anti‐LCK‐AF647, again supporting a high affinity of 4 for LCK.
Figure 4.

Top: Images of A498 cells transfected with a plasmid encoding LCK and co‐stained with A) anti‐LCK‐AF647 and B) 4 (0.5 μm) with C) showing the overlay of the two channels. The white box shows non‐transfected cells as indicated by the absence of anti‐LCK‐AF647. Scale bar: 25 μm. Bottom: Analysis of K562 cells transfected with a plasmid encoding LCK using flow cytometry, monitoring the fluorescence of D) anti‐LCK‐AF647 from non‐transfected (LCK−) and transfected (LCK+) cells, and E) compound 4 from transfected (blue) and non‐transfected (red) cells. The orange and green peaks are the unstained controls (not treated with 4) for transfected and non‐transfected cells, respectively.
To quantify the effect of an increased LCK concentration on the emission intensity of 4, the LCK deficient cell line K562 (well‐suited for flow cytometry measurements) was electroporated with the aforementioned plasmid encoding LCK. While the efficiency of the electroporation was low (approximately 4 %), the overexpression of LCK resulted in a significant increase (40 %) in fluorescence intensity from 4 compared to the non‐transfected K562 cells. The corresponding increase in the fluorescence observed from anti‐LCK‐AF647 (around a factor of 500) is much more pronounced compared to 4. This is consistent with the microscopy results in which fluorescence from unspecific binding of 4 is seen (Figure 4 B, region indicated by white box).
In efforts to demonstrate the applicability of 4 to multiphoton fluorescence imaging, two‐photon microscopy (TPM) experiments were undertaken using the human lung cancer cell line, HTB‐177. Cells were treated with a solution of 4 at concentrations of 0.1–10 μm for 5 minutes and images were acquired following excitation at 700 nm. At concentrations of 0.5–10 μm strong intracellular emission was observed (Supporting Information, Figure S19). These results clearly demonstrate that 4 exhibits a favourable cross section for TPM experiments.
To conclude, a small ATP‐competitive LCK inhibitor (IC50=124 nm) with innate fluorescent properties has been realised through the integration of a prodan‐derived fluorophore into the pharmacophore of the kinase inhibitor. Fluorescence titration experiments with LCK demonstrate a dramatic increase in emission intensity as well as a blue‐shift of the emission maximum upon binding to LCK. Furthermore, an increase in fluorescence intensity of 4 correlates with an increase in LCK concentration, as observed in microscopy and flow cytometry experiments, while multiphoton imaging experiments in live cells demonstrated that compound 4 exhibits a favourable cross section for TPM experiments. The prodan‐derived LCK inhibitor could serve as a valuable molecular tool for real‐time intracellular studies of LCK signalling, with its unique solvatochromic properties allowing the user to distinguish between bound and unbound molecules in a cellular setting.
Conflict of interest
The authors declare no conflict of interest.
Supporting information
As a service to our authors and readers, this journal provides supporting information supplied by the authors. Such materials are peer reviewed and may be re‐organized for online delivery, but are not copy‐edited or typeset. Technical support issues arising from supporting information (other than missing files) should be addressed to the authors.
Supplementary
Acknowledgements
The authors acknowledge financial support from the European Union's Horizon 2020 programme (grant no 745626); the Swedish Research Council (grant no 2016‐03601 and 2015‐05268) and Olle Engkvist Byggmästare Foundation. We thank the Centre for Cellular Imaging at the University of Gothenburg and the National Microscopy Infrastructure, NMI (VR‐RFI2016‐00968) for providing assistance in multiphoton microscopy. We thank Dr. Anna Bäckström (KTH/SciLifeLab, Sweden), Prof. Kjetil Taskén (University of Oslo, Norway), Dr. Marco Maugeri, and Dr. Hadi Valadi (University of Gothenburg, Sweden) for providing cells. The authors would also like to thank Dr. Quirin Hammer (Karolinska Institutet, Sweden) for his valuable support regarding flow cytometry and Kyra Kuhnigk (KTH, Sweden) for assistance with some of the experiments. This work was performed in part at the Chalmers Material Analysis Laboratory.
C. L. Fleming, P. A. Sandoz, T. Inghardt, B. Önfelt, M. Grøtli, J. Andréasson, Angew. Chem. Int. Ed. 2019, 58, 15000.
Contributor Information
Prof. Morten Grøtli, Email: grotli@chem.gu.se.
Prof. Joakim Andréasson, Email: a-son@chalmers.se.
References
- 1.
- 1a. Klymchenko A. S., Acc. Chem. Res. 2017, 50, 366–375; [DOI] [PubMed] [Google Scholar]
- 1b. Klymchenko A. S., Mely Y., Prog. Mol. Biol. Transl. Sci. 2013, 113, 35–58; [DOI] [PubMed] [Google Scholar]
- 1c. Wu D., Sedgwick A. C., Gunnlaugsson T., Akkaya E. U., Yoon J., James T. D., Chem. Soc. Rev. 2017, 46, 7105–7123. [DOI] [PubMed] [Google Scholar]
- 2.
- 2a. Kucherak O. A., Didier P., Mély Y., Klymchenko A. S., J. Phys. Chem. Lett. 2010, 1, 616–620; [Google Scholar]
- 2b. Weber G., Farris F. J., Biochemistry 1979, 18, 3075–3078. [DOI] [PubMed] [Google Scholar]
- 3.
- 3a. Cohen B. E., McAnaney T. B., Park E. S., Jan Y. N., Boxer S. G., Jan L. Y., Science 2002, 296, 1700–1703; [DOI] [PubMed] [Google Scholar]
- 3b. Nitz M., Mezo A. R., Ali M. H., Imperiali B., Chem. Commun. 2002, 1912–1913. [DOI] [PubMed] [Google Scholar]
- 4.
- 4a. Kimura T., Kawai K., Majima T., Chem. Commun. 2006, 1542–1544; [DOI] [PubMed] [Google Scholar]
- 4b. Tainaka K., Tanaka K., Ikeda S., Nishiza K.-I., Unzai T., Fujiwara Y., Saito I., Okamoto A., J. Am. Chem. Soc. 2007, 129, 4776–4784. [DOI] [PubMed] [Google Scholar]
- 5.
- 5a. Bondar O. P., Rowe E. S., Biophys. J. 1999, 76, 956–962; [DOI] [PMC free article] [PubMed] [Google Scholar]
- 5b. Rottenberg H., Biochemistry 1992, 31, 9473–9481. [DOI] [PubMed] [Google Scholar]
- 6. Lei Z., Yue P., Wang X., Li X., Li Y., He H., Luo X., Meng X., Chen J., Qian X., Yang Y., Chem. Commun. 2017, 53, 10938–10941. [DOI] [PubMed] [Google Scholar]
- 7. Gaus K., Gratton E., Kable E. P., Jones A. S., Gelissen I., Kritharides L., Jessup W., Proc. Natl. Acad. Sci. USA 2003, 100, 15554–15559. [DOI] [PMC free article] [PubMed] [Google Scholar]
- 8. Kim D., Moon H., Baik S. H., Singha S., Jun Y. W., Wang T., Kim K. H., Park B. S., Jung J., Mook-Jung I., Ahn K. H., J. Am. Chem. Soc. 2015, 137, 6781–6789. [DOI] [PubMed] [Google Scholar]
- 9. Liu Y., Dong X., Sun J., Zhong C., Li B., You X., Liu B., Liu Z., Analyst 2012, 137, 1837–1845. [DOI] [PubMed] [Google Scholar]
- 10. Ferguson F. M., Gray N. S., Nat. Rev. Drug Discovery 2018, 17, 353–377. [DOI] [PubMed] [Google Scholar]
- 11.
- 11a. Kim D., Jun H., Lee H., Hong S.-S., Hong S., Org. Lett. 2010, 12, 1212–1215; [DOI] [PubMed] [Google Scholar]
- 11b. Kim D., Lee H., Jun H., Hong S.-S., Hong S., Bioorg. Med. Chem. 2011, 19, 2508–2516; [DOI] [PubMed] [Google Scholar]
- 11c. Dhuguru J., Liu W., Gonzalez W. G., Babinchak W. M., Miksovska J., Landgraf R., Wilson J. N., J. Org. Chem. 2014, 79, 4940–4947; [DOI] [PMC free article] [PubMed] [Google Scholar]
- 11d. Lee H., Landgraf R., Wilson J. N., Bioorg. Med. Chem. 2017, 25, 6016–6023. [DOI] [PubMed] [Google Scholar]
- 12. Lee J.-H., Jung K. H., Lee H., Son M. K., Yun S.-M., Ahn S.-H., Lee K.-R., Lee S., Kim D., Hong S., Hong S.-S., Oncotarget 2014, 5, 10180–10197. [DOI] [PMC free article] [PubMed] [Google Scholar]
- 13.
- 13a. Dar A. C., Das T. K., Shokat K. M., Cagan R. L., Nature 2012, 486, 80–84; [DOI] [PMC free article] [PubMed] [Google Scholar]
- 13b. Apsel B., Blair J. A., Gonzalez B., Nazif T. M., Feldman M. E., Aizenstein B., Hoffman R., Williams R. L., Shokat K. M., Knight Z. A., Nat. Chem. Biol. 2008, 4, 691–699; [DOI] [PMC free article] [PubMed] [Google Scholar]
- 13c. Burchat A. F., Calderwood D. J., Friedman M. M., Hirst G. C., Li B., Rafferty P., Ritter K., Skinner B. S., Bioorg. Med. Chem. Lett. 2002, 12, 1687–1690. [DOI] [PubMed] [Google Scholar]
- 14. Kavarnos G. J., Turro N. J., Chem. Rev. 1986, 86, 401–449. [Google Scholar]
- 15.Due to a poor signal-to-noise ratio, lower concentrations were not used.
- 16.IC50 data taken from: Martin M. W., Newcomb J., Nunes J. J., Boucher C., Chai L., Epstein L. F., Faust T., Flores S., Gallant P., Gore A., Gu Y., Hsieh F., Huang X., Kim J. L., Middleton S., Morgenstern K., Oliveira-dos-Santos A., Patel V. F., Powers D., Rose P., Tudor Y., Turci S. M., Welcher A. A., Zack D., Zhao H., Zhu L., Zhu X., Ghiron C., Ermann M., Johnston D., Pierre Saluste C.-G., J. Med. Chem. 2008, 51, 1637–1648. [DOI] [PubMed] [Google Scholar]
- 17.
- 17a. Soares H., Henriques R., Sachse M., Ventimiglia L., Alonso M. A., Zimmer C., Thoulouze M.-I., Alcover A., J. Exp. Med. 2013, 210, 2415–2433; [DOI] [PMC free article] [PubMed] [Google Scholar]
- 17b. Zimmermann L., Paster W., Weghuber J., Eckerstorfer P., Stockinger H., Schütz G. J., J. Biol. Chem. 2010, 285, 6063–6070; [DOI] [PMC free article] [PubMed] [Google Scholar]
- 17c. Antón O., Batista A., Millán J., Andrés-Delgado L., Puertollano R., Correas I., Alonso M. A., J. Exp. Med. 2008, 205, 3201–3213; [DOI] [PMC free article] [PubMed] [Google Scholar]
- 17d. Bijlmakers M.-J. J. E., Isobe-Nakamura M., Ruddock L. J., Marsh M., J. Cell Biol. 1997, 137, 1029–1040. [DOI] [PMC free article] [PubMed] [Google Scholar]
Associated Data
This section collects any data citations, data availability statements, or supplementary materials included in this article.
Supplementary Materials
As a service to our authors and readers, this journal provides supporting information supplied by the authors. Such materials are peer reviewed and may be re‐organized for online delivery, but are not copy‐edited or typeset. Technical support issues arising from supporting information (other than missing files) should be addressed to the authors.
Supplementary


