Abstract
The host immune response is characterized by a complex interplay of signal‐specific cellular transcriptional responses. The magnitude of the immune response is dependent on the strength of the external stimulus. Knowledge on leukocyte transcriptional responses altered in response to different stimulus dosages in man is lacking. Here, we sought to identify leukocyte transcriptional signatures dependent on LPS dose in humans. Healthy human volunteers were administered 1 ng/kg (n = 7), 2 ng/kg (n = 6), or 4 ng/kg (n = 7) LPS intravenously. Blood was collected before (pre‐LPS) and 4 h after LPS administration. Total RNA was analyzed by microarrays and generalized linear models. Pathway analysis was performed by using Ingenuity pathway analysis. Leukocyte transcriptomes altered per LPS dosage were predominantly shared, with 47% common signatures relative to pre‐LPS. A univariate linear model identified a set of 3736 genes that exhibited a dependency on differing LPS dosages. Neutrophil, monocyte, and lymphocyte counts explained 38.9% of the variance in the LPS dose‐dependent gene set. A multivariate linear model including leukocyte composition delineated a set of 295 genes with a dependency on LPS dose. Evaluation of the 295 gene signature in patients with sepsis due to abdominal infections showed significant correlations. Promoter regions of the LPS dose gene set were enriched for YY1, EGR1, ELK1, GABPA, KLF4, and REL transcription factor binding sites. Intravenous injection of 1, 2, or 4 ng/kg LPS was accompanied by both shared and distinct leukocyte transcriptional alterations. These data may assist in assessing the severity of the insult in patients with abdominal sepsis.
Keywords: immune response, blood, genomics
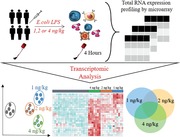
Shared and distinct leukocyte transcriptional signatures in response to different LPS dosages in human endotoxemia.
Abbreviations
- MDS
multidimensional scaling
- PCA
principal component analysis
- RIN
RNA integrity number
1. INTRODUCTION
The host immune response is characterized by dynamic signal‐specific transcriptional responses that convey specific biologic functions. The magnitude of the immune response is dependent on the strength of the external stimulus. LPS (endotoxin) is part of the outer membrane of Gram‐negative bacteria and a potent activator of immune cells.1, 2 LPS induces a robust inflammatory response after its recognition by the myeloid differentiation protein (MD)2, TLR4, and cluster of differentiation (CD)14 macromolecular complex.3 High doses of LPS have been shown to cause septic shock,4, 5 whereas low doses of circulating LPS may contribute to the development of chronic diseases with nonresolving inflammation.6, 7, 8 Systems‐based analyses of the cellular mechanisms that control the dose–response to LPS in vivo are lacking.
The leukocyte genomic responses that ensue in the human endotoxemia model typically recapitulate a proportion of the leukocyte genomic response in sepsis and septic shock.5 This in vivo model of acute systemic inflammation in a controlled clinical setting is initiated by intravenous administration of a specific dose of Escherichia coli‐derived LPS in healthy subjects.6, 7, 8, 9 LPS doses at or below 4 ng/kg represent standard low doses known to elicit acute systemic inflammation.7, 10 In the context of severe infection leading to organ failure (sepsis and septic shock), median levels of systemic LPS levels in patients were estimated at 20 ng/kg.11 LPS induces substantial alterations to leukocyte cell composition as well as gene transcription.8, 9, 12, 13 In the early phase of human endotoxemia, monocytes and lymphocytes typically diminish in numbers, whereas neutrophil counts increase dramatically. Moreover, LPS induces extensive shifts in leukocyte gene transcription, with genes involved in pro‐, anti‐inflammatory, pattern recognition, T cell activation signaling, and metabolic pathways typically altered.8, 9, 13 The effect of different LPS dosages on the cellular and transcriptional alterations that ensue in the setting of human endotoxemia is underexplored.
In this study, we evaluated the leukocyte transcriptomes of healthy subjects in human endotoxemia to identify transcriptional signatures and pertaining biologic pathways that show a dependency on LPS dose. Both univariate and multivariate models for incorporating leukocyte cell composition were tested. Furthermore, we predict the existence of key transcription factors that may orchestrate the dose‐dependent leukocyte response that could, in turn, impart differential programming of innate leukocytes.
2. METHODS
2.1. Human endotoxemia model and microarrays
Caucasian male volunteers were given a single bolus of 1 ng/kg (n = 7), 2 ng/kg (n = 6), or 4 ng/kg (n = 7) E. coli LPS (US standard reference endotoxin, kindly provided by Anthony Suffredini, National Institute of Health, Bethesda, MD) and monitored for the duration of 24 h (Supplemental Table 1). Blood was collected before (n = 20) and 4 h after LPS administration in PAXgene blood tubes (Qiagen, Venlo, the Netherlands). Total RNA was isolated by means of the PAXgene blood RNA isolation kit (Qiagen) according to the manufacturer's instructions. Total RNA (RNA integrity number (RIN) > 6.0) was processed and hybridized to microarray chips according to Affymetrix or Illumina specifications. The 1 ng/kg (accession: GSE36177)9 and 4 ng/kg (accession: GSE48119)14 samples were hybridized to the Illumina HumanHT‐12 V3.0 expression beadchip. The 2 ng/kg LPS samples (accession: GSE108685)13 were hybridized to Affymetrix human genome U219 96‐array chips. Written informed consent was obtained from all subjects. All studies, data, and ethical statements were collected and handled in accordance with institutional guidelines and ethics committees.
2.2. Sepsis patients and microarrays
Publicly available microarray data from the Molecular diAgnosis and Risk stratification in Sepsis (MARS) project were included (GSE65682).15, 16, 17, 18, 19 Specifically, critically ill patients diagnosed with abdominal sepsis having blood culture‐proven E.coli infection (n = 33) were selected.16 Blood was collected in PAXgene blood tubes (Becton‐Dickinson, Breda, The Netherlands) on ICU admission. After providing written informed consent, PAXgene blood was also obtained from 42 healthy controls (age range, 30–63 years; 24 males, 18 females).
2.3. Microarray data analysis and pathway enrichment
Microarray datasets from the 3 different platforms were combined for analysis by firstly remapping the oligonucleotide probe sequences using Bowtie220 to the current Genome Reference Consortium Human genome Build 38 patch release 7 (GRCh38.p7) available via GenCode.21 A total of 597,320 probe sequences were processed with 498,476 sequences (83.45%) aligning exactly one time to the reference genome (perfect match). Perfect match sequences were annotated by means of Biomart22 specifying GRCh38.p7 as genome build. Sequences were subsequently annotated by “biotype.” We selected “protein coding” biotypes for further analysis, which equated to 57,160 sequences, and further annotated by Ensembl transcript names. The 3 microarray datasets were subsequently merged by transcript name. Data were background corrected, quantile normalized, summarized by median polish, and log2‐transformed by means of the robust multiaverage Affy method.23 Normalized data were then adjusted for nonexperimental chip effects using the empirical Bayesian method combat.24 Transcripts were collapsed to unique genes by calculating the mean expression of transcripts from the same gene locus, which resulted in 12,976 gene expression values. Data were inspected before and after normalization by means of principal component analysis (PCA) and multidimensional scaling (MDS).25, 26 To determine overrepresented transcription factor (TF) binding sites, single site analysis was performed using oPOSSUM.27 The promoter regions were analyzed searching 2000 base pairs up‐ and down‐stream of the transcription start sites of genes grouped as high or low expression relative to pre‐LPS. TF binding site enrichment was demarcated using a Fisher score threshold (mean + 1*standard deviation). The significantly enriched TF was explored in publicly available ENCODE TF ChIP‐Seq data.28, 29 Pathway analysis was performed by means of Ingenuity Pathway Analysis (Qiagen) specifying Ingenuity knowledgebase as reference set and human species. All other parameters were default.
2.4. Statistics
Microarray data were analyzed by moderated t statistics and f statistics implemented in the limma package.30 Probabilities were adjusted for multiple comparisons by Benjamini–Hochberg's method.31 Effect size was estimated by means of Cohen's D method.32 Correlations were calculated using the Spearman's rho. Differences in WBC counts between pre‐ and post‐LPS samples were analyzed using Kruskal‐Wallis test and Wilcoxon's rank sum test. The proportion of variance in gene expression explained by WBC counts and differentials was calculated using linear models implemented in the variancePartition method.33 We present data in the form of volcano plots, heatmap plots, violin plots, hierarchical clustering trees, bar plots, and box plots. Statistical analysis was performed in the R statistical environment (version 3.5.1 R Foundation for Statistical Computing, Vienna, Austria).
3. RESULTS AND DISCUSSION
3.1. Shared and distinct leukocyte transcriptional responses to varying LPS doses
MDS of all genes (n = 12,976) across LPS doses revealed clear partitioning between pre‐LPS (T = 0 h) and post‐LPS samples (T = 4 h) (Fig. 1A). Of note, pre‐LPS samples clustered as 1 group, indicating optimal adjustment for nonexperimental chip effects. Furthermore, clustering between LPS doses was observed (Fig. 1A). Analysis of gene expression in 1, 2, or 4 ng/kg LPS administered samples (T = 4 h) relative to baseline (pre‐LPS, T = 0 h) uncovered 3007, 2382, and 3452 significantly altered genes (BH adjusted P value < 0.01 and fold change cutoffs > 1.5 or ← 1.5), respectively (Fig. 1B). A proportion of gene expression indices were similarly altered across the 3 doses of LPS, with 2422 (47.2%) common genes and strong correlations observed between fold changes of the 3 LPS doses (Fig. 1C and D). This analysis also identified 970, 777, and 967 genes distinct to the 1, 2, or 4 ng/kg LPS dose–response, respectively (Fig. 1C). Pathway analysis of the genes encompassing the common transcriptional response revealed high expression genes associated with typical proinflammatory signaling pathways, which included IL‐6 and IL‐10 signaling, as well as NF‐κB signaling, death receptor signaling, and TLR signaling (Fig. 1E). Genes with reduced expression associated with a variety of lymphocyte signaling pathways, such as CD28 signaling in T‐helper cells, T cell receptor signaling, as well as protein translation and metabolic pathways that included eukaryotic translation initiation factor 2 (EIF2) signaling, mitochondrial dysfunction, and mechanistic target of rapamycin kinase (mTOR) signaling (Fig. 1E).
Figure 1.
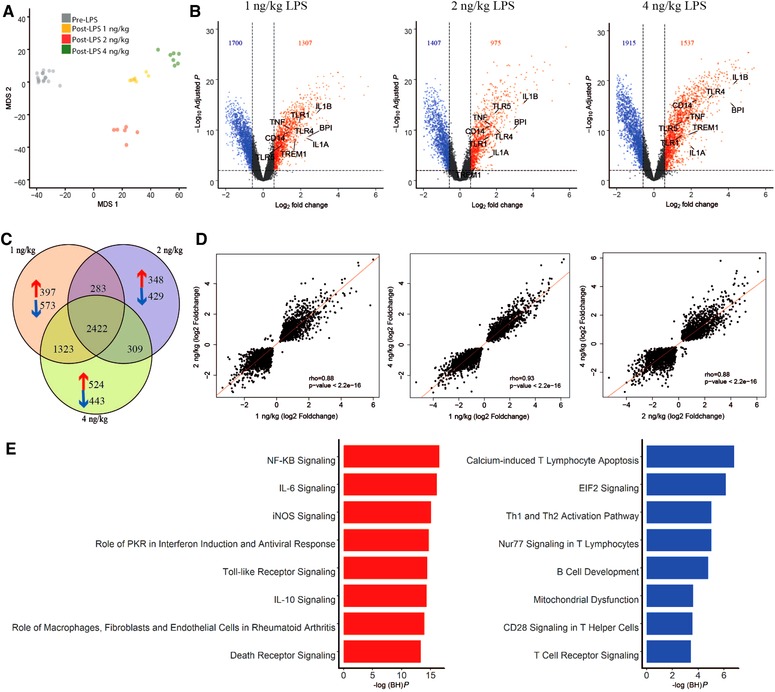
Genome‐wide analysis of shared and distinct leukocyte responses across LPS doses relative to baseline. (A) Multidimensional scaling (MDS) plot of all genes across LPS doses (post‐LPS samples (T = 4 h)) relative to pre‐LPS (T = 0 h). (B) Volcano plot (integrating log2 fold changes and multiple comparison adjusted P values) representing the transcriptional changes that occur at 1, 2, and 4 ng LPS (T = 4) compared with pre‐LPS (T = 0). Numbers in top left and right corners indicate number of genes with significantly differential expression, up‐regulated (red) or down‐regulated (blue). Horizontal line represents the multiple‐test adjusted significance threshold (P < 0.01) and vertical line represents the log fold change (FC = ±0.58). Gray dots show the genes that were not significantly overexpressed or under expressed according to this threshold. (C) Venn–Euler representation of differentially expressed genes in 1, 2, and 4 ng post‐LPS versus pre‐LPS. Red arrows denote overexpressed genes; blue arrows denote under expressed genes and the numbers show the common genes among different dosages. (D) Dot plot depicting the correlation (rho, Spearman correlation coefficient) between the common responses between 1 ng versus 2 ng, 1 ng versus 4 ng, and 2ngversus 4 ng. (E) Ingenuity pathway analysis of the common response gene expression signatures in all the doses relative to baseline. Red bars, overexpressed pathways; blue bars, under expressed pathways
3.2. Leukocyte transcriptional signatures dependent on LPS dose
In order to identify a gene expression signature that is dependent on LPS dose, we compared the leukocyte transcriptomes of the 1, 2, and 4 LPS doses using f statistics (ANOVA). We identified a set of 3114 genes significantly altered (BH adjusted P value < 0.01) between LPS doses. Figure 2A depicts the top significant genes ranked by means of Cohen's D effect size estimate. Genes showing increased expression in response to different LPS doses included antimicrobial molecules, for example, S100 calcium binding protein A8 (S100A8) and A9 (S100A9), members of the major histocompatibility complex, for example, HLA‐E, and initial triggers of complement activation, for example, ficolin 1 (FCN1). The majority of genes with reduced expression across LPS doses encoded for ribosomal proteins and/or their subunits, for example, ribosomal protein L30 (RPL30), L18 (RPL18), and L12 (RPL12), as well as glycolysis and mitochondrial enzymes, for example, enolase 1 (ENO1) and ATP synthase F1 subunit beta (ATP5B) (Fig. 2A). Pathway analysis of 1845 genes showing increased expression indices in response to higher doses of LPS associated with various canonical signaling pathways that included death receptor signaling, triggering receptor expressed on myeloid cells 1 (TREM1) signaling, protein ubiquitination, NF‐KB signaling, and IL‐6 signaling (Fig. 2B and Supplementary Fig. 1A). Genes that showed decreased expression patterns in response to higher LPS doses (n = 1269) associated with metabolic pathways, for example, oxidative phosphorylation, mTOR signaling, and mitochondrial dysfunction, and lymphocyte signaling pathways including calcium‐induced T lymphocyte apoptosis, T cell receptor signaling, and CD28 signaling in T helper cells (Fig. 2B and Supplementary Fig. 1B). In concordance with previous studies,8, 9 upon LPS injection, a substantial alteration in protein translation, modification, and mitochondrial related processes, including cell death, protein ubiquitination, EIF2 signaling, oxidative phosphorylation, and mitochondrial dysfunction pathways was observed. Moreover, the data of this project suggest that these pathways may be quantitatively dependent on the dose of LPS. Dysfunction in mitochondrial processes has been implicated in the severity and outcome of sepsis, representing an important underlying factor in the pathobiology of immune paralysis in sepsis patients.17
Figure 2.
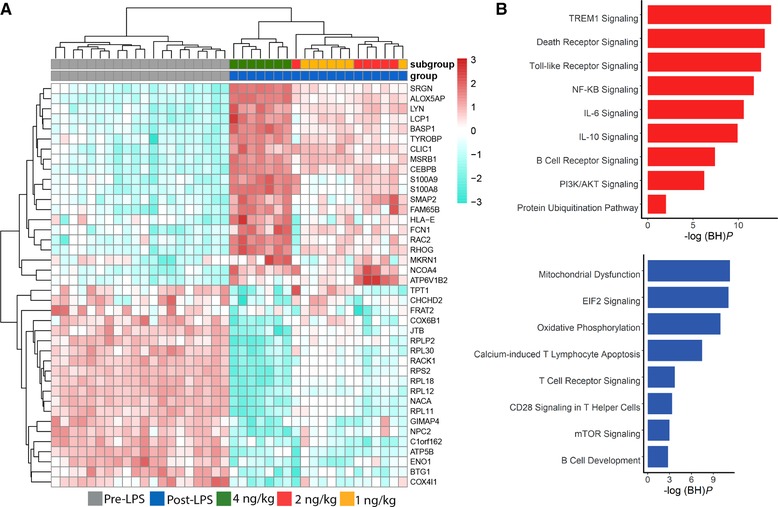
LPS dose‐dependent leukocyte response. (A) Heatmap plot of the top significant genes (ranked by Cohen's D effect size estimate) representing the transcriptional profile of the responses to LPS doses. Columns depict samples; rows depict gene expression indices. Red denotes overexpression; blue denotes under expression. (B) Ingenuity pathway analysis of genes that showed increased expression (red) and decreased expression (blue) in response to higher doses of LPS. –log (BH)P = negative log10‐transformed BH‐adjusted Fisher exact P value
3.3. Leukocyte transcriptomes, cell composition, and LPS dose
Human endotoxemia is typically accompanied by substantial alterations to leukocyte cell composition.9, 13 Here, we sought to understand the contribution of leukocyte cell composition on the LPS dose‐dependent transcriptional response. LPS induced a substantial increase in total WBC counts, which was mainly due to high counts of neutrophils concomitant with diminished monocyte and lymphocyte counts (Fig. 3A and Supplementary Table 2). Lymphocyte and monocyte counts also showed significant reductions dependent on LPS dose (Fig. 3A). Next, we fit a linear model for each individual gene incorporating neutrophil, monocyte, and lymphocyte counts to estimate the proportion of explainable variance at gene‐level resolution. Variation in neutrophil, monocyte, and lymphocyte counts cumulatively explained 38.9% of variance in gene expression (Fig. 3B). Lymphocyte counts explained the highest proportion of gene expression variation with a median of 18.59% (95% CI: 6.42%–39.45%), followed by monocyte counts with 12.83% (95% CI: 2.16%–34.29%) and neutrophil counts having 7.45% (95% CI: 2.03%–19.31%) (Fig. 3B). Residual variance equated to 36.03% (95% CI: 21.8%–60.43%). Fitting a multivariate linear model including leukocyte gene expression (1, 2, and 4 ng/kg LPS doses), neutrophil, monocyte, lymphocyte counts, as well as nonexperimental batch uncovered a gene set of 295 significantly altered genes (BH adjusted P value < 0.01; Fig. 3C). Catering for gene annotations alone does not in itself solve the inevitable problem of batch effects in high dimensional data. For this reason, we chose to not only adjust for batch effects due to microarray platform (Affymetrix or Illumina) but also including batch in a multivariate linear model. In so doing, we properly addressed nonexperimental batch effects in the microarray data. The batch adjustment in our data preprocessing steps was accomplished by using the empirical Bayesian method for factor correction, combat.24
Figure 3.
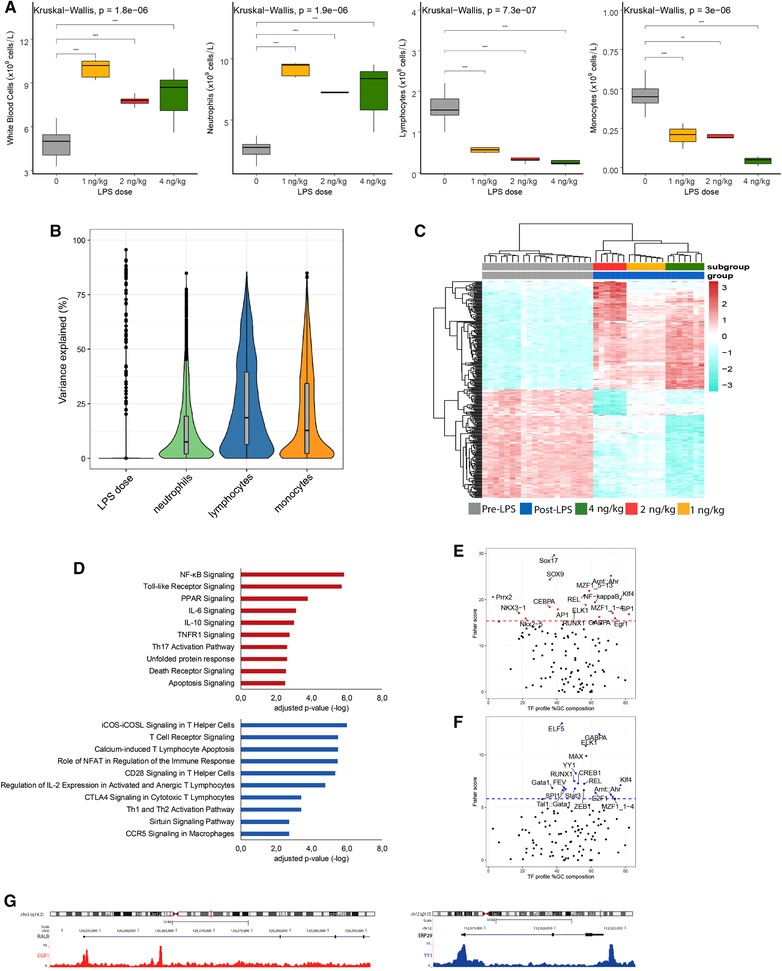
Leukocyte transcriptomics, cell composition, and LPS dose‐dependent response. (A) Total WBCs, neutrophils, lymphocytes, and monocytes significant differences between the baseline and post‐LPS groups: *P < 0.05, **P < 0.01, ***P < 0.001, and ns (not significant). (B) The proportion of explainable variance at gene level. (C) Heatmap plot of the highly and lowly expressed genes from the 295 genes signature (ranked by Cohen's D effect size estimate) identified in a multivariate linear model that accounted for neutrophil, monocyte, lymphocyte counts, and nonexperimental batch. (D) Bar graphs showing significantly enriched ingenuity canonical signaling pathways considering overexpressed genes (red bars) or underexpressed genes (blue bars) (E). Single‐site analysis with oPOSSUM, using high expressed genes, revealing the overrepresented transcription factor binding motifs. The dotted line is the Fisher score threshold (mean + 1*standard deviation). (F) Single‐site analysis with oPOSSUM, using low expressed genes, revealing the overrepresented transcription factor binding motifs. (G) A genome browser snapshot showing CHIP‐peaks for EGR1 and YY1 transcription factors in RALB and ERP29 genes
Pathway analysis of the 149 genes with elevated expression in response to higher LPS doses uncovered a significant association to pro‐, anti‐inflammatory pathways, including NF‐kB signaling, IL‐6, IL‐10 signaling, as well as TLR signaling, death receptor, and apoptosis signaling (Fig. 3D). The 146 genes with reduced expression associated with predominantly lymphocyte signaling pathways that included T cell receptor signaling, CD28 signaling in T helper (Th) cells, Th1 and Th2 activation pathways (Fig. 3D). Our findings suggest that a proportion of these processes, notably translation initiation via the EIF2 signaling genes and cell death (death receptor signaling), may be under quantitative control of TLR4 signaling. The EIF2 signaling pathway is understood to represent a type of cellular stress response pathway that reduces general protein synthesis in times of stress.34 Furthermore, this pathway has been shown to influence the release of proinflammatory cytokines.34 The death receptor family, which is part of the TNF receptor superfamily can be triggered by death ligands to result in apoptotic or survival signals.35
Next, we evaluated enrichment of TFs in promoter regions of the 295 significantly altered genes, split as either high expression (n = 146 genes) or low expression (n = 149 genes) relative to pre‐LPS. This analysis revealed SOX9, SOX17, NF‐κB, EGR1, and CEBPA were enriched in high expression genes (Fig. 3E), whereas ELF5, YY1, Gata1, and SPI1 were highly enriched TFs in the low expression genes (Fig. 3F). Figure 3G illustrates CHIP peaks for EGR1 and YY1 TFs in top ranked (Cohen's D > = 0.5) genes RALB (high expression) and ERP29 (low expression). A comprehensive list of CHIP‐seq data showing enrichment of TFs is provided in Supplementary Table 3.
3.4. LPS dose dependent gene signature and sepsis
In order to provide relevance of our data to critical illness due to sepsis, we evaluated leukocyte transcriptomes of patients with abdominal sepsis having blood culture positive E. coli infections. First, we compared sepsis patients to healthy controls and, second, we used the resultant gene expression fold changes to test the correlation to LPS dose‐dependent signature. Considering multiple test corrected probabilities (adjusted P < 0.01), we found 4228 significantly different gene expression profiles between sepsis patients and healthy subjects (Fig. 4A). Comparing the fold expression of the 295 gene set across the 3 LPS dose–responses (as compared to pre‐LPS) to fold expression in sepsis patients (relative to healthy subjects) revealed significant correlations (Fig. 4B). PCA of the 295 gene set revealed distinct clusters of sepsis patients and healthy subjects with explainable variance of 54% and 11.8% (Fig. 4C). Unsupervised hierarchical clustering also showed heterogeneity across sepsis patients (Fig. 4D). This raises the intriguing possibility that the LPS dose–response gene set may be useful in classifying sepsis patients according to bacterial burden and/or differences in systemic LPS concentrations. Further tests to identify robust clusters of sepsis patients on the basis of the LPS dose–response gene set and their relation to microbiologic data are warranted.
Figure 4.
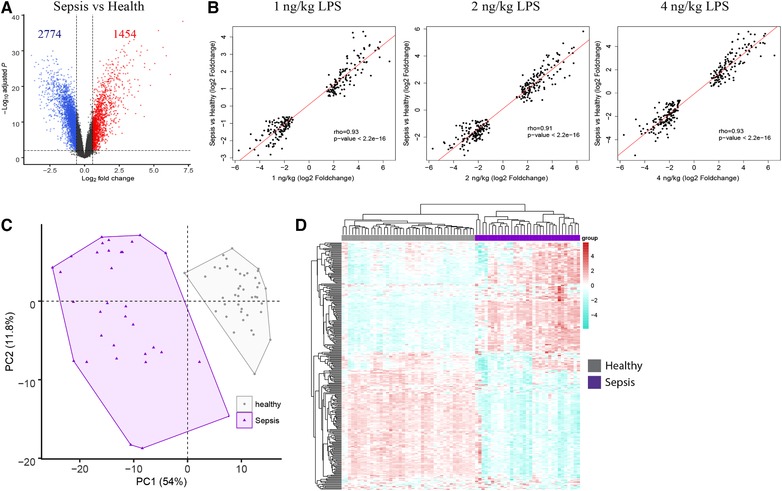
Comparison of LPS dose‐dependent signature genes to sepsis due to abdominal Escherichia coli infections. (A) Volcano plot depicting the differences in gene expression of sepsis patients relative to healthy subjects. Horizontal line represents the multiple‐test adjusted significance threshold (P < 0.01) and vertical line represents the log fold change (FC = ±0.58). (B) Dot plot depicting the correlation (rho, Spearman correlation coefficient) comparing the 295 gene set in 1, 2, and 4 ng/kg LPS dosages to sepsis patients relative to health. (C) Principal component analysis (PCA) of the 295 gene LPS dose–response signature in sepsis patients and healthy subjects. (D) Unsupervised heatmap plot of the 295 gene signature in sepsis patients. Columns depict samples; rows depict gene expression indices. Red denotes overexpression; blue denotes underexpression
3.5. Study limitations
Our study has strengths and limitations. We provide a benchmark to identify quantitative transcriptional signatures in response to higher doses of LPS in human endotoxemia. Our analysis was restricted to only male volunteers. This is primarily adopted so as to minimize the variability due to menstrual cycles in the model. We only studied one time point after LPS injection; we and others previously showed that while LPS‐induced gene expression is time dependent in this human model, the 4‐h time point encompasses most of the differentially expressed genes.8, 13 The complexity of whole blood, encompassing various cell types, precludes the identification of cell‐specific factors in response to incremental doses of LPS.
4. CONCLUSIONS
We identified shared and distinct transcriptional signatures and pertaining cellular biologic pathways that responded quantitatively to different LPS doses. Genes involved in NF‐kB signaling, IL‐6, IL‐10 signaling, TLR signaling, death receptor signaling, as well as T cell receptor signaling, Th1 and Th2 activation pathways represented major canonical signaling pathways influenced by LPS dose. Evaluation of the LPS dose–response signature in sepsis patients and the relation to bacterial burden is warranted.
DISCLOSURES
The authors declare no conflicts of interest.
Supporting information
Supporting Figure
Supporting Table
Supporting Table
AUTHORSHIP
B.P.S. conceived and designed the study. H.N.K., L.S., D.P., and A.J.vdM performed the experiments. H.N.K., L.S., A.H.Z., and B.P.S. analyzed the data. P.N., M.F., M.T., T.vdP contributed with the reagents/materials/analysis tools. B.P.S. and H.N.K. wrote the paper.
ACKNOWLEDGMENTS
We would like to thank all volunteers who took part in this study and the nursing staff of the Clinical Research Unit of the Academic Medical Center in Amsterdam.
Khan HN, Perlee D, Schoenmaker L, et al. Leukocyte transcriptional signatures dependent on LPS dosage in human endotoxemia. J Leukoc Biol. 2019;106:1153–1160. 10.1002/JLB.4A0219-050R
REFERENCES
- 1. Morris MC, Gilliam EA, Button J, Li L. Dynamic modulation of innate immune response by varying dosages of lipopolysaccharide (LPS) in human monocytic cells. J Biol Chem. 2014;289:21584‐21590. [DOI] [PMC free article] [PubMed] [Google Scholar]
- 2. Yuan R, Geng S, Li L. Molecular mechanisms that underlie the dynamic adaptation of innate monocyte memory to varying stimulant strength of TLR ligands. Front Immunol. 2016;7:497. [DOI] [PMC free article] [PubMed] [Google Scholar]
- 3. Park BS, Lee JO. Recognition of lipopolysaccharide pattern by TLR4 complexes. Exp Mol Med. 2013;45:e66. [DOI] [PMC free article] [PubMed] [Google Scholar]
- 4. Marshall JC. Why have clinical trials in sepsis failed?. Trends Mol Med. 2014;20:195‐203. [DOI] [PubMed] [Google Scholar]
- 5. Seok J, Warren H, Cuenca AG, et al. Genomic responses in mouse models poorly mimic human inflammatory diseases. Proc Natl Acad Sci USA. 2013;110:3507‐3512. [DOI] [PMC free article] [PubMed] [Google Scholar]
- 6. Hesse DG, Tracey KJ, Fong Y, et al. Cytokine appearance in human endotoxemia and primate bacteremia. Surg Gynecol Obstet. 1988;166:147‐153. [PubMed] [Google Scholar]
- 7. Lowry SF. Human endotoxemia: a model for mechanistic insight and therapeutic targeting. Shock. 2005;24(Suppl 1):94‐100. [DOI] [PubMed] [Google Scholar]
- 8. Calvano SE, Xiao W, Richards DR, et al. A network‐based analysis of systemic inflammation in humans. Nature. 2005;437:1032‐1037. [DOI] [PubMed] [Google Scholar]
- 9. Scicluna BP, van ’t Veer C, Nieuwdorp M, et al. Role of tumor necrosis factor‐alpha in the human systemic endotoxin‐induced transcriptome. PLoS One. 2013;8:e79051. [DOI] [PMC free article] [PubMed] [Google Scholar]
- 10. van Deventer SJ, Buller HR, ten Cate JW, Aarden LA, Hack CE, Sturk A. Experimental endotoxemia in humans: analysis of cytokine release and coagulation, fibrinolytic, and complement pathways. Blood. 1990;76:2520‐2526. [PubMed] [Google Scholar]
- 11. Opal SM, Scannon PJ, Vincent JL, et al. Relationship between plasma levels of lipopolysaccharide (LPS) and LPS‐binding protein in patients with severe sepsis and septic shock. J Infect Dis. 1999;180:1584‐1589. [DOI] [PubMed] [Google Scholar]
- 12. Tak T, van Groenendael R, Pickkers P, Koenderman L. Monocyte subsets are differentially lost from the circulation during acute inflammation induced by human experimental endotoxemia. J Innate Immun. 2017;9:464‐474. [DOI] [PMC free article] [PubMed] [Google Scholar]
- 13. Perlee D, van Vught LA, Scicluna BP, et al. Intravenous infusion of human adipose mesenchymal stem cells modifies the host response to lipopolysaccharide in humans: a randomized, single‐blind, parallel group, placebo controlled trial. Stem Cells. 2018;36:1778‐1788. [DOI] [PubMed] [Google Scholar]
- 14. van der Meer AJ, Scicluna BP, Moerland PD, et al. The selective sirtuin 1 activator SRT2104 reduces endotoxin‐induced cytokine release and coagulation activation in humans. Crit Care Med. 2015;43:e199‐202. [DOI] [PubMed] [Google Scholar]
- 15. Scicluna BP, Klein Klouwenberg PM, van Vught LA, et al. A molecular biomarker to diagnose community‐acquired pneumonia on intensive care unit admission. Am J Respir Crit Care Med. 2015;192:826‐835. [DOI] [PubMed] [Google Scholar]
- 16. Scicluna BP, Wiewel MA, van Vught LA, et al. A molecular biomarker to assist in diagnosing abdominal sepsis upon intensive care unit admission. Am J Respir Crit Care Med. 2017. In press. [DOI] [PubMed] [Google Scholar]
- 17. Cheng SC, Scicluna BP, Arts RJ, et al. Broad defects in the energy metabolism of leukocytes underlie immunoparalysis in sepsis. Nat Immunol. 2016;17:406‐413. [DOI] [PubMed] [Google Scholar]
- 18. van Vught LA, Klein Klouwenberg PM, Spitoni C, et al. Incidence, risk factors, and attributable mortality of secondary infections in the intensive care unit after admission for sepsis. JAMA. 2016;315:1469‐1479. [DOI] [PubMed] [Google Scholar]
- 19. Scicluna BP, Klein Klouwenberg PM, van Vught LA, et al. A molecular biomarker to diagnose community‐acquired pneumonia on intensive care unit admission. Am J Respir Crit Care Med. 2015;192:826‐835. [DOI] [PubMed] [Google Scholar]
- 20. Langmead B, Salzberg SL. Fast gapped‐read alignment with Bowtie 2. Nat Methods. 2012;9:357‐359. [DOI] [PMC free article] [PubMed] [Google Scholar]
- 21. Harrow J, Frankish A, Gonzalez JM, et al. GENCODE: the reference human genome annotation for The ENCODE Project. Genome Res. 2012;22:1760‐1774. [DOI] [PMC free article] [PubMed] [Google Scholar]
- 22. Durinck S, Spellman PT, Birney E, Huber W. Mapping identifiers for the integration of genomic datasets with the R/Bioconductor package biomaRt. Nat Protoc. 2009;4:1184‐1191. [DOI] [PMC free article] [PubMed] [Google Scholar]
- 23. Gautier L, Cope L, Bolstad BM, Irizarry RA. affy ‐ analysis of Affymetrix GeneChip data at the probe level. Bioinformatics. 2004;20:307‐315. [DOI] [PubMed] [Google Scholar]
- 24. Johnson SB, Lissauer M, Bochicchio GV, Moore R, Cross AS, Scalea TM. Gene expression profiles differentiate between sterile SIRS and early sepsis. Ann Surg. 2007;245:611‐621. [DOI] [PMC free article] [PubMed] [Google Scholar]
- 25. Jolliffe IT, Cadima J. Principal component analysis: a review and recent developments. Philos Transact A Math Phys Eng Sci. 2016;374:20150202. [DOI] [PMC free article] [PubMed] [Google Scholar]
- 26. Cox TF. Multidimensional scaling used in multivariate statistical process control. J Appl Stat. 2001;28:365‐378. [Google Scholar]
- 27. Ho Sui SJ, Mortimer JR, Arenillas DJ, et al. oPOSSUM: identification of over‐represented transcription factor binding sites in co‐expressed genes. Nucleic Acids Res. 2005;33:3154‐3164. [DOI] [PMC free article] [PubMed] [Google Scholar]
- 28. Consortium EP. The ENCODE (ENCyclopedia Of DNA Elements) Project. Science. 2004;306:636‐640. [DOI] [PubMed] [Google Scholar]
- 29. Consortium EP. An integrated encyclopedia of DNA elements in the human genome. Nature. 2012;489:57‐74. [DOI] [PMC free article] [PubMed] [Google Scholar]
- 30. Ritchie ME, Phipson B, Wu D, et al. limma powers differential expression analyses for RNA‐sequencing and microarray studies. Nucleic Acids Res. 2015;43:e47. [DOI] [PMC free article] [PubMed] [Google Scholar]
- 31. Benjamini Y, Hochberg Y, Controlling the false discovery rate ‐ a practical and powerful approach to multiple testing. J R Stat Soc B. 1995;57:289‐300. [Google Scholar]
- 32. Cohen J. Statistical power analysis for the behavioral sciences. Hillsdale, NJ: Lawrence Earlbaum Associates; 1988. [Google Scholar]
- 33. Hoffman GE, Schadt EE. variancePartition: interpreting drivers of variation in complex gene expression studies. BMC Bioinformatics. 2016;17:483. [DOI] [PMC free article] [PubMed] [Google Scholar]
- 34. Shrestha N, Bahnan W, Wiley DJ, Barber G, Fields KA, Schesser K. Eukaryotic initiation factor 2 (eIF2) signaling regulates proinflammatory cytokine expression and bacterial invasion. J Biol Chem. 2012;287:28738‐28744. [DOI] [PMC free article] [PubMed] [Google Scholar]
- 35. Aggarwal BB. Signalling pathways of the TNF superfamily: a double‐edged sword. Nat Rev Immunol. 2003;3:745‐756. [DOI] [PubMed] [Google Scholar]
Associated Data
This section collects any data citations, data availability statements, or supplementary materials included in this article.
Supplementary Materials
Supporting Figure
Supporting Table
Supporting Table


