

Abstract
Although the mortality rate due to hepatocellular carcinoma (HCC) has been gradually decreasing in Japan, approximately 30 000 people died of HCC in 2016. In 2007, the dominant etiology was persistent hepatitis C virus (HCV) infection, which accounted for 65% of total HCC deaths, and 15% of cases were due to chronic hepatitis B virus (HBV) infection. In managing chronic HBV and HCV infection, it is critically important to know the exact number of infected individuals in a particular country, which then assists in evaluating medical and financial needs in the foreseeable future. Therefore, from an epidemiological perspective, we estimated the numbers of HBV and HCV carriers in four categories: (i) undiagnosed carriers; (ii) carriers who were already hospitalized as patients or were receiving outpatient medical attention; (iii) diagnosed carriers who had not consulted any medical facility, or had discontinued consultation; and (iv) newly infected carriers. From these estimates we determined the current HBV and HCV burden and then reviewed the existing countermeasures for their prevention and control in Japan. While continuing the surveillance on the dynamics of hepatitis virus infections linked with preventive measures against hepatitis virus infection, it is crucially important to promote appropriate measures for each of the four groups of hepatitis virus carriers in society.
Keywords: countermeasure, epidemiology, hepatitis B virus, hepatitis C virus, Japan
Introduction
The World Health Organization (WHO) has stated that an estimated 257 million people were chronically infected with hepatitis B virus (HBV) throughout the world in 2015, and more than 887 000 people die every year due to its complications, including liver cirrhosis (LC) and hepatocellular carcinoma (HCC).1 Additionally, 71 million people have chronic hepatitis C virus (HCV) infection globally, and approximately 399 000 people die each year from hepatitis C‐related liver diseases.2
According to Vital Statistics in Japan, in 2016, HCC was ranked the fourth most frequent cause of cancer death in men and sixth most frequent cause of cancer death in women.3 Until 1970, the annual mortality rate due to HCC was approximately 10 persons/100 000 population. It rose to the peak of 27.5 persons/100 000 population in 2002, and thereafter started to decline gradually. The mortality in men was nearly double that in women. In spite of a recent decrease in the annual death rate due to HCC, exactly 28 528 people (18 510 male individuals and 10 018 female individuals) died of HCC in the year 2016 (mortality rate at 22.8 persons/100 000 populations) (Fig. 1).4
Figure 1.
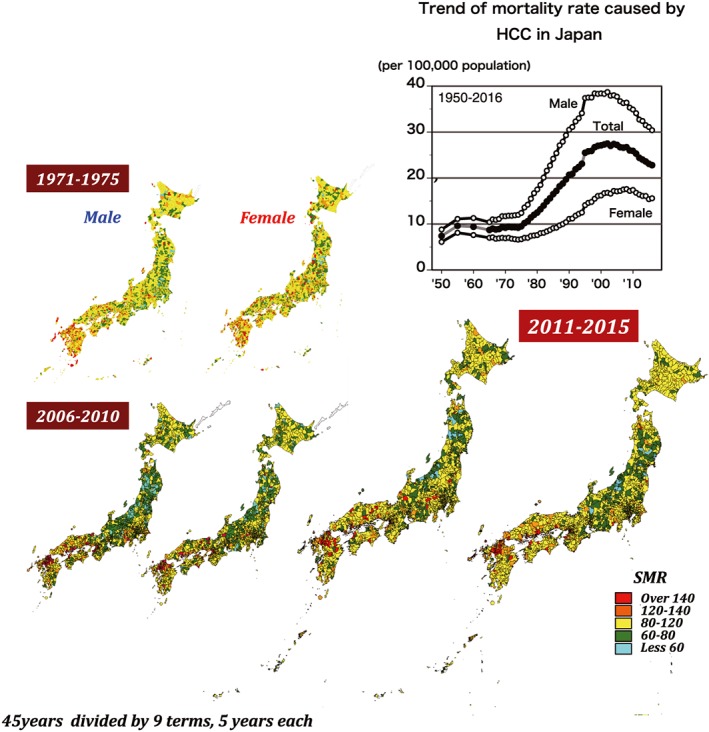
Area‐specific 5‐year standard mortality ratios of hepatocellular carcinoma in Japan. Each figure represents the area‐specific standard mortality ratio of hepatocellular carcinoma divided by eight jurisdictions of Japan during 1971–1975 (top left figures), 2006–2010 (bottom left figures), and 2011–2015 (bottom right figures). In each pair, the left map represents male individuals and the right map represents female individuals. Each color spot represents the mortality rate by their level of severity, from blue for standard mortality ratio (SMR) <60 to red for SMR >140. [Color figure can be viewed at http://wileyonlinelibrary.com]
Japan has 47 prefectures. On the basis of geographical and historical background, these prefectures can be divided into eight regions: Hokkaido, Tohoku, Kanto, Chubu/Tokai, Kinki, Chugoku, Shikoku, and Kyushu. The 5‐year standard mortality ratios (SMR) were calculated from 1971 until 2015, divided into nine time periods, by the VH‐Epi group (Epidemiological Research Group on Viral Hepatitis and its Long‐term Course, Ministry of Health, Labour, and Welfare [MHLW] of Japan) using a Bayesian model adjusted for age and population size. There was no significant regional difference in SMR during the 1st period (1971–1975) except in the Kyushu region. During the 7th period (2001–2005), regional differences in SMR can be clearly seen, with SMR in the western parts of Japan higher than in the other regions. The SMR distribution in the 9th period (2011–2015) is similar to that in the 7th period (2001–2005) (Fig. 1).
In 2006, Perz et al.5 estimated the contribution rate of persistent HBV and HCV infections to HCC occurrence through a systematic review classified by six WHO regions:6 Africa, the Americas, South‐East Asia, Europe, Eastern Mediterranean, and Western Pacific, which are then further subdivided into A and B according to the economic status of each country. By the estimates on the world scale, 53% of HCC occurrence can be attributed to persistent HBV infection, with 25% attributed to persistent HCV infection, indicating that HBV contributes more than HCV. This might be due to differences in the characteristics of canceration by each genotype of HBV/HCV, its predominance in each region of the world, and the number of individuals with baseline infection.6
The VH‐Epi group had estimated the etiology of HCC mortality annually using data from the Japanese census and country statistics from 1970 to 2007. Before the discovery of HCV in the late 1970s, 41% of HCC cases had underlying persistent HBV infection. After the discovery of HCV, the contribution of viral hepatitis to HCC was significantly changed in Japan. In 2007, approximately 65% of HCC cases were caused by persistent HCV infection, whereas HBV contributed only 15%, and the remaining 17–20% was of unknown etiology. Hepatocellular carcinoma mortality due to persistent HBV infection is constant at the rate of 3–4 persons/100 000 population, despite the abrupt rise in the number of deaths from the 1980s to the beginning of the 2000s.
In fact, the effort on prevention and control of HBV and HCV infection might reduce HCC mortality in Japan. For management of persistent HBV and HCV infection in a given country, it is critically important to know the exact numbers of infected carriers for the assessment of medical and financial needs in the foreseeable future. In this article, the current status and countermeasures for HBV and HCV carriers in Japan were reviewed from the epidemiological aspect.
Countermeasures for viral hepatitis in Japan
Figure 2 shows the background history on the introduction of hepatitis virus screening and its widespread application in Japan. After the discovery of HBV particles (Dane particles)7 in 1970, the Japanese Red Cross Blood Centers (JRC) adopted hepatitis B surface antigen (HBsAg) testing for the screening of blood donors (since 1972). The national project on the prevention of mother‐to‐child transmission of HBV was implemented in 1986. The core principles of the project, to prevent vertical infection, were HBV screening of all pregnant women at their antenatal care, follow‐up observation of positive mothers, and passive–active immunization of newborn infants of positive mothers using hepatitis B immunoglobulin (HBIG) and hepatitis B vaccine (HepB) (Fig. 3).
Figure 2.

Flow diagram showing the development of the system of countermeasures for hepatitis virus control in Japan. The long history of countermeasures against hepatitis B virus (HBV) and hepatitis C virus (HCV) infection in Japan is indicated by the establishment of strategic plans and gradual modification of the system in each year, together with particular milestones during the system's development. DAA, direct‐acting antiviral; HBsAg, hepatitis B surface antigen; IFN, interferon; JRC, Japanese Red Cross; NA, nucleos(t)ide analogue; NAT, nucleic acid amplification test. [Color figure can be viewed at http://wileyonlinelibrary.com]
Figure 3.
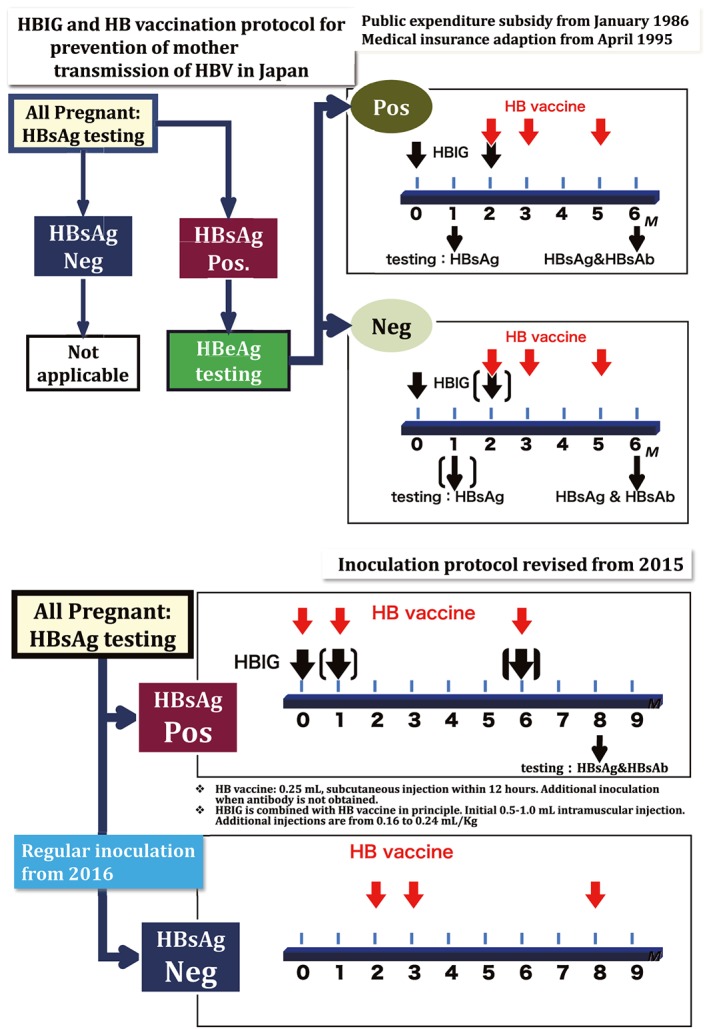
Algorithm for prevention of mother‐to‐child transmission of hepatitis B virus (HBV) in Japan (since 1986), which was incorporated with the universal HB vaccination in 2016. The top figure shows the procedure for prevention of mother‐to‐child transmission of HBV since 1986. Protocol 1 was for those children born to both hepatitis B surface antigen (HBsAg)‐ and hepatitis B envelope antigen (HBeAg)‐positive (Pos.) women; protocol 2 was for those children born to only HBsAg‐positive pregnant women. The bottom figure shows the procedure for the national program on prevention of mother‐to‐child transmission of HBV that was modified in 2015 with the addition of a three‐dose HB vaccine to the standard national immunization schedule in 2016. HBIG, hepatitis B immunoglobulin; Neg., negative. [Color figure can be viewed at http://wileyonlinelibrary.com]
Hepatitis C virus was first identified and cloned in 1989;8 soon after, the technique for screening of HCV infection advanced and became widely available in Japan. In 1989, the first‐generation anti‐HCV test (anti‐C100‐3)9 was developed and used in all blood donor screening by JRC. In 1992, it was replaced by the second‐generation anti‐HCV test. Meanwhile, HCV infected persons were treated using interferon. Since 1999, an accurate and highly sensitive technique for detecting the viral infection called the nucleic acid amplification test (NAT) was used in whole blood donors screening by JRC. A 5‐year project on publicly funded national screening of HBV and HCV infection among residents aged 40 years and over was implemented in Japan during 2002 to 2006, and this screening program has been continuing until now. Since 2007, in order to improve and equalize liver disease medical treatment, regional core hospitals for the treatment of liver diseases were installed in every prefecture by the notification of the Health Bureau of the MHLW. Subsequently, the medical expense subsidy system was set up for antiviral treatment of individuals with HBV or HCV infection. The “Basic Act on Hepatitis Measures” was formulated and affirmed in 2010. The first generation of interferon‐free direct‐acting antiviral agents (DAAs) was used for the treatment of HCV infection in 2014, and then next‐generation DAAs were marketed for anti‐HCV treatment. Since October 2016, the HepB vaccine has been included in the routine immunization program; it is scheduled to be given three times within 1 year after birth, at 0, 1, and 6 months of age. This long journey of countermeasures against viral hepatitis in Japan has resulted in increasing numbers of people diagnosed with hepatitis virus infection and the provision of easily accessible antiviral therapy for chronic persistent infection.10 Many large‐scale epidemiological or clinicopathological studies have been undertaken to explore the relationship between persistent infection of hepatitis virus and liver diseases, including HCC, the natural course of patients persistently infected with a hepatitis virus, and their incidence.8, 9, 10, 11, 12, 13, 14
LARGE‐SCALE SEROPREVALENCE STUDIES ON HEPATITIS VIRUS INFECTION
As part of the countermeasures against hepatitis virus, large‐scale seroprevalence studies were undertaken using two large databases obtained from screening of first‐time blood donors by JRC and from hepatitis examinations among residents aged 40 years and over by a health promotion project in Japan. The same screening technique with the same reagents were used to detect the serological markers of hepatitis virus in approximately 6 million units of donated blood annually for securing the safety of transfusions with blood and its products. Therefore, the records from JRC blood donation centers are valuable databases for the estimation of the prevalence of HBV and HCV infection in the whole Japan. The first study included 3.4 million first‐time blood donors from 1995 to 2000.11 The overall HBsAg prevalence was 0.63% (0.73% for men and 0.53% for women) and anti‐HCV prevalence was 0.49% (0.48% for men and 0.50% for women). The peak high prevalence was found in the 55–59 years age group (i.e. born 1941–1945) for HBsAg and in the 65–69 years age group (i.e. born 1931–1935) for anti‐HCV.
The second study included 3.74 million first‐time blood donors from 2001 to 2005;12 HBsAg prevalence was 0.31% and anti‐HCV prevalence was 0.26%. The same peak of high prevalence of HBV and HCV infection were detected in the same birth‐year group as the previous 1995–2000 study. High prevalence of both HBsAg and anti‐HCV was found in the 60 years age group (as of 2005), the so‐called “baby boomer” generation, whereas low prevalence was reported in the under 20 years age group, who were born in 1985 or later (0.05% for HBsAg and 0.1% for anti‐HCV) (Fig. 4). The third study included 2.7 million first‐time blood donors during 2007–2011, providing the estimated overall HBsAg prevalence of 0.20% (0.23% for men and 0.15% for women) and anti‐HCV prevalence of 0.16% (0.19% for men and 0.13% for women). Compared to previous studies, an obvious drop in prevalence of both HBsAg and anti‐HCV positivity was found overall and in each age‐ and sex‐specific subgroup. The single peak of high prevalence occurred in the same birth‐year group as previous studies (Fig. 4).11, 12, 13
Figure 4.
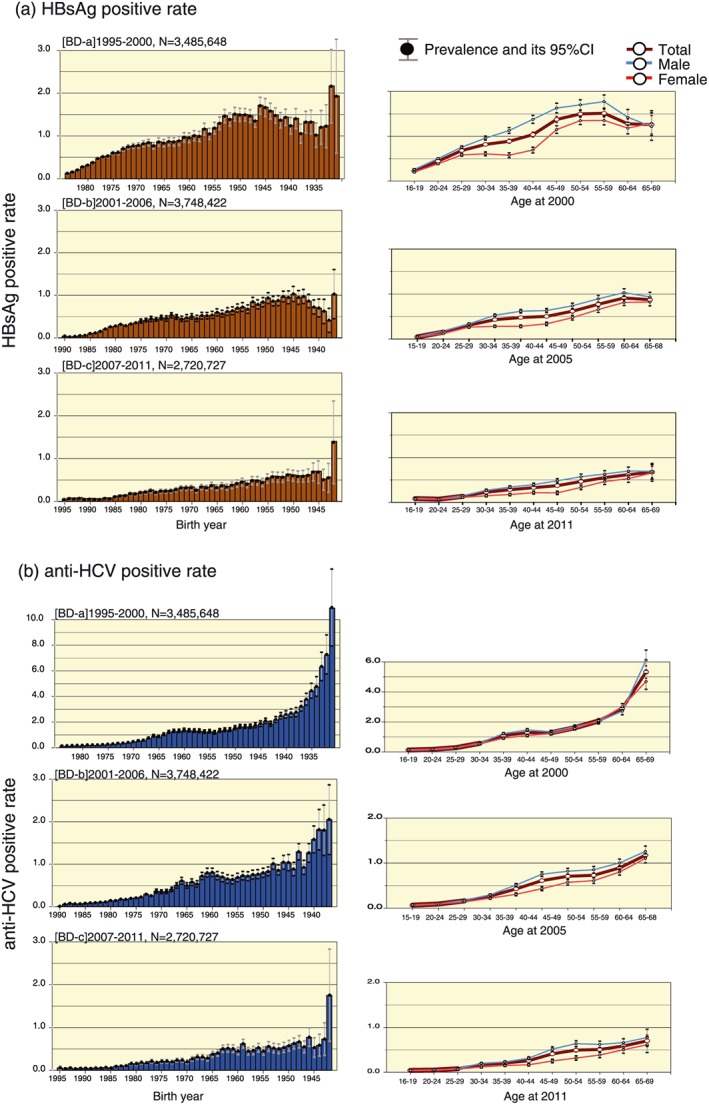
Trend of age‐ and sex‐specific hepatitis B virus (HBV) and hepatitis C virus (HCV) prevalence among first‐time blood donors in Japan from 1995 to 2011. (a) The hepatitis B surface antigen (HBsAg)‐positive rate is shown by each age group and birth year as a percentage of the total, and according to sex. (b) Anti‐HCV prevalence is shown in the same manner as in (a). Blue line, male cases; red line, female cases; brown line, total prevalence of the particular infection. Prevalence is shown by the particular period of observation in 5‐year intervals: (a) 1995–2000; (b) 2001–2006; and (c) 2007–2011. BD, Blood donors; CI, confidence interval. [Color figure can be viewed at http://wileyonlinelibrary.com]
Another large‐scale survey was undertaken using data from a 5‐year project for nationwide HBV and HCV screening, which was launched in April 2002 by the Japanese government.13 The government provides a health check‐up every 5 years to all Japanese residents from the age of 40 years to 70 years. Therefore, using these data, the total number of hepatitis virus carriers among the over‐40‐years age group was estimated in March 2007. The medical expenses for this hepatitis virus screening was totally supported by government through the medical insurance system and the assessments were done following the national standard screening protocol using quantitative anti‐HCV and NAT and the result was ultimately determined as “high possibility to be infected with HCV” (Appendix I).
Through this 5‐year project targeting the 40‐ to 70‐year‐old age group, 6 304 276 individuals were tested for HBV and 6 280 111 individuals were tested for HCV.8 Significantly high prevalence rates of both HBV and HCV infection were found in this cohort. The HBV carrier rate showed a peak of 1–1.5% among individuals aged in their 50s. The HCV carrier rate varied from the smallest values of 0.2–0.5% among individuals aged in their 40s, to the highest values of 1–2% among those aged over 70.8
The next large survey was undertaken among residents using data collected through health check‐ups during 2008–2012. The region‐specific prevalence of HBV and HCV is shown in Figure 5, together with the resultant prevalence of HBV and HCV among first‐time blood donors in 2007–2011. Prevalence of HBV in both blood donors and ordinary residents were higher in Hokkaido, Chugoku, and Kyushu regions. High numbers of HCV carriers among blood donors were found in Hokkaido, Shikoku, and Kinki regions, whereas high numbers among ordinary residents were found in Kyushu, Chugoku, and Hokkaido regions (Fig. 5). However, age‐specific tendencies of both HBV and HCV carrier rates in all regions were consistent between first‐time blood donors and residents if the HCV carrier rate was calculated as the anti‐HCV positive rate multiplied by 70%.14 The HCV carrier rates were particularly high in the over‐65 age group, who were considered to be at risk of developing HCC, and in western Japan, especially the areas located further west of the Kinki region.
Figure 5.
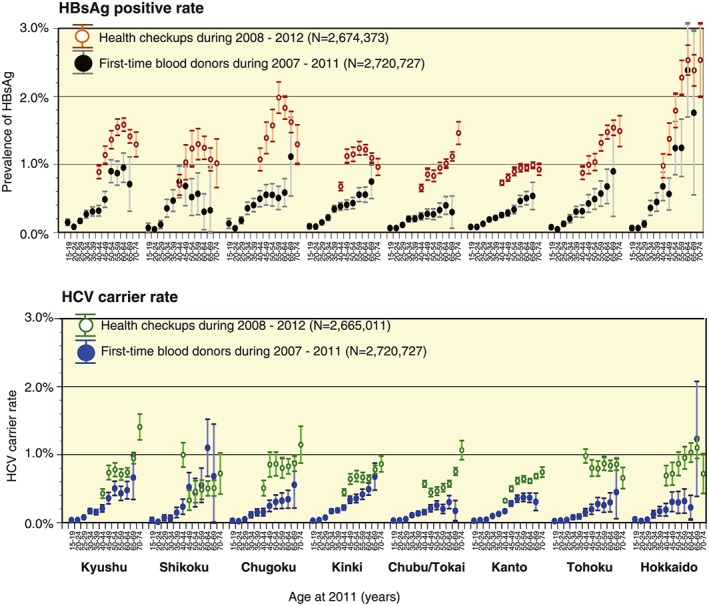
Trends of region‐specific hepatitis B virus (HBV) and hepatitis C virus (HCV) prevalence as indicated by two large‐scale nationwide surveys in Japan. The rates of hepatitis B surface antigen (HBsAg) and anti‐HCV positivity among first‐time blood donors during 2007–2011, as well as employees as revealed by health check‐ups during 2008–2012, are shown by each municipal region (n = 8). This region‐specific prevalence was further subdivided by age group for each particular infection with 95% confidence interval. Each color represents the respective group of people screened for HBV and HCV infection. [Color figure can be viewed at http://wileyonlinelibrary.com]
Moreover, the researchers from Iwate prefecture reported that the prevalence of antibody to HBsAg (anti‐HBs) prevalence among 253 746 residents who underwent a health check‐up in 1986–2017 was 23.22%. The obvious decline of the anti‐HBs positive rate was found in people born after 1941 and was <10% among people born after 1971, indicating the low level of immunity to HBV among adults and the need to promote hepatitis B vaccination among adults.15
Nagashima et al.16 reported the acquisition of anti‐HBs to a protective level (≥10 mIU/mL) after primary three‐dose HepB vaccination among 491 medical and dental students in Hiroshima. The anti‐HBs acquisition rate 1 and 5 months after primary three‐dose completion was 95.9% and 89.0%, respectively. Twelve non‐responders were given three‐dose boosters (the same schedule as the primary vaccination) and then followed up. All of them acquired a protective anti‐HBs titer. The study suggested that booster doses are effective if given at the same schedule as the primary vaccination. Moreover, anti‐HBs titer decreases by an average of 20% within the 4 months between the first and fifth month after the primary three‐dose vaccination. The study highlighted the importance of measuring anti‐HBs titer periodically after completing the three‐dose vaccination in health‐care workers who are at high risk of blood‐borne infection.16
Estimate of the Total Number of Hepatitis Virus Carriers
The number of people with persistent hepatitis virus infection is an important indicator in the estimation of the burden of hepatitis virus‐related liver diseases in society. However, most infected patients remain asymptomatic until the liver function deteriorates to a certain degree. Therefore, it is difficult to determine the actual number of patients with hepatitis virus‐related liver diseases based on clinical diagnosis only.
To deliver effective countermeasures for viral hepatitis, it is important to classify individuals with persistent hepatitis virus infection into four major categories (Appendix II): (i) undiagnosed carriers; (ii) carriers who had already visited hospital as a patient; (iii) diagnosed carriers who had not consulted any medical facility, or had discontinued the consultation; and (iv) newly infected carriers.
Regarding the number of “undiagnosed carriers”, the estimations were made based on the prevalence of HBV and HCV carriers in the two large populations mentioned in the previous section and the national census. As these two large populations, “first‐time blood donors” and “examinees of hepatitis virus screening”, were used as the basis for the estimation, this type of population was considered to include those who were not aware of their infection. The results showed that the estimated number of HBV latent carriers was 481 470 and that of HCV latent carriers was 295 956 (as of 2011; Table 1).12 As the opportunity for hepatitis virus screening has increased in Japan since the late 1990s, a dramatic decline was found in a comparison of 2005 estimates, in which the number of HBV latent carriers was 903 145 and HCV latent carriers was 807 903.13 This decline in the number of undiagnosed carriers might be due to the continuation of government‐funded HBV and HCV screening systems under the health promotion policy after the 5‐year nationwide health check‐ups (2002–2006). According to the report of the nationwide project for hepatitis examinations, at least 13 million people who were 40 years of age or older had already undergone the publicly funded screening for HBV and HCV.
Table 1.
Estimated number of persons with persistent hepatitis C virus (HCV) or hepatitis B virus (HBV) infection in Japan at 2000 and 2011
| Category | Total carriers | HBV carriers | HCV carriers |
|---|---|---|---|
| At 2000 | 3 012 706–3 662 706 | 1 317 752–1 467 752 | 1 694 954–2 194 954 |
| Undiagnosed | 2 402 706–3 052 706 | 1 217 752–1 367 752 | 1 184 954–1 684 954 |
| Patients | 610 000 | 100 000 | 510 000 |
| At 2011 | 2 090 128–2 840 128 | 1 118 627–1 268 627 | 983 879–1 583 879 |
| Undiagnosed | 776 826 | 481 470 | 295 356 |
| Patients | 811 588 | 303 366 | 520 600 |
| Unconsulted | 501 714–1 251 714 | 333 791–483 791 | 167 923–767 923 |
| 2000–2011 | |||
| Newly infected | 54 645 | 21 184 | 33 460 |
| Cured HCV | 200 000–300 000 | 0 | 200 000–300 000 |
| Death | 375 777–610 200 | 145 027–199 125 | 230 750–411 075 |
The next step is to estimate the number of carriers who had already visited hospital as a patient. The estimation could potentially be done based on the number of patients calculated from the patient survey that was undertaken once every 3 years. However, on the basis of the patient survey, the number of patients does not include patients who visit hospitals in more than 31‐day intervals, and variations in the total number of patients were found in patient surveys carried out every 3 years (2002, 2005, 2008, and 2011). Based on the patient survey (over 65 years) and medical record analysis (under 64 years),17 there were estimated to be 303 366 HBV‐infected patients and 520 600 HCV‐infected patients, yielding the total 811 588 hepatitis virus‐infected patients in 2011 in Japan (Table 1, Appendix II). It was also found that there was a slight increase in the total number of patients with malignant neoplasms of the liver and intrahepatic bile ducts, whereas the total number of patients with liver cirrhosis and chronic hepatitis had decreased.
Regarding the existence of “diagnosed carriers who had not consulted any medical facility, or had discontinued the consultation” (Appendix II), the total number of carriers is estimated to have increased rapidly after the year 2000. Although the enlightenment and awareness campaigns organized by the government and medical associations starting from late 1990s increased the opportunity for HBV and HCV screening, the number of subsequent consultations at medical institutions and the percentage of those who received effective medical treatment still remain unclear. Additionally, the number of patients treated with appropriate antiviral drugs did not increase appropriately in response to the increased number of individuals screened.
A pilot survey on the consultation rates at medical institutions after hepatitis virus screening was undertaken at Hiroshima in 2009 by VH‐Epi group. This pilot study showed that the consultation rates at medical institutions accounted for 48% of HBV carriers and 65% of HCV carriers after obtaining a positive result through health check‐ups in 2002–2009.18 These consultation rates at medical institutions in Hiroshima were relatively high compared with the nationwide consultation rate; however, half of HBV carriers and one‐third of HCV carriers found by screening were not consulted at medical institutions.
The results of a long‐term cohort study of HCV carriers who were found to be positive at blood donation revealed that only 1097 (32.5%) among 3377 HCV carriers who had received post‐test counselling had consulted at medical institutions for further examination, and 987 (29.2%) consulted twice or more.19 Among them, excluding loss‐to‐follow‐up because of transfer to other hospitals, the drop‐out rate in the 1–2 years after the initial visit was 24.3%. Therefore, it is strongly recommended to encourage asymptomatic carriers to continue with periodic consultations, especially men, even when liver findings are normal.
Since the dawn of the 2010s, the treatment efficacy against hepatitis has improved. The government has also introduced a medical expense aid system pertaining to antiviral therapy. This might support the effective use of the existing system among carriers in need of therapeutic interventions.
The natural history, based on Markov model simulation, has shown that the incidence of HCC occurrence increases after the age of 55 years in men, and after the age of 60 years in women if an asymptomatic carrier does not receive any therapeutic intervention at the age of 40 years. Furthermore, it was shown that the cumulative incidence of HCC at the age of 70 years was 38% in men and 20% in women.20 They are strong indicators to promote hepatitis virus screening and, at the same time, a need for a continuous consultations at medical institutions without drop‐out.
Finally, regarding “newly infected carriers”, the previous sero‐epidemiological surveys have estimated that HBV and HCV incidence rates are extremely low in the general population in Japan due to economic growth, improvements in sanitation, enhancement of advanced medical services, and the effectiveness of preventive measures against hepatitis virus infections.21, 22, 23
Prevention of Mother‐to‐Child Transmission of Viral Hepatitis B
Mother‐to‐child transmission was previously the main route of hepatitis B transmission in Japan,24 so a national program on prevention of mother‐to‐child transmission of HBV was started in 1986 in which HBsAg‐positive pregnant mothers were further tested for HBeAg. If a mother was positive for both HBsAg and HBeAg, HBIG was given twice to her baby (at birth and at 2 months of age) followed by three doses of HepB vaccine (at 2, 3, and 5 months of age). If a mother was HBsAg‐positive with HBeAg‐negative, only one dose of HBIG was given to the baby at birth, followed by three doses of HepB vaccine at 2, 3, and 5 months of age. After receiving passive–active immunization, all children were tested for HBsAg at 1 month of age and then HBsAg and anti‐HBs at 6 months of age. In 2015, the above prevention guideline was modified so that all children born to pregnant women positive for HBsAg, irrespective of their HBeAg status, were given HBIG and HepB vaccine at birth simultaneously, followed by another two doses of HepB vaccine at 1 month and 6 months of age.19. If a mother is negative for HBsAg, three doses of HepB vaccine (consistent with the universal immunization program) is given to the infant at 2, 3, and 8 months of age. All babies born to HBsAg‐positive mothers are then tested for HBsAg and HBsAb at 1 month and 6 months of age (Fig. 4).
Before the implementation of this national program, immunoprophylaxis of perinatal transmission of HBV was started in 1981 in a model area in Iwate prefecture. As a result, HBsAg prevalence among newborn infants obviously dropped from 0.75% in children born between 1978 and 1980 to 0.23% in children born between 1981 and 1985, and further to 0.04% in children born between 1986 and 1990. Among 45 births receiving immunoprophylaxis in 1985, 39 escaped from perinatal infection with efficacy of 86.7%.19, 25, 26
In order to evaluate the effect of the nationwide HBV immunoprophylaxis as well as to predict the future burden of HBV carriers, the VH‐Epi group under MHLW undertook the pilot study to estimate HBsAg prevalence among pregnant women.27 From April 2010 to March 2011, all 58 medical institutions having delivery care facilities in Hiroshima were eligible for inclusion. Among them, 41 medical institutions participated in this study, so that a total of 15 233 pregnant mothers (mean age, 30.5 years), which was equivalent to 59.6% of total births (25 596) in 2009 in Hiroshima, were analyzed. As a result, the overall HBs Ag prevalence among pregnant women was 0.52% (95% confidence interval [CI], 0.40–0.63%). Extremely low prevalence (0.10%; 95% CI, 0.0–0.12%) was observed among pregnant women born since 1986. According to those results, new infection due to vertical transmission will almost disappear in the next generation in Japan if the current system of immunoprophylaxis to newborn babies of positive mothers can be maintained consistently.
As the main risk factors for horizontal transmission have been eliminated by assuring the safety of blood and its products, sexual contact must be considered a reason behind the increasing number of persistent HBV carriers, typically with subgenotype A2, which is not an indigenous type in Japan but is assumed to have originated from western countries eg. Europe, North America, etc.28, 29, 30, 31 These data indicate that the main transmission route of HBV infection in Japan has been changed to horizontal infection in the form of sexually transmitted diseases instead of perinatal transmission. The Japanese government has now decided to provide universal vaccination to all babies born after October 2016. This national project is expected to eliminate the “newly infected” category of the population in the very near future in Japan, in order to meet the WHO's goal of global elimination of viral hepatitis by 2030.
Introduction of Hepatitis Screening for Employees in Hiroshima
In Japan, hepatitis screening systems were set up for particular groups of the population (blood donors, residents aged ≥40 years, pregnant women, and hospitalized patients recommended by doctors with sound reasons). The remaining population are less likely to receive hepatitis screening before the age of 40 years. To cover this gap, VH‐Epi introduced a screening model of viral hepatitis among employees of any age from 15 enterprises in Hiroshima during 2011–2016.32 The prevalence of HBsAg and anti‐HCV was 0.95% (23/2420) and 0.45% (11/2420), respectively, among which 13 of 23 and 6 of 11 were known cases for HBV and HCV, respectively. Among the known HBV cases, three had never visited a hospital. After being diagnosed by this study, the positive cases (23 HBV and 11 HCV) were referred to specialized hospitals after proper counselling. Among them, only 16 HBV (69.9%) and 3 HCV (27.3%) visited for consultation, showing the need to establish hepatitis screening among employees, to help individuals who are positive for hepatitis to easily access medical care and follow‐up, to provide the full package of counselling and health education, and to promote the referral system.
Conclusion
The significance of factors contributing to the development of hepatitis virus infection in Japan has gradually decreased after the World War II era, and the prevalence of HBV and HCV carriers among the younger generation is now very low. Based on the “Basic Act on Hepatitis Measures” (Act No. 97, Japan, December 2009), the prevention and early detection of hepatitis virus infection, the establishment of networks for hepatitis‐related medical care, and the development of new therapies for viral hepatitis have been actively promoted in Japan. While continuing the surveillance on the dynamics of hepatitis virus infections linked with the preventive measures against hepatitis virus infection, it is crucially important to promote appropriate measures for each category of hepatitis virus carrier in society.
Acknowledgments
The studies included in this review article were partly granted by the Ministry of Health, Labour and Welfare, Japan (H22‐kanen‐ippan‐012, H25‐kanen‐ippan‐010, and H28‐kansei‐ippan‐001). The authors would like to thank all collaborative researchers and colleagues of the Epidemiological Research Group on Viral Hepatitis and its Long‐term Course, MHLW Japan, as follows: Koichi Abe and Akio Miyasaka, Iwate Medical University; Hideki Aizaki, National Institute of Infectious Disease; Keisuke Hino, Kawasaki Medical School; Kenji Ikeda, Toranomon Hospital; Akito Sakai and Teturo Shimakami, Kanazawa University; Takuji Torimura, Kurume University; Shigeki Uchida, Japanese Red Cross Society; Kazumi Yamasaki, National Hospital Organization Nagasaki Medical Center; Tomiko Koyama and Junko Sasaki, Iwate Health Service Association; Takashi Kumada, Ogaki Municipal Hospital; Yasushi Matsuzaki, Tokyo Medical University Ibaraki Medical Center; Junichi Sugihara, Gifu Prefectural General Medical Center; Keiko Katayama, Masayuki Ohisa, and Aya Sugiyama, Hiroshima University; and Yuzo Miyakawa, Miyakawa Memorial Research Foundation. Our sincere and great thanks is extended to Professor Emeritus Hiroshi Yoshizawa for his support.
Appendix I: Schematic diagram of hepatitis C virus screening guidelines in Japan I.
The top schematic diagram shows the practical guidelines for hepatitis C virus (HCV) screening used in Japan from April 2003 to March 2013 which included the screening procedure, confirmation, and the respective interpretation of the screening result. The bottom schematic diagram shows the modified HCV screening procedure, which has been used since April 2013.
Appendix II: Trends of disease progression of hepatitis B and C virus infections in Japan, 2000 and 2011 II.
The top figure shows the trends in the numbers of persistently infected hepatitis B virus (HBV) and hepatitis C virus (HCV) carriers in Japan in 2000 and 2011. Each color represents a different category: (i) diagnosed patients; (ii) undiagnosed carriers; (iii) diagnosed but unconsulted or defaulted; (iv) cured; and (v) death.
The bottom figure shows the trends in the number of persistently infected HBV and HCV carriers in 2000 and 2011, categorized according to liver disease states. Each color represents a different disease state: (i) asymptomatic carriers (AC); (ii) chronic hepatitis (CH); (iii) liver cirrhosis (LC); and (iv) hepatocellular carcinoma (HCC).
Tanaka, J. , Akita, T. , Ko, K. , Miura, Y. , Satake, M. , and Epidemiological Research Group on Viral Hepatitis and its Long ‐term Course, Ministry of Health, Labour and Welfare of Japan (2019) Countermeasures against viral hepatitis B and C in Japan: An epidemiological point of view. Hepatol Res, 49, 990–1002. 10.1111/hepr.13417.
Conflict of interest: The authors have no conflict of interest.
Financial support: The studies included in this review article were partly granted from the Ministry of Health, Labour and Welfare, Japan (H22‐kanen‐ippan‐012, H25‐kanen‐ippan‐010, and H28‐kansei‐ippan‐001).
References
- 1. World Health Organization . Hepatitis B Fact Sheet World Health Organization 2017. Available at: [https://www.who.int/en/news-room/fact-sheets/detail/hepatitis-b]. Accessed [October 11, 2018]. [Google Scholar]
- 2. World Health Organization . Hepatitis C fact Sheet World Health Organization 2017. Available at: [https://www.who.int/en/news-room/fact-sheets/detail/hepatitis-c]. Accessed [October 11, 2018]. [Google Scholar]
- 3. National Cancer Center Japan . Center for cancer control and information services. National Cancer Center Japan, 2017. Available at: [https://www.ncc.go.jp/en/cis/index.html]. Accessed [October 11, 2018] [Google Scholar]
- 4. Editorial board of cancer statistics in Japan . Cancer Statistics in Japan 2017: Tokyo: Foundation for Promotion of Cancer Research; Available at: [https://ganjoho.jp/en/professional/statistics/brochure/2017_en.html]. Accessed [October 11, 2018]. [Google Scholar]
- 5. Perz JF, Armstrong GL, Farrington LA, Hutin YJF, Bell BP. The contributions of hepatitis B virus and hepatitis C virus infections to cirrhosis and primary liver cancer worldwide. J Hepatol 2006; 45: 529–538. [DOI] [PubMed] [Google Scholar]
- 6. World Health Organization . WHO definition of regional grouping, 2017. Available at: [https://www.who.int/healthinfo/global_burden_disease/definition_regions/en/]. Accessed [October 11, 2018].
- 7. Blumberg BS, Alter HJ. A “new” antigen in leukemia sera. JAMA 1965; 191(7): 541–546. [DOI] [PubMed] [Google Scholar]
- 8. Choo Q, Kuo G, Weiner A, Overby L, Bradley D, Houghton M. Isolation of a cDNA clone derived from a blood‐borne non‐A, non‐B viral hepatitis genome. Science 1989; 244: 359–362. [DOI] [PubMed] [Google Scholar]
- 9. Kuo G, Choo Q, Alter H et al An assay for circulating antibodies to a major etiologic virus of human non‐A, non‐B hepatitis. Science 1989; 244: 362–364. [DOI] [PubMed] [Google Scholar]
- 10. Oza N, Isoda H, Ono T, Kanto T. Current activities and future directions of comprehensive hepatitis control measures in Japan: the supportive role of the Hepatitis Information Center in building a solid foundation. Hepatol Res 2017; 47: 487–496. [DOI] [PubMed] [Google Scholar]
- 11. Tanaka J, Kumagai J, Katayama K et al Sex‐ and age‐specific carriers of hepatitis B and C viruses in Japan estimated by the prevalence in the 3,485,648 first‐time blood donors during 1995–2000. Intervirology 2004; 47: 32–40. [DOI] [PubMed] [Google Scholar]
- 12. Tanaka J, Akita T, Ohisa M et al Trends in the total numbers of HBV and HCV carriers in Japan from 2000 to 2011. J Viral Hepat 2018; 25: 363–372. [DOI] [PubMed] [Google Scholar]
- 13. Tanaka J, Koyama T, Mizui M et al Total numbers of undiagnosed carriers of hepatitis C and B viruses in Japan estimated by age‐ and area‐specific prevalence on the national scale. Intervirology 2011; 54: 185–195. [DOI] [PubMed] [Google Scholar]
- 14. Watanabe J, Matsumoto C, Fujimura K et al Predictive value of screening tests for persistent hepatitis C virus infection evidenced by viraemia. Japanese experience. Vox Sang 1993; 65: 199–203. [DOI] [PubMed] [Google Scholar]
- 15. Koyama T, Sasaki J, Takahashi F. Infection status of hepatitis B virus and hepatitis C virus in Iwate Prefecture – Analysis by birth year cohort, 2017. Japan: Ministry of Health, Labour and Welfare of Japan; [Google Scholar]
- 16. Nagashima S, Yamamoto C, Ko K et al Acquisition rate of antibody to hepatitis B surface antigen among medical and dental students in Japan after three‐dose hepatitis B vaccination. Vaccine 2019; 37: 145–151. [DOI] [PubMed] [Google Scholar]
- 17. Ohisa M, Kimura Y, Matsuo J et al Estimated numbers of patients with liver disease related to hepatitis B or C virus infection based on the database reconstructed from medical claims from 2008 to 2010 in Japan. Hepatol Res 2015; 45: 1228–1240. [DOI] [PubMed] [Google Scholar]
- 18. Tanaka J. Report on the awareness and course of action after hepatitis virus testing. Japan: MHLW scientific research subsidy, Research Project for Emergency Measures to Conquer Hepatitis 2017. Japan: Ministry of Health, Labour and Welfare of Japan; [Google Scholar]
- 19. Matsuo J, Mizui M, Okita H et al Follow up of the 987 blood donors found with hepatitis C virus infection over 9–18 years. Hepatol Res 2012; 42: 637–647. [DOI] [PubMed] [Google Scholar]
- 20. Tanaka J, Kumada H, Ikeda K et al Natural histories of hepatitis C virus infection in men and women simulated by the Markov model. J Med Virol 2003; 70: 378–386. [DOI] [PubMed] [Google Scholar]
- 21. Tanaka J, Mizui M, Nagakami H et al Incidence rates of hepatitis B and C virus infections among blood donors in Hiroshima, Japan, during 10 years from 1994 to 2004. Intervirology 2008; 51: 33–41. [DOI] [PubMed] [Google Scholar]
- 22. Sasaki F, Tanaka J, Moriya T et al Very low incidence rates of community‐acquired hepatitis C virus infection in company employees, long‐term inpatients, and blood donors in Japan. J Epidemiol 1996; 6: 198–203. [DOI] [PubMed] [Google Scholar]
- 23. Uchida S, Satake M, Kurisu A et al Incidence rates of hepatitis C virus infection among blood donors in Japan: a nationwide retrospective cohort study. Transfusion 2018; 58: 2880–2885. [DOI] [PubMed] [Google Scholar]
- 24. Sato T, Do SH, Asao T et al Estimating numbers of persons with persistent hepatitis B virus infection transmitted vertically and horizontally in the birth cohort during 1950–1985 in Japan. Hepatol Res 2014; 44: E181–E188. [DOI] [PubMed] [Google Scholar]
- 25. Koyama T, Matsuda I, Sato S, Yoshizawa H. Prevention of perinatal hepatitis B virus transmission by combined passive‐active immunoprophylaxis in Iwate, Japan (1981–1992) and epidemiological evidence for its efficacy. Hepatol Res 2003; 26: 287–292. [DOI] [PubMed] [Google Scholar]
- 26. Noto H, Terao T, Ryou S et al Combined passive and active immunoprophylaxis for preventing perinatal transmission of the hepatitis B virus carrier state in Shizuoka, Japan during 1980–1994. J Gastroenterol Hepatol 2003; 18: 943–949. [DOI] [PubMed] [Google Scholar]
- 27. Sugiyama A, Ohisa M, Nagashima S et al Reduced prevalence of hepatitis B surface antigen positivity among pregnant women born after the national implementation of immunoprophylaxis for babies born to hepatitis B virus‐carrier mothers in Japan. Hepatol Res 2017; 47: 1329–1334. [DOI] [PubMed] [Google Scholar]
- 28. Tamada Y, Yatsuhashi H, Masaki N et al Hepatitis B virus strains of subgenotype A2 with an identical sequence spreading rapidly from the capital region to all over Japan in patients with acute hepatitis B. Gut 2012; 61: 765–773. [DOI] [PubMed] [Google Scholar]
- 29. Sugauchi F, Orito E, Ohno T et al Spatial and chronological differences in hepatitis B virus genotypes from patients with acute hepatitis B in Japan. Hepatol Res 2006; 36: 107–114. [DOI] [PubMed] [Google Scholar]
- 30. Ozasa A, Tanaka Y, Orito E et al Influence of genotypes and precore mutations on fulminant or chronic outcome of acute hepatitis B virus infection. Hepatology 2006; 44: 326–334. [DOI] [PubMed] [Google Scholar]
- 31. Kobayashi M, Ikeda K, Arase Y et al Change of hepatitis B virus genotypes in acute and chronic infections in Japan. J Med Virol 2008; 80: 1880–1884. [DOI] [PubMed] [Google Scholar]
- 32. Sugiyama A, Fujii T, Nagashima S et al Pilot study for hepatitis virus screening among employees as an effective approach to encourage employees who screened positive to receive medical care in Japan. Hepatol Res 2018; 48: E291–E302. [DOI] [PubMed] [Google Scholar]