

Abstract
Background and Aims
The combination of basal insulin (BI) and GLP‐1 receptor agonists (GLP‐1RAs) is a rational and effective therapy for patients with uncontrolled type 2 diabetes (T2D). We compared the effectiveness of fixed and flexible BI/GLP‐1RA combinations using routinely accumulated clinical data.
Methods
This was a retrospective, multicentre, real‐world study concerning T2D patients initiating a fixed or flexible BI/GLP‐1RA combination (NCT03959865). The primary endpoint was change in HbA1c. Secondary endpoints were changes in body weight, fasting plasma glucose (FPG) and systolic blood pressure (SBP). Confounding was addressed by propensity score matching (PSM) or multivariable adjustment (MVA).
Results
A total of 609 patients were included in the study, 131 in the fixed group and 478 in the flexible group. The two groups differed in terms of diabetes duration, body weight and concomitant medications. After 5.7 months, observed HbA1c reductions were 0.6% and 0.8%, and body weight reductions were 2.8 kg and 1.2 kg in the flexible and fixed groups, respectively. Following PSM, HbA1c declined similarly in the two groups, whereas reduction in body weight was significantly in favour of the flexible combination. Findings were robust in sensitivity analyses, with the exception that, with MVA, a significantly higher reduction in HbA1c was detected in the fixed group. Final doses of BI were higher in the fixed group, whereas those of GLP‐1RA were higher in the flexible group.
Conclusions
In routine specialist care, initiation of the fixed or flexible BI/GLP‐1RA combination allowed similar improvement in glycaemic control, but greater weight loss was observed with the flexible combination. This difference reflected dosages of BI and GLP‐1RAs.
Keywords: basal insulin, GLP‐1 analogue, observational study, type 2 diabetes
1. INTRODUCTION
Glucagon‐like peptide‐1 receptor agonists (GLP‐1RAs) are prioritized as second‐line therapy for the treatment of type 2 diabetes (T2D), especially in patients with a history of cardiovascular disease (CVD) or when there is a need to avoid weight gain and hypoglycaemia.1 Randomized controlled trials (RCTs) have shown that addition of GLP‐1RA is more effective in reducing HbA1c than addition of basal insulin (BI) in patients with uncontrolled T2D who are undergoing oral therapy.2, 3 GLP‐1RAs are associated with a low risk of hypoglycaemia and have extra‐glycaemic effects, including reduction in body weight and blood pressure.4, 5 Notably, GLP‐1RAs as a class improve cardiovascular outcomes in T2D patients with established CVD.6 These benefits justify the positioning of GLP‐1RAs as the first injectable therapy in most T2D patients as an alternative to insulin.1
For patients who are already using BI, addition of a GLP‐1RA is a rational strategy when intensification is needed. BI and GLP‐1RAs potentiate each other by acting through different mechanisms in different tissues.7, 8 Addition of GLP‐1RAs to a basal oral therapy is as effective as addition of bolus insulin with respect to glycaemic control, but with lower risk of hypoglycaemia and weight gain, and lower insulin doses.9 Therapeutic inertia in treating patients with uncontrolled T2D can worsen cardiovascular outcomes,10 and intensification of a basal oral regimen is often delayed in clinical practice11 while timely addition of a GLP‐1RA to BI could improve clinical and economic outcomes.12
Two fixed‐ratio combinations (FRCs) of BI and GLP‐1RA are available. The insulin degludec/liraglutide FRC (IdegLira) delivers 0.036 mg of liraglutide per unit of degludec‐100, whereas the insulin glargine/lixisenatide FRC (IglarLixi 100/50) available in Italy delivers 0.5 mcg of lixisenatide per unit of glargine‐100. Thus, to reach full‐dose GLP‐1RA (1.8 mg of liraglutide or 20 mcg of lixisenatide), patients have a daily BI requirement between 40 and 50 units. FRCs have the advantage of delivering both therapeutic components with a single daily injection and allow a smooth titration of GLP‐1RA along with insulin.13 However, many patients in clinical practice do not receive high doses of BI, implying that the GLP‐1RA dose in the FRC may be under‐titrated. Compared with FRCs, flexible combinations of BI and GLP‐1RA are burdened by the higher numbers of injections and regimen complexity, but have the advantage of being able to combine any BI with any GLP‐1RA, each at the desired dose.
Meta‐analyses of RCTs reported similar benefits of fixed and flexible BI/GLP‐1RA combinations in patients with T2D who were already using BI and required intensification of glucose control,14, 15 but no RCT directly compared the fixed and flexible combinations. In the absence of data from RCTs, observational studies, if well designed and carefully conducted, can provide medium‐level evidence to inform clinical practice.16 Real‐world studies are hypothesis‐generating and cannot substitute for RCTs,17 but they can guide the design of dedicated RCTs. Retrospective real‐world studies are particularly attractive, as they can rapidly gather data from large heterogeneous populations that are representative of those seen in routine clinical practice.18
We herein report the results of a retrospective real‐world multicentre study that was conducted to compare the effectiveness of the fixed and the flexible BI/GLP‐1RA combination concerning glycaemic and extra‐glycaemic endpoints.
2. MATERIALS AND METHODS
2.1. Study design
The GLP‐1REWIN (GLP‐1 REceptor agonists and real World evIdeNce) study was a retrospective real‐world study conducted at six diabetes specialist outpatient clinics in the Veneto region, north‐east Italy. The protocol has been registered at http://clinicaltrials.gov (NCT03959865). The general objective of the study was to evaluate the effectiveness of GLP‐1RAs concerning glycaemic and extra‐glycaemic endpoints in real‐world clinical practice from 2010 to 2018. The study was conducted at diabetes centres because only diabetologists could prescribe GLP‐1RAs in Italy during the study period. Data were collected retrospectively by automatically interrogating the same electronic chart at all centres (MyStar Connect Smart Digital Clinic, Meteda, San Benedetto del Tronto, Italy). A dedicated software was developed to extract all relevant anonymized patient information for placement into a clinical research form without manual intervention. Suitability of this data collection approach for performing real‐world comparative effectiveness studies has been demonstrated extensively.19, 20, 21, 22
The study was promoted by the University Hospital of Padova and approved by the respective ethical committees of each participating centre. As data were anonymized at time of automatic extraction, making patient re‐identification impossible, no informed consent was required according to national regulations concerning retrospective studies.
2.2. Cohort identification
Although the GLP‐1REWIN study collected retrospective data concerning all GLP‐1RAs since 2010, the present analysis focused only on the combination of BI and GLP‐1RAs. In Italy, the cost of initiation of an FRC of BI/GLP‐1RA was reimbursed only for patients who were already using BI. Thus, for this specific analysis, we included data concerning all patients aged 18‐80 years with a diagnosis of T2D for at least 1 year, as recorded in the chart, who were already using BI and initiated a GLP‐1RA that was available on the market between 1 January 2010 and 31 December 2018 in addition to a regimen that comprised BI with or without oral agents. Available GLP‐1RAs were: exenatide twice daily or once weekly, liraglutide, lixisenatide, dulaglutide and FRCs of BI/GLP‐1RA. Albiglutide and semaglutide were not available. No restriction to the type or dosage of concomitant oral agents was imposed. Patients using basal‐bolus insulin and those who initiated a new GLP‐1RA, switching from another GLP‐1RA‐based regimen, were excluded. No other exclusion criteria were applied.
2.3. Data extraction
The baseline visit date was set as the date a patient attended the outpatient clinic and received for the first time a new prescription of a GLP‐1RA. The following clinical characteristics and laboratory data were collected from the electronic chart up to 90 days before baseline: age, sex, diabetes duration, body height and weight, body mass index (BMI), waist circumference, systolic and diastolic blood pressure (SBP and DBP), fasting plasma glucose (FPG), HbA1c, total cholesterol, HDL cholesterol, triglycerides (LDL cholesterol calculated using Friedwald's equation), liver enzymes, serum creatinine (eGFR calculated using the CKD‐EPI equation), and urinary albumin excretion rate (UAER), expressed as mg/g of urinary creatinine. Details concerning chronic complications, as reported by ICD‐9 codes in the electronic charts, were used to define the presence of micro‐ and macroangiopathy. Microangiopathy was defined as any of the following: UAER >30 mg/g; eGFR <60 mL/min/1.73 m2; diabetic retinopathy (any stage) or diabetic macular oedema; peripheral or autonomic neuropathy. Macroangiopathy was defined as any of the following: peripheral arterial disease or peripheral revascularization; stroke/transient ischaemic attack or carotid revascularization; ischaemic heart disease, coronary artery disease, myocardial infarction or coronary revascularization. Information concerning concomitant medication for treatment of diabetes and for other cardiovascular risk factors was also recorded. Detailed data concerning dosage were collected for insulin and GLP‐1RAs. After having set the baseline date, we identified the first follow‐up visit attended by the patients at the same clinic at least 3 months after baseline. Updated values for HbA1c, FPG, SBP and body weight were recorded only at the first follow‐up visit, along with updated information concerning medications and dosages of BI and GLP‐1RAs. Information concerning drug dispensation and refill rates was not available.
2.4. Objectives and endpoints
In this analysis, we compared changes in glycaemic (HbA1c and fasting plasma glucose) and extra‐glycaemic (body weight and systolic blood pressure) effectiveness parameters between patients who initiated an FRC of BI/GLP‐1RA (fixed group) or a flexible combination of BI and GLP‐1RA (flexible group) in addition to a previous glucose‐lowering medication (GLM) regimen comprised of BI and oral agents. Thus, patients in the fixed group replaced BI with the BI/GLP‐1RA FRC, whereas patients in the flexible group added GLP‐1RA to the previous basal oral regimen. We defined an “intention‐to‐treat” (ITT) dataset based on all patients who received a GLP‐1RA in addition to BI (fixed or flexible), irrespective of whether they continued treatment at follow‐up. This dataset included patients who discontinued the BI/GLP‐1RA regime before follow‐up or for whom a prescription was not confirmed at follow‐up. Reasons for discontinuation were not available. We defined a “per protocol” (PP) dataset based on all patients who persisted on treatment with the BI/GLP‐1RA combination (fixed or flexible) at follow‐up, although no information concerning whether the patients actually took the prescribed medications was available. The primary endpoint was change in HbA1c from baseline to end of follow‐up in the ITT dataset. Secondary endpoints were the changes in HbA1c in the PP subset and change in FPG, body weight and SBP in the ITT and PP subsets. For both the ITT and PP datasets, we performed a sub‐analysis wherein the flexible group was restricted to patients who added liraglutide to basal oral therapy.
2.5. Analysis of treatment cost
In exploratory analyses performed in the ITT dataset for the primary endpoint, using PSM or MVA, we compared the estimated economic cost per patient for adding a GLP‐1RA to BI as a fixed or a flexible combination. The treatment cost was estimated according to the market price currently specified in Italy for each BI, GLP‐1RA and the FRCs, as well as for needles (Table S1). The types of drugs and dose prescribed at baseline were used to determine the weekly cost of treatment. For patients who continued treatment and underwent titration, the average dose between baseline and follow‐up was used. To determine the final estimated total cost of BI and GLP‐1RA therapy for each patient, the average weekly cost was multiplied by the interval from baseline to follow‐up in weeks.
2.6. Statistical analysis
Continuous variables were expressed as mean ± standard deviation (SD) if normally distributed or as median (interquartile range) if non‐normally distributed. Non‐normal variables were log‐transformed before being analysed by parametric tests. Categorical variables were expressed as percentage. All analyses were performed separately in the ITT and PP datasets. The comparison of baseline characteristics between two groups (fixed vs flexible) was performed using the unpaired 2‐tailed Student's t test for continuous variables and the chi square test for categorical variables. To evaluate the balance between the two groups, in addition to P values, we calculated the standardized mean difference (SMD). Good balance is conventionally set at SMD <0.10, meaning that, for continuous variables, the between‐group difference must be <10% the pooled standard deviation. The intra‐group change in effectiveness endpoint variables from baseline to end of follow‐up was analysed using the paired 2‐tailed Student's t test. We then calculated the change in endpoint variables within each group, which were compared using the unpaired 2‐tailed Student's t test. To address channelling bias, that is, differences in baseline characteristics between the two groups that drive differential outcomes, we used two approaches. In the primary analysis, we performed a propensity score matching (PSM), in which patients in the fixed group were matched 1:1 with patients in the flexible group based on propensity scores (PSs). PSs were calculated from the following 42 baseline covariates: age, gender, duration of diabetes, body weight, BMI, FPG, HbA1c, SBP and DBP, total and HDL and LDL cholesterol, triglycerides, eGFR, liver enzymes (AST, ALT), insulin dose, concomitant medications (ie, metformin, sulphonylureas, glitazones, angiotensin converting enzyme inhibitors or angiotensin receptor blockers (ACEi/ARBs), calcium channel blockers (CCB), anti‐platelet therapies (APT), beta‐blockers, diuretics, lipid‐lowering therapies, statin, ezetimibe, fibrates, oral anticoagulant, microangiopathy, CKD stage III or higher, diabetic retinopathy, diabetic macular oedema, macroangiopathy, coronary revascularization, ischaemic heart disease, stroke/transient ischaemic attack, carotid atherosclerosis, carotid revascularization, left ventricle hypertrophy, and index for clinical centre. PSM was performed with optimal 1:1 ratio without replacement, meaning that patients in the flexible group were selected to match patients in the fixed group to minimize the total absolute difference in the logit of propensity score (LPS) across all matches. Moreover, participants in the flexible group were included in the matching procedure if their LPS fell in the common support region, defined as the range of the LPS in the fixed group ±0.25 SD of the distribution of the LPS. In the secondary analysis, we used multivariable adjustment (MVA) with linear regressions. Changes in endpoint variables were adjusted for all clinical characteristics that differed at baseline between the two groups with a P value <0.10 (Model 1) or for all clinical variables used to compute PS (Model 2). For both PSM and MVA, full datasets were needed for all variables used to compute PS or to be entered into the regression models. Therefore, missing data were handled with multiple imputation (MI), which was performed using a fully conditional specification (FCS) algorithm,23 obtaining 10 imputed datasets. All covariates with less than 50% of missing values were included as predictors in the imputation process. Outcome variables were not imputed and imputed data were used only for MVA and for computing PS. Outcome analysis after PSM and MVA was performed on each imputed dataset and pooled estimated treatment differences (ETDs) are presented.24 For PSM, matched cohorts from each of the 10 imputed datasets varied slightly in composition and size because the 10 imputed datasets were different and independent. Only for representation purpose, the PSM groups from the first imputed dataset are shown. Statistical analyses were performed using SAS version 9.4 (TS1M4) or higher and a 2‐tailed P value <.05 was considered statistically significant.
3. RESULTS
3.1. Patient disposition and characteristics
From a total background population of 83 116 T2D patients, 6167 patients initiated a GLP‐1RA during the study period. Of these, 1636 patients used a combination of insulin and a GLP‐1RA. After excluding patients who were also receiving bolus insulin (n = 324) or who switched from other GLP‐1RA‐based regimens (n = 189), and those who had not (yet) returned to follow‐up (n = 377) or for whom data concerning the primary endpoint at baseline or follow‐up were missing (n = 137), a total of 609 patients using BI/GLP‐1RA plus oral agents were included in the ITT analysis. A total of 131 patients received an FRC (all IdegLira, none IglarLixi) and 478 received a flexible combination (Figure 1).
Figure 1.
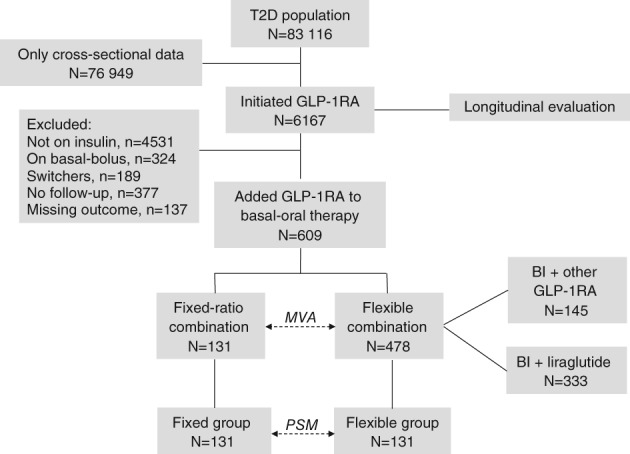
Study flowchart. Abbreviations: BI, basal insulin; GLP‐1RA, GLP‐1 receptor agonists; MVA, multivariable adjustment; PSM, propensity score matching; T2D, type 2 diabetes
Baseline characteristics of patients are summarized in Table 1. Before PSM, patients were, on average, 62 years of age with a known diabetes duration of 13 years and a baseline HbA1c of 8.8%, and 60% were male. Approximately 50% of patients had microangiopathy and 40% had macroangiopathy. The most common associated oral GLMs were metformin and sulphonylureas. In the flexible group, the most common GLP‐1RA was liraglutide (67.9%), followed by dulaglutide (19.2%), lixisenatide (5.7%), exenatide twice daily (4.0%) and exenatide once weekly (3.2%). The most common BI was glargine‐100 (56.0%), followed by detemir (26.9%), NPH insulin (6.6%), degludec‐100 (6.7%) and glargine‐300 (3.9%). The fixed and flexible groups differed significantly with respect to diabetes duration, body weight and BMI, and use of calcium‐channel blockers.
Table 1.
Clinical characteristics of study patients
| Before PSM | After PSM | ||||||||
|---|---|---|---|---|---|---|---|---|---|
| Missing | Flexible group N = 478 | Fixed group N = 131 | SMDa | P | Flexible group N = 131 | Fixed group N = 131 | SMDa | P | |
| Age, y | 0% | 61.9 ± 10.6 | 63.0 ± 9.3 | −0.10 | .30 | 63.4 ± 9.8 | 63.0 ± 9.3 | 0.02 | .87 |
| Sex male, n (%) | 0% | 282 (59.0%) | 79 (60.3%) | −0.03 | .80 | 85 (64.9%) | 79 (60.3%) | 0.04 | .81 |
| Diabetes duration, years | 0% | 12.7 ± 7.5 | 15.1 ± 7.7 | −0.32 | <.01 | 14.8 ± 8.1 | 15.1 ± 7.7 | −0.07 | .64 |
| Weight, kg | 5% | 100.0 ± 18.3 | 95.8 ± 17.8 | 0.22 | .03 | 94.7 ± 16.3 | 95.8 ± 17.8 | −0.01 | .92 |
| BMI, kg/m2 | 6% | 35.4 ± 6.1 | 33.1 ± 5.4 | 0.39 | <.01 | 32.9 ± 5.6 | 33.1 ± 5.4 | 0.01 | .96 |
| SBP, mm Hg | 13% | 144.9 ± 20.4 | 141.5 ± 22.9 | 0.12 | .23 | 144.1 ± 19.5 | 141.5 ± 22.9 | 0.08 | .56 |
| DBP, mm Hg | 14% | 81.3 ± 11.7 | 81.7 ± 10.6 | −0.05 | .65 | 81.7 ± 10.6 | 81.7 ± 10.6 | 0.03 | .85 |
| FPG, mg/dL | 9% | 177.7 ± 59.2 | 180.9 ± 55.1 | −0.03 | .78 | 177.1 ± 63.6 | 180.9 ± 55.1 | −0.06 | .66 |
| HbA1c, % | 0% | 8.8 ± 1.5 | 8.9 ± 1.3 | −0.11 | .30 | 8.9 ± 1.5 | 8.9 ± 1.3 | −0.05 | .75 |
| Total cholesterol, mg/dL | 25% | 176.1 ± 46.6 | 165.5 ± 37.1 | 0.17 | .12 | 170.5 ± 44.0 | 165.5 ± 37.1 | 0.04 | .75 |
| HDL cholesterol, mg/dL | 28% | 45.1 ± 12.1 | 43.5 ± 10.2 | 0.14 | .24 | 44.4 ± 12.3 | 43.5 ± 10.2 | 0.02 | .89 |
| Triglycerides, mg/dL | 27% | 179.3 ± 135.2 | 159.7 ± 108.9 | 0.14 | .22 | 159.4 ± 96.7 | 159.7 ± 108.9 | −0.03 | .81 |
| LDL cholesterol, mg/dL | 30% | 95.4 ± 36.9 | 89.1 ± 29.1 | 0.07 | .54 | 93.2 ± 32.8 | 89.1 ± 29.1 | 0.07 | .65 |
| AST, U/l | 44% | 22.6 ± 12.9 | 23.8 ± 10.0 | −0.03 | .82 | 23.2 ± 10.8 | 23.8 ± 10.0 | 0.00 | .99 |
| ALT, U/l | 43% | 26.2 ± 14.6 | 28.3 ± 17.1 | −0.06 | .58 | 25.9 ± 14.7 | 28.3 ± 17.1 | −0.02 | .87 |
| eGFR, ml/min/1.73 m2 | 26% | 78.5 ± 22.7 | 81.6 ± 21.1 | −0.06 | .58 | 81.1 ± 20.4 | 81.6 ± 21.1 | −0.02 | .90 |
| Complications | |||||||||
| CKD stage III+, n (%) | 26% | 84 (24.3%) | 19 (17.9%) | 0.09 | .40 | 18 (20.7%) | 19 (17.9%) | 0.01 | .94 |
| Retinopathy, n (%) | 19% | 104 (27.6%) | 37 (31.9%) | −0.09 | .37 | 40 (35.4%) | 37 (31.9%) | −0.02 | .86 |
| DME, n (%) | 19% | 25 (6.6%) | 6 (5.2%) | 0.08 | .46 | 9 (8.0%) | 6 (5.2%) | 0.04 | .81 |
| IHD, n (%) | 17% | 61 (15.6%) | 19 (16.2%) | 0.00 | 1.00 | 21 (17.6%) | 19 (16.2%) | 0.01 | .96 |
| Coronary revascularization, n (%) | 17% | 41 (10.5%) | 11 (9.4%) | 0.05 | .66 | 11 (9.2%) | 11 (9.4%) | 0.00 | .99 |
| Carotid atheroma, n (%) | 3% | 162 (53.3%) | 46 (43.8%) | 0.07 | .50 | 49 (50.5%) | 46 (43.8%) | 0.04 | .79 |
| Carotid revascularization, n (%) | 33% | 4 (1.3%) | 0 (0.0%) | 0.18 | .97 | 0 (0.0%) | 0 (0.0%) | 0.00 | .79 |
| Stroke/TIA, n (%) | 33% | 11 (3.6%) | 8 (7.6%) | −0.05 | .61 | 5 (5.2%) | 8 (7.6%) | −0.02 | .88 |
| Microangiopathy, n (%) | 0% | 223 (46.7%) | 73 (55.7%) | −0.18 | .07 | 75 (57.3%) | 73 (55.7%) | −0.06 | .68 |
| Macroangiopathy, n (%) | 0% | 198 (41.4%) | 56 (42.7%) | −0.03 | .79 | 59 (45.0%) | 56 (42.7%) | 0.04 | .76 |
| LVH, n (%) | 17% | 9 (2.3%) | 5 (4.3%) | −0.04 | .70 | 3 (2.5%) | 5 (4.3%) | −0.04 | .77 |
| Diabetes medicationsb | |||||||||
| Metformin, n (%) | 0% | 378 (79.1%) | 113 (86.3%) | −0.19 | .07 | 114 (87.0%) | 113 (86.3%) | −0.02 | .89 |
| Sulphonylureas, n (%) | 0% | 107 (22.4%) | 33 (25.2%) | −0.07 | .50 | 34 (26.0%) | 33 (25.2%) | −0.04 | .76 |
| Glitazones, n (%) | 0% | 35 (7.3%) | 7 (5.3%) | 0.08 | .43 | 5 (3.8%) | 7 (5.3%) | 0.03 | .88 |
| Insulin dose | 5% | 22.1 ± 11.1 | 20.1 ± 7.9 | 0.20 | .06 | 20.1 ± 9.4 | 20.1 ± 7.9 | −0.02 | .91 |
| Other medications | |||||||||
| ACEi/ARB, n (%) | 7% | 322 (72.7%) | 95 (75.4%) | −0.07 | .47 | 94 (76.4%) | 95 (75.4%) | −0.01 | .96 |
| CCB, n (%) | 7% | 133 (30.0%) | 19 (15.1%) | 0.37 | <0.01 | 24 (19.5%) | 19 (15.1%) | 0.03 | .86 |
| Beta‐blockers, n (%) | 7% | 160 (36.1%) | 53 (42.1%) | −0.13 | .21 | 49 (39.8%) | 53 (42.1%) | −0.07 | .62 |
| Diuretics, n (%) | 7% | 224 (50.6%) | 55 (43.7%) | 0.14 | .18 | 49 (39.8%) | 55 (43.7%) | −0.08 | .58 |
| APT, n (%) | 7% | 208 (47.0%) | 60 (47.6%) | −0.03 | .81 | 62 (50.4%) | 60 (47.6%) | −0.01 | .96 |
| Lipid‐lowering, n (%) | 7% | 317 (71.6%) | 91 (72.2%) | −0.04 | .72 | 89 (72.4%) | 91 (72.2%) | −0.04 | .79 |
| Statin, n (%) | 7% | 298 (67.3%) | 89 (70.6%) | −0.10 | .35 | 88 (71.5%) | 89 (70.6%) | −0.02 | .86 |
| Ezetimibe, n (%) | 7% | 58 (13.1%) | 13 (10.3%) | 0.09 | .41 | 13 (10.6%) | 13 (10.3%) | 0.00 | .97 |
| Fibrate, n (%) | 7% | 25 (5.6%) | 4 (3.2%) | 0.13 | .26 | 4 (3.3%) | 4 (3.2%) | 0.02 | .91 |
| OAT, n (%) | 7% | 28 (6.3%) | 5 (4.0%) | 0.12 | .31 | 6 (4.9%) | 5 (4.0%) | −0.03 | .82 |
Note. The two groups are compared before and after propensity score matching (PSM). In addition to P values, standardized mean differences (SMD) are shown. Only observed data are shown. For matched cohorts, the first imputed dataset (out of 10) is reported.
Abbreviations: ACEi, angiotensin converting enzyme inhibitors; ALT, alanine aminotransferase; APT, anti‐platelet therapies; ARBs, angiotensin receptor blockers; AST, aspartic aminotransferase; BMI, body mass index; CCB, calcium channel blockers; CKD, chronic kidney disease; DBP, diastolic blood pressure; DME, diabetic macular edema; eGFR, estimated glomerular filtration rate; FPG, fasting plasma glucose; HDL, high density lipoprotein. IHD, ischemic heart disease; LVH, left ventricular hypertrophy; OAT, oral anticoagulant therapy; SBP, systolic blood pressure; TIA, transient ischaemic attack.
SMDs are shown as the mean of SMD in the 10 imputed datasets.
The combination of GLP‐1RAs and SGLT‐2 inhibitors was not reimbursed.
3.2. Observed changes in dosages and effectiveness endpoints
We first performed an unadjusted analysis of the unmatched ITT groups. The median duration of follow‐up was 5.7 months in both groups. Average BI dose at the time patients initiated the GLP‐1RA was 20.1 units in the fixed group and 22.1 units in the flexible group. The corresponding starting dose of liraglutide in the fixed group was 0.72 mg. The average prescribed doses of GLP‐1RA in the flexible group were 1.29 mg for liraglutide (11.1% at 0.6 mg; 63.6% at 1.2 mg; 25.2% at 1.8 mg) and 1.37 mg for dulaglutide (17.5% at 0.75 mg; 82.5% at 1.5 mg).
At the end of the follow‐up period, the BI dose increased to 26.3 units in the fixed group (P < .001 vs baseline) and remained stable at 22.3 units in the flexible group (Table S1). For comparison, the average dose of BI for 4822 patients undergoing basal oral therapy from the background population was 13.0 units at the last visit. The corresponding average dose of liraglutide increased to 0.94 mg in the FRC. In the flexible group, the average dose of liraglutide increased to 1.47 mg (4.4% at 0.6 mg; 44.7% at 1.2 mg; 50.9% at 1.8 mg; P < .001 vs baseline) and the average dose of dulaglutide increased to 1.5 mg in all patients (P < .001 vs baseline).
In the fixed group, HbA1c declined by 0.8% (from 8.9% to 8.1%), FPG by 26.2 mg/dL, body weight by 1.2 kg and SBP by 0.9 mm Hg. In the flexible group, HbA1c declined by 0.6% (from 8.8% to 8.2%), FPG by 17.4 mg/dL, body weight by 2.7 kg and SBP by 4.3 mm Hg (Table 2).
Table 2.
Outcome analysis
| Flexible group | Fixed group | ||||||||||
|---|---|---|---|---|---|---|---|---|---|---|---|
| Comparison | Outcome | N | Baseline | Follow‐up | Change | N | Baseline | Follow‐up | Change | ETD (SE) | P |
| ITT unmatched | HbA1c | 478 | 8.8 ± 1.5 | 8.2 ± 1.5 | −0.6 ± 1.5a | 131 | 8.9 ± 1.3 | 8.1 ± 1.4 | −0.8 ± 1.4a | ||
| Weight | 427 | 99.6 ± 17.9 | 96.8 ± 17.6 | −2.7 ± 4.5a | 114 | 96.7 ± 17.3 | 95.5 ± 18.0 | −1.2 ± 3.9a | |||
| SBP | 381 | 144.9 ± 20.6 | 140.6 ± 20.2 | −4.3 ± 20.7a | 100 | 142.1 ± 23.1 | 141.3 ± 21.4 | −0.9 ± 21.3 | |||
| FPG | 401 | 178.4 ± 58.9 | 161.0 ± 54.3 | −17.4 ± 61a | 117 | 181.4 ± 56.4 | 155.2 ± 61.4 | −26.2 ± 68.4a | |||
| ITT matched | HbA1c | 131 | 8.9 ± 1.5 | 8.4 ± 1.5 | −0.6 ± 1.6a | 131 | 8.9 ± 1.3 | 8.1 ± 1.4 | −0.8 ± 1.4a | −0.26 (0.20) | .189 |
| Weight | 117 | 94.3 ± 16.2 | 91.8 ± 15.7 | −2.5 ± 3.9a | 114 | 96.7 ± 17.3 | 95.5 ± 18.0 | −1.2 ± 3.9a | 1.20 (0.57) | .038 | |
| SBP | 111 | 143.7 ± 19.8 | 140.9 ± 19.8 | −2.8 ± 22.7a | 100 | 142.1 ± 23.1 | 141.3 ± 21.4 | −0.9 ± 21.3 | 2.2 (3.2) | .482 | |
| FPG | 106 | 178.1 ± 64.8 | 161.6 ± 54.7 | −16.5 ± 71a | 117 | 181.4 ± 56.4 | 155.2 ± 61.4 | −26.2 ± 68.4a | −9.0 (10.0) | .370 | |
| PP unmatched | HbA1c | 329 | 8.6 ± 1.4 | 7.8 ± 1.2 | −0.8 ± 1.4a | 117 | 8.9 ± 1.2 | 8.1 ± 1.2 | −0.9 ± 1.2a | ||
| Weight | 297 | 99.6 ± 17.4 | 96.6 ± 16.8 | −3.0 ± 4.6a | 103 | 96.9 ± 17.9 | 95.9 ± 18.4 | −1.1 ± 3.9a | |||
| SBP | 257 | 143.8 ± 19.2 | 138.1 ± 19.3 | −5.7 ± 20.1a | 91 | 141.7 ± 23.4 | 140.8 ± 20.7 | −0.9 ± 21.1 | |||
| FPG | 280 | 173.6 ± 57.0 | 155.1 ± 49.0 | −18.5 ± 58.5a | 105 | 180.5 ± 56.6 | 151.6 ± 58.3 | −28.9 ± 66.3a | |||
| PP matched | HbA1c | 109 | 8.8 ± 1.2 | 8.0 ± 1.1 | −0.8 ± 1.3a | 109 | 8.9 ± 1.3 | 8.1 ± 1.3 | −0.8 ± 1.3a | −0.02 (0.20) | .934 |
| Weight | 99 | 96.4 ± 17.2 | 93.6 ± 16.5 | −2.8 ± 3.6a | 96 | 97.8 ± 17.6 | 96.6 ± 18.2 | −1.1 ± 4.0a | 1.64 (0.62) | .009 | |
| SBP | 91 | 145.4 ± 20.3 | 137.5 ± 17.5 | −7.9 ± 19.9a | 84 | 141.1 ± 21.2 | 140.7 ± 20.0 | −0.4 ± 21.1 | 5.3 (3.4) | .120 | |
| FPG | 95 | 176.9 ± 60.2 | 149.6 ± 43.7 | −27.3 ± 58.2a | 97 | 180.7 ± 56.9 | 151.4 ± 58.2 | −29.3 ± 66.9a | −4.3 (9.9) | .666 | |
Note. For each comparison and outcome, number of patients, values at baseline and follow‐up, change from baseline and estimated treatment difference (ETD) with standard error (SE), along with respective P values are reported. For matched cohorts, the mean value of the first imputed dataset (out of 10) is reported. Pooled ETDs from the 10 imputed datasets are presented.
Abbreviations: FPG, fasting plasma glucose; ITT, intention to treat; PP, per protocol; SBP, systolic blood pressure.
P < .05.
3.3. Primary ITT comparative effectiveness analysis
The 131 patients in the fixed group were matched 1:1 with 131 patients in the flexible group using PSM. As shown in Table 1 (and represented graphically in Figure S1A), the matched groups were very well balanced with respect to all the clinical characteristics considered at baseline, thereby allowing a direct comparison for the primary outcome. HbA1c significantly declined from baseline by 0.6% in the flexible group (from 8.9% to 8.4%) and by 0.8% (from 8.9% to 8.1%) in the fixed group, equal to a non‐significant treatment difference of 0.26% (P = .189).
For analysis of secondary outcomes, some patients were excluded because of missing endpoint data. Body weight declined by 2.5 kg in the flexible group (n = 117) and by 1.2 kg in the fixed group (n = 114), giving an ETD of 1.20 kg in favour of the flexible regimen (P = .038). Exclusion of patients from the matched cohorts for whom body weight values were missing resulted in a slight imbalance in baseline use of sulphonylureas and prevalence of maculopathy (Figure S1B). When this residual imbalance was adjusted for, the ETD for body weight was 1.14 kg in favour of the flexible combination (P = .049). As in the overall population, the BI dose in the matched cohorts increased more in the fixed group than in the flexible group (ETD ± SE: 5.1 ± 0.9 units; P < .001) (Table S2). After accounting for the difference in BI dose, the ETD for body weight in favour of the flexible group was reduced to 0.9 kg and was no longer significant (P = .148). No significant difference was noted for change in FPG and SBP between the two matched cohorts (Table 2). The residual imbalances in baseline covariates secondary to the exclusion of participants for whom SBP or FPG values at baseline or follow‐up were missing (Figure S1C and S1D) did not alter the outcome comparison.
The estimated total cost of treatment was, on average, 878.8 ± 412.6 €/patient (n = 131) in the fixed group (36.9 ± 12.9 €/week/patient) and 1096.0 ± 374.1 €/patient (n = 127) in the flexible group (44.8 ± 9.2 €/week/patient). The difference was statistically significant, with cost in the fixed group being lower (ETD, −188.6 ± 56.3 €; P = .001), equivalent to a lower weekly cost of treatment of 7.9 ± 1.5 €/patient.
3.4. Multivariable regression analysis
As an alternative approach to PSM, we addressed channelling bias by MVA, including all patients in both groups for whom endpoint data were available (Table 3). In the more parsimonious Model 1, HbA1c declined by 0.33% ± 0.16% more in the fixed group (P = .038), whereas body weight decreased by 1.52 ± 0.50 kg more in the flexible group (P = .003). After further adjustment in Model 2, the difference in HbA1c decline was no longer significant, whereas the difference in body weight change remained significantly in favour of the flexible combination. In both models, no significant between‐group difference was noted for change in FPG and SBP. The estimated cost of treatment was lower in the fixed group than in the flexible group by 206.7 ± 43.5 €/patient (Model 1; P < .001) or by 199.7 ± 45.1 €/patient (Model 2; P < .001; Figure 2).
Table 3.
Multivariable analysis
| Model 1 | Model 2 | ||||
|---|---|---|---|---|---|
| Outcome | ETD ± SE | P | ETD ± SE | P | |
| ITT fixed vs flexible | |||||
| N = 609 (131 vs 478) | HbA1c (%) | −0.33 ± 0.16 | .038 | −0.15 ± 0.14 | .292 |
| N = 541 (114 vs 427) | Weight (kg) | 1.52 ± 0.50 | .003 | 1.39 ± 0.53 | .009 |
| N = 481 (100 vs 381) | SBP (mm Hg) | 3.3 ± 2.6 | .198 | 2.1 ± 2.2 | .354 |
| N = 518 (117 vs 401) | FPG (mg/dL) | −9.6 ± 7.2 | .183 | −4.2 ± 6.0 | .487 |
| PP fixed vs flexible | |||||
| N = 446 (117 vs 329) | HbA1c (%) | 0.06 ± 0.13 | .621 | 0.10 ± 0.13 | .466 |
| N = 400 (103 vs 297) | Weight (kg) | 1.87 ± 0.56 | <.001 | 1.95 ± 0.60 | .001 |
| N = 348 (91 vs 257) | SBP (mm Hg) | 4.7 ± 2.8 | .095 | 4.5 ± 2.5 | .072 |
| N = 385 (105 vs 208) | FPG (mg/dL) | −8.5 ± 7.5 | .260 | −1.5 ± 6.1 | .808 |
Note. Analysis was performed in ITT and PP datasets comparing change (final minus baseline) in endpoint variables in the fixed vs flexible groups. Negative estimated treatment differences (ETD) indicate a larger reduction in the fixed group. Model 1: adjusted for age, sex and all clinical characteristics that differed at baseline between the two groups with a P value <.10. In each analysis, exclusion of participants for whom information concerning outcomes was missing yielded different selection of baseline covariates for inclusion in the model. ITT analyses of HbA1c and fasting plasma glucose (FPG) and estimated cost: duration of diabetes, microangiopathy, metformin use, insulin dose, calcium channel blockers (CCB), clinical centre, weight and BMI. Analyses of weight and systolic blood pressure (SBP) were further adjusted for total cholesterol. PP analyses of HbA1c: duration of diabetes, microangiopathy, use of CCB, clinical centre, HbA1c, weight and BMI. Analyses of weight: duration of diabetes, microangiopathy, use of CCB, sulphonylureas, clinical centre, total cholesterol, triglycerides and BMI. Analyses of SBP: duration of diabetes, microangiopathy, use of CCB and glitazones, clinical centre, total cholesterol and BMI. Analyses of FPG: duration of diabetes, microangiopathy, use of CCB and fibrates, clinical centre, triglycerides, weight and BMI. Model 2: adjusted for all clinical variables used to compute PS.
Abbreviations: ITT, intention to treat; PP, per protocol; SE, standard error.
Figure 2.
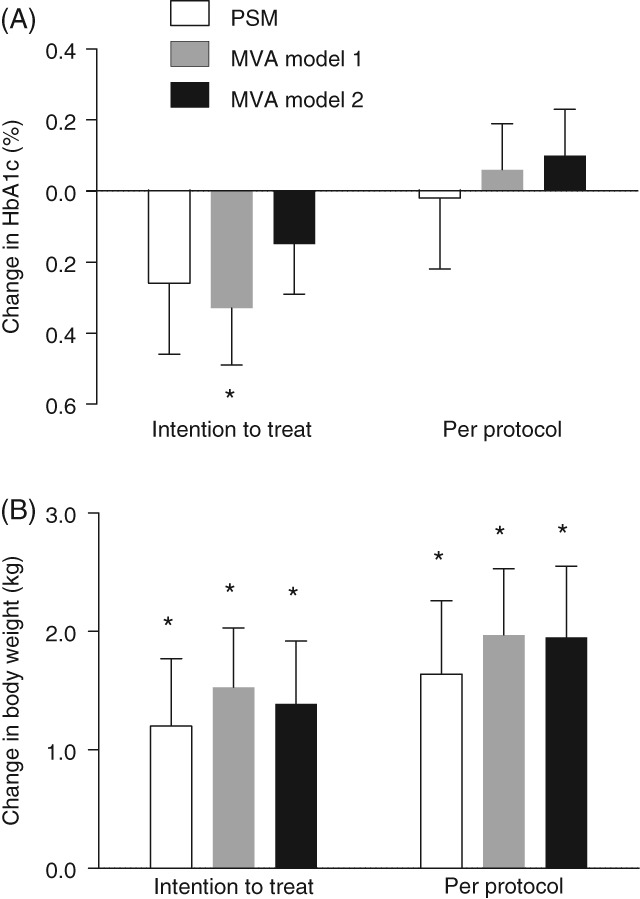
Estimated treatment differences for HbA1c and body weight. Treatment differences have been calculated for HbA1c (a) and body weight (b) for the fixed vs flexible groups. Negative values indicate higher reductions in the fixed group vs the flexible group. Intention‐to‐treat analysis included all patients initiating treatment. Per‐protocol analysis included only patients who continued with treatment at follow‐up. Abbreviations: MVA, multivariable analysis; PSM, propensity score matching. *P < .05
3.5. PP analyses
In the PP dataset, we retained only patients who continued the BI/GLP‐1RA combination at follow‐up. PSM yielded 109 patients in each group for analysis of the primary endpoint (Table S3). Balance was good after PSM, with the exception of the baseline prevalence of microangiopathy (Figure S1E). Change from baseline in HbA1c was identical between the two groups (ETD, 0.02%; P = .934) (Table 2), even after adjustment for baseline microangiopathy. As observed for the primary analysis, exclusion of some patients for whom data for secondary endpoints were missing amplified the between‐group imbalance, leading to the need for further adjustment (Figure S1F‐H). Change from baseline in body weight was still in favour of the flexible combination (ETD, 1.64 ± 0.62; P = .009), even after adjustment for residual imbalance in gender, SBP, microangiopathy, use of glitazones and anticoagulant therapy (P = .007). No significant difference was observed for change in FPG and SBP. According to MVA performed on the PP dataset, HbA1c declined to the same extent in the two groups, whereas body weight declined by 1.9 kg more in the flexible group (P ≤ .001) in both models. No significant difference was observed for change in FPG and SBP (Table 3).
3.6. Sub‐analysis
We compared the IdegLira FRC with the flexible combination of BI with liraglutide. In the ITT dataset, PSM yielded two groups comprising 127 patients each, which were well balanced for baseline covariates (Figure S1I and S1J). As shown in Table S4, there was no significant between‐group difference in HbA1c decline, but body weight declined by 1.25 kg more in the flexible group, even after adjustment for residual confounders (P = .034). No significant difference was noted for change in FPG and SBP. These results were confirmed in the PP dataset. MVA performed on the ITT or PP datasets and in both models still showed no significant difference in change in HbA1c between groups, but a significantly higher decline in body weight in the flexible group (Table S5).
4. DISCUSSION
In this real‐world retrospective multicentre study, we show that initiation of fixed and flexible BI/GLP‐1RA combinations similarly improved glucose control, but reduction in body weight was significantly greater with the flexible combination. The greater improvement in body weight in the flexible group was probably attributable to the higher GLP‐1RA doses and the lower BI doses than in the fixed group. Vice‐versa, in the fixed group, a similar or better glucose control was achieved despite lower GLP‐1RA doses than in the flexible group because there was a concomitant up‐titration of insulin doses from baseline to follow‐up, which was not observed in the flexible group. Furthermore, the FRC always included insulin degludec (vs 6.7% in the flexible group), which has been shown to improve FPG more than insulin glargine‐100 and ‐300 in treat‐to‐target RCTs.25, 26 As a collateral note, IglarLixi was not represented in the fixed group probably because, in Italy, it entered the market after IdegLira and the overall use of lixisenatide was limited (as evidenced by the small proportion of patients using lixisenatide in the flexible group). A better adherence to the single daily injection also could have contributed to the glycaemic effect of the FRC, but this is speculative as information concerning drug dispensing and refill rates was not available. As the study was a retrospective collection of data recorded for clinical purposes, there was no pre‐specified glucose target. In fact, titration of the BI dose was suboptimal in both groups, because FPG remained far from internationally recognized targets despite relatively lower insulin requirements (~0.2 units/kg). Nonetheless, an increase in BI dose from 20 to 26 units at 6 months in the fixed group was beyond that observed in the ORBIT study for patients using basal oral therapy.27 Further improvements in HbA1c could be expected in both groups if insulin doses were appropriately titrated. Of note, we found that similar or greater glycaemic benefit was achieved with the fixed combination at a lower cost than with the flexible combination. It could be speculated that equal insulin titration in the two groups would limit weight decrease in the flexible group, because the GLP‐1RA dose was already optimized, more than in the fixed group, because of concomitant up‐titration of GLP‐1RA, and would bring the cost of the two treatments closer.
Robustness of the findings was confirmed in several sensitivity analyses, including two adjustment methods (PSM and MVA), ITT and PP datasets, and in the subgroups of patients receiving the fixed or flexible BI/liraglutide combinations. Model 1 of the MVA performed on the ITT dataset, the most conservative and powered analysis, showed a significantly 0.3% larger HbA1c reduction in the fixed group. However, such a finding was not confirmed in other analyses and, therefore, cannot be considered as robust as the different effect on body weight. As expected, improvements in glycaemic and extra‐glycaemic endpoints tended to be better in the PP dataset, which was enriched in good responders. As in the ITT, PP analyses also showed similar glycaemic effects of the fixed and flexible combinations, but higher body weight reduction with the flexible combination. As the fixed group comprised only patients initiating IdegLira, it is also noteworthy that the findings were confirmed in comparison with the BI/liraglutide flexible combination. Unfortunately, the number of patients who initiated the degludec/liraglutide flexible combination was too small (n = 29) to perform a separate analysis.
Our results should not be interpreted as if this study had been an RCT, but, rather, should be considered information concerning the way in which the fixed and flexible combinations performed in routine clinical practice. Indeed, because of the intrinsic confounding by indication (channelling bias), real‐world studies cannot substitute for RCTs.17 We addressed such bias using PSM and MVA. Although PSM generated two cohorts well‐balanced for all measured variables and assumes no linear relationships between covariates and the outcome, it reduces sample size and statistical power. MVA retains all patients in the analysis, but assumes multiple linear relations that may not hold true. Notably, quite similar results were obtained with these two different approaches, suggesting an appropriate handling of known confounders. However, residual confounding by unmeasured variables cannot be eliminated without randomization. Importantly, the reasons underlying the choice of a fixed or flexible combination may have driven the differential outcome. For instance, a flexible add‐on of GLP‐1RA to BI could have been chosen if the need for full‐dose GLP‐1RA was prioritized over intensification of BI dose. Several other pieces of information that could influence therapeutic choices and/or drive the outcome were missing, such as preferences and attitudes towards diabetes treatment, dietary habits, physical exercise and compliance. Another limitation is that no data were available concerning the reasons why some patients discontinued the BI/GLP‐1RA combination, nor concerning drug refill rates, which could have provided additional comparative information concerning compliance and adherence.
In summary, we show that, in specialist routine care, initiation of the fixed or flexible BI/GLP‐1RA combinations allowed similar improvement in glycaemic control, with lower treatment costs with the fixed combination; however, the flexible combination was associated with greater reductions in body weight. These differences mainly reflected the dosages of BI and GLP‐1RA used and further highlight the need to titrate BI to optimize the benefit of this combination therapy.
CONFLICTS OF INTEREST
M. R. received lecture and advisory board fees from AstraZeneca, Boehringer‐Ingelheim, Novo Nordisk and Sanofi Aventis. V. F. served as a consultant for Novo Nordisk. N. S. received lecture or consultancy fees from Astra‐Zeneca, Boehringer‐Lilly, Novartis, Novo Nordisk, Sanofi‐Aventis, Takeda, Merck Sharp & Dohme and Abbott and received research support from Novo Nordisk. A. L. received grant support and lecture or advisory board fees from Novo Nordisk, Sanofi, Abbott and Eli Lilly. A. A. received research grants and lecture or advisory board fees from Merck Sharp & Dome, AstraZeneca, Novartis, Boeringher‐Ingelheim, Sanofi, Mediolanum, Janssen and Novo Nordisk. G. P. F. received grant support and lecture or advisory board fees from AstraZeneca, Boehringer‐Ingelheim, Eli Lilly, Mundipharma, Novo Nordisk, Sanofi, Genzyme, Abbott, Novartis and Merck Sharp & Dohme. M. L. M., F. T. and M. D. A. declare no conflict of interest.
AUTHOR CONTRIBUTIONS
Data collection was undertaken by G.P.F., M.R., V.F., N.S., M.D.A. and A.L. Data analysis and interpretation were performed by M.L.M., G.P.F. and A.A. The manuscript was written by M.L.M., G.P.F. and A.A., and was revised by M.L.M., M.R., V.F., N.L., M.D.A., A.L., A.A. and G.P.F.; all authors approved the final version of the manuscript.
Supporting information
Appendix S1. Supplementary material.
Morieri ML, Rigato M, Frison V, et al. Fixed versus flexible combination of GLP‐1 receptor agonists with basal insulin in type 2 diabetes: A retrospective multicentre comparative effectiveness study. Diabetes Obes Metab. 2019;21:2542–2552. 10.1111/dom.13840
Peer Review The peer review history for this article is available at https://publons.com/publon/10.1111/dom.dom13840.
Funding information Publication charges were covered by Airon Communication through a Novo Nordisk S.p.A. unconditional grant. The authors are fully responsible for the contents and conclusions. Novo Nordisk S.p.A. did not influence and was not involved in data collection, interpretation and analysis.
REFERENCES
- 1. Davies MJ, D'Alessio DA, Fradkin J, et al. Management of Hyperglycemia in type 2 diabetes, 2018. A consensus report by the American Diabetes Association (ADA) and the European Association for the Study of diabetes (EASD). Diabetes Care. 2018;41:2669‐2701. [DOI] [PMC free article] [PubMed] [Google Scholar]
- 2. Abd El Aziz MS, Kahle M, Meier JJ, Nauck MA. A meta‐analysis comparing clinical effects of short‐ or long‐acting GLP‐1 receptor agonists versus insulin treatment from head‐to‐head studies in type 2 diabetic patients. Diabetes Obes Metab. 2017;19:216‐227. [DOI] [PubMed] [Google Scholar]
- 3. Singh S, Wright EE Jr, Kwan AY, et al. Glucagon‐like peptide‐1 receptor agonists compared with basal insulins for the treatment of type 2 diabetes mellitus: a systematic review and meta‐analysis. Diabetes Obes Metab. 2017;19:228‐238. [DOI] [PMC free article] [PubMed] [Google Scholar]
- 4. Htike ZZ, Zaccardi F, Papamargaritis D, Webb DR, Khunti K, Davies MJ. Efficacy and safety of glucagon‐like peptide‐1 receptor agonists in type 2 diabetes: a systematic review and mixed‐treatment comparison analysis. Diabetes Obes Metab. 2017;19:524‐536. [DOI] [PubMed] [Google Scholar]
- 5. Ussher JR, Drucker DJ. Cardiovascular biology of the incretin system. Endocr Rev. 2012;33:187‐215. [DOI] [PMC free article] [PubMed] [Google Scholar]
- 6. Bethel MA, Patel RA, Merrill P, et al; EXSCEL Study Group.Cardiovascular outcomes with glucagon‐like peptide‐1 receptor agonists in patients with type 2 diabetes: a meta‐analysis. Lancet Diabetes Endocrinol. 2018;6:105‐113. [DOI] [PubMed] [Google Scholar]
- 7. Cariou B. Pleiotropic effects of insulin and GLP‐1 receptor agonists: potential benefits of the association. Diabetes Metab. 2015;41:6S28‐26S35. [DOI] [PubMed] [Google Scholar]
- 8. Balena R, Hensley IE, Miller S, Barnett AH. Combination therapy with GLP‐1 receptor agonists and basal insulin: a systematic review of the literature. Diabetes Obes Metab. 2013;15:485‐502. [DOI] [PMC free article] [PubMed] [Google Scholar]
- 9. Castellana M, Cignarelli A, Brescia F, Laviola L, Giorgino F. GLP‐1 receptor agonist added to insulin versus basal‐plus or basal‐bolus insulin therapy in type 2 diabetes: a systematic review and meta‐analysis. Diabetes Metab Res Rev. 2019;35:e3082. [DOI] [PubMed] [Google Scholar]
- 10. Paul SK, Klein K, Thorsted BL, Wolden ML, Khunti K. Delay in treatment intensification increases the risks of cardiovascular events in patients with type 2 diabetes. Cardiovasc Diabetol. 2015;14:100. [DOI] [PMC free article] [PubMed] [Google Scholar]
- 11. Khunti K, Nikolajsen A, Thorsted BL, Andersen M, Davies MJ, Paul SK. Clinical inertia with regard to intensifying therapy in people with type 2 diabetes treated with basal insulin. Diabetes Obes Metab. 2016;18:401‐409. [DOI] [PMC free article] [PubMed] [Google Scholar]
- 12. Tong L, Pan C, Wang H, Bertolini M, Lew E, Meneghini LF. Impact of delaying treatment intensification with a glucagon‐like peptide‐1 receptor agonist in patients with type 2 diabetes uncontrolled on basal insulin: a longitudinal study of a US administrative claims database. Diabetes Obes Metab. 2018;20:831‐839. [DOI] [PMC free article] [PubMed] [Google Scholar]
- 13. Perreault L, Rodbard H, Valentine V, Johnson E. Optimizing fixed‐ratio combination therapy in type 2 diabetes. Adv Ther. 2019;36:265‐277. [DOI] [PMC free article] [PubMed] [Google Scholar]
- 14. Maiorino MI, Chiodini P, Bellastella G, et al. Free and fixed‐ratio combinations of basal insulin and GLP‐1 receptor agonists versus basal insulin intensification in type 2 diabetes: a systematic review and meta‐analysis of randomized controlled trials. Diabetes Obes Metab. 2018;20:2309‐2313. [DOI] [PubMed] [Google Scholar]
- 15. Eng C, Kramer CK, Zinman B, Retnakaran R. Glucagon‐like peptide‐1 receptor agonist and basal insulin combination treatment for the management of type 2 diabetes: a systematic review and meta‐analysis. Lancet. 2014;384:2228‐2234. [DOI] [PubMed] [Google Scholar]
- 16. Chatterjee S, Davies MJ, Khunti K. What have we learnt from “real world” data, observational studies and meta‐analyses. Diabetes Obes Metab. 2018;20(suppl 1):47‐58. [DOI] [PubMed] [Google Scholar]
- 17. Gerstein HC, McMurray J, Holman RR. Real‐world studies no substitute for RCTs in establishing efficacy. Lancet. 2019;393:210‐211. [DOI] [PubMed] [Google Scholar]
- 18. Yang W, Zilov A, Soewondo P, Bech OM, Sekkal F, Home PD. Observational studies: going beyond the boundaries of randomized controlled trials. Diabetes Res Clin Pract. 2010;88:S3‐S9. [DOI] [PubMed] [Google Scholar]
- 19. Fadini GP, Sciannameo V, Franzetti I. et al; for the DARWIN‐T2D network.Similar effectiveness of dapagliflozin and GLP‐1 receptor agonists concerning combined endpoints in routine clinical practice: a multicentre retrospective study. Diabetes Obes Metab. 2019;21:1886‐1894. [DOI] [PMC free article] [PubMed] [Google Scholar]
- 20. Fadini GP, Bonora BM, Lapolla A, Fattor B, et al; for the DARWIN‐T2D Network. Comparative effectiveness of exenatide once‐weekly versus liraglutide in routine clinical practice: a retrospective multicentre study and meta‐analysis of observational studies. Diabetes Obes Metab. 2019;21:1255‐1260. [DOI] [PMC free article] [PubMed] [Google Scholar]
- 21. Fadini GP, Solini A, Manca ML, et al. Effectiveness of dapagliflozin versus comparators on renal endpoints in the real world: a multicentre retrospective study. Diabetes Obes Metab. 2019;21:252‐260. [DOI] [PMC free article] [PubMed] [Google Scholar]
- 22. Fadini GP, Zatti G, Baldi I. et al; for the DARWIN‐T2D network. Use and effectiveness of dapagliflozin in routine clinical practice: an Italian multicentre retrospective study. Diabetes Obes Metab. 2018;20:1781‐1786. [DOI] [PMC free article] [PubMed] [Google Scholar]
- 23. Liu Y, De A. Multiple imputation by fully conditional specification for dealing with missing data in a large epidemiologic study. Int J Stat Med Res. 2015;4:287‐295. [DOI] [PMC free article] [PubMed] [Google Scholar]
- 24. Rubin DB. Multiple imputation after 18+ years. JASA. 2012;91:473‐489. [Google Scholar]
- 25. Rosenstock J, Cheng A, Ritzel R, et al. More similarities than differences testing insulin glargine 300 units/mL versus insulin Degludec 100 units/mL in insulin‐naive type 2 diabetes: the randomized head‐to‐head BRIGHT trial. Diabetes Care. 2018;41:2147‐2154. [DOI] [PubMed] [Google Scholar]
- 26. Zinman B, Philis‐Tsimikas A, Cariou B, et al; on behalf of the NN1250‐3579 (BEGIN Once Long) Trial Investigators. Insulin degludec versus insulin glargine in insulin‐naive patients with type 2 diabetes: a 1‐year, randomized, treat‐to‐target trial (BEGIN once long). Diabetes Care. 2012;35:2464‐2471. [DOI] [PMC free article] [PubMed] [Google Scholar]
- 27. Ji L, Zhang P, Zhu D, et al. Observational registry of basal insulin treatment (ORBIT) in patients with type 2 diabetes uncontrolled with oral antihyperglycaemic drugs: real‐life use of basal insulin in China. Diabetes Obes Metab. 2017;19:822‐830. [DOI] [PubMed] [Google Scholar]
Associated Data
This section collects any data citations, data availability statements, or supplementary materials included in this article.
Supplementary Materials
Appendix S1. Supplementary material.