Abstract
BACKGROUND
Labeling of platelets (PLTs) is required to measure the recovery and survival of transfused PLTs in vivo. Currently a radioactive method is used to label PLTs. However, application of those radiolabeling methods is limited by both safety issues and the inability to isolate transfused PLTs from the circulation. Biotin‐labeled PLTs are an attractive nonradioactive option. However, no validated protocol to biotinylate PLTs is currently available for human studies.
STUDY DESIGN AND METHODS
Six PLT concentrates (PCs) were subaliquoted and biotinylated on Days 1 and 7 of storage. To distinguish the effect of the processing steps from the effects of biotin incubation, two control groups were used: 1) “sham” samples were processed without the biotinylation reagent and 2) control samples were assessed without any processing other than the PC isolation. For the biotinylation procedure, 50 mL of PCs was washed twice and incubated with 5 mg/L biotin for 30 minutes in a closed system. As measures of PLT activation, phosphatidylserine exposure and CD62p expression were assessed.
RESULTS
After biotinylation, 98.4% ± 0.9% of PLTs were labeled. PLT counts, pH, and “swirling” were within the range accepted by the Dutch blood bank for standard PLT products. Biotinylated PLTs were more activated compared than controles but not more than sham samples, but were more activated than the controls.
CONCLUSION
We developed a standardized and reproducible protocol according to Good Practice Guidelines standards, for biotin labeling of PLTs for clinical purposes. This method can be applied as nonradioactive alternative assess survival and recovery of transfused PLTs in vivo.
ABBREVIATIONS
- bioPLT
biotin‐labeled platelets
- GPG
Good Practice Guidelines
- PC(s)
platelet concentrate(s)
- TRAP
thrombin receptor‐activating peptide
Labeling of platelets (PLTs) is required to distinguish transfused PLTs from the recipient's own circulating PLTs. This enables the measurement of recovery and survival of transfused PLTs in vivo. Radiolabeling of PLTs with the radioactive isotopes Indium‐111‐oxin and/or chromium‐51 is currently the gold standard to test for survival and recovery of PLTs.1 This method is used to evaluate the effects of donor, recipient, and PLT storage factors on PLT survival after transfusion in the recipient.2 Also, radiolabeling is required by the Food and Drug Administration (FDA) to analyze the effect of altered PLT storage protocols, such as new additive solutions (ASs) and pathogen reduction technologies.3However, radiolabeling exposes the recipient to potential harmful ionization. Therefore, this method cannot be used in vulnerable patients, in particular, pediatric patients and neonates. Moreover, the use of radiolabeled PLTs is strictly regulated, which limits its applicability for research purposes. In Europe, radiolabeling is restricted to studies in healthy volunteers only. Therefore, a nonradioactive alternative to label PLTs is desired. Biotin, a water‐soluble vitamin (B8) can be used as a nonradioactive label for various cells.4, 5, 6, 7, 8, 9 The N‐hydroxysuccinimide ester of the biotin reagent binds in a nonspecific manner to cell surface proteins of the PLT (Fig. 1A, biotinylation of PLTs). Unlike radiolabeling, biotin labeling has the major advantage that it is possible to selectively isolate biotin‐labeled PLTs from the recipients' circulation. Also, a biotin label can even be used to trace multiple PLT populations concurrently by using different densities of the biotin label per PLT.
Figure 1.
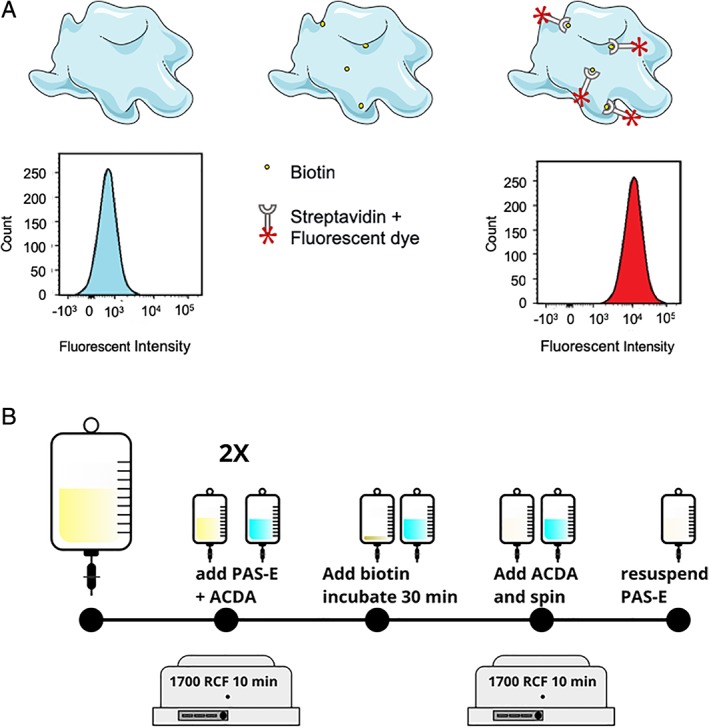
Biotinylation of PLTs and biotinylation procedure. (A) PLTs (top left) are incubated with sulfo‐NHS‐biotin (top middle), and bioPLT are counterstained with fluorescently labeled streptavidin (top right). Unlabeled PLTs show a characteristic FACS histogram; the fluorescently labeled biotin‐streptavidin causes the peak of the histogram to shift horizontally. (B) A proportion of the PC was washed twice in PAS‐E. Before each washing step, the PC was acidified to 10% ACD‐A. PLTs were incubated with 5 mg/L biotin and diluted in PBS:PAS‐E (1:9), for 30 minutes. BioPLT were washed and resuspended in PAS‐E. [Color figure can be viewed at http://wileyonlinelibrary.com]
Recently, our group reported a protocol for the biotinylation of red blood cells (RBCs), according to Good Practice Guidelines (GPG).10 This product is currently available for clinical use and the first trials have started recruiting patients. (Registered at trialregister.nl NTR6596, NTR6492). However, labeling of PLTs is difficult compared to RBCs, due to their propensity to become activated.
Biotin labeling of PLTs has been used in various animal models7, 11, 12 and 20 years ago, biotin‐labeled PLTs (bioPLT) were safely infused in humans for the first time.13 In this pilot study, PLT recovery was measured after infusion of biotinylated PLTs in 10 healthy male subjects. However, this study was hampered by activation of the PLTs during biotinylation. We developed a method to minimize PLT activation during biotinylation. Because PLT concentrates (PCs) are particularly prone to bacterial contamination compared to other blood products, a method for biotinylating PLTs in a closed system was developed. In this article, we describe the results of a method to produce a biotinylated PLT product in a closed system, in accordance to GPG, with minimal PLT activation, which can be used in clinical research in humans.
MATERIALS AND METHODS
PCs
Platelet concentrates were manufactured and stored by Sanquin Blood Bank, according to the Dutch Blood Bank standards. Whole blood collections (500 mL) were obtained from volunteer, nonremunerated donors. Whole blood was centrifuged and separated after overnight hold into RBCs, plasma, and buffy coats. To obtain a PC, pooled buffy coats from five donors were resuspended in 100% plasma or 65% PAS‐E (Terumo BCT, Inc.) and 35% plasma and leukoreduced by filtration. Single‐donor apheresis PCs were obtained according to the manufacturer's instructions (Trima, Terumo BCT). PCs were stored under gentle agitation, at 20 to 24°C. Informed consent to use their blood for research purposes was obtained from all donors. The validation protocol was approved by the Sanquin Department of Quality Assurance.
Preparation of the biotin solution
Sulfo‐NHS‐biotin was dissolved in phosphate‐buffered saline (PBS; 140.3 mmol/L NaCl, 10.9 mmol/L Na2HPO4·2H2O, 1.8 mmol/L NaH2PO4·2H2O, pH 7.4; Fresenius Kabi) to a concentration of 50 mg/L (EZ‐link Sulfo‐NHS‐Biotin, 100 mg; Thermo Fisher Scientific). The sulfo‐NHS‐biotin solution was sterilized by passing it through a 0.22‐μm filter (Fresenius HemoCare, Fresenius Kabi) using a sterile connection device (sterile tubing welder, TSCD II, Terumo BCT) and a 600‐mL container (Compoflex, Fresenius Kabi). After filtration of the sulfo‐NHS‐biotin solution, the biotinylation took place in a closed system, to prevent microbiologic contamination. To obtain the final concentration of 5 mg/L, the sulfo‐NHS‐biotin solution was diluted 1:9 in PLT AS (PAS‐E: 0.030% MgCl·12H2O, 0.037% KCl, 0.105% NaH2PO4·2H2O, 0.318% C6H5Na3O7·2H2O, 0.405% NaCl, 0.442%, C2H3NaO2·3H2O, 0.769% Na2HPO4·12H2O, pH 7.1‐7.5; Terumo BCT), divided into portions of 100 mL, and used within 30 minutes after diluting.
Standardized PLT biotinylation procedure
The biotinylation procedure is depicted in Fig. 1B. Biotinylation of PLTs was performed in a closed system. The full protocol for biotinylation of PLTs is provided in Appendix S1. A 50‐mL portion of PC was transferred to a small transfer bag. Transfusion of a biotinylated PC aliquot of 50 mL would theoretically achieve a bioPLT enrichment of 2.5% to 7% in healthy subjects. Plasma proteins that could interfere with biotinylation were reduced by washing the PC twice for PCs stored in plasma or once for PCs stored in 65% PAS‐E. Before centrifugation, samples were acidified by ACD‐A (Terumo BCT) to prevent irreversible clumping during centrifuging (1700 × g for 10 min). For the first washing step, 100 mL of 8.5:1.5 PAS‐E:ACD‐A solution was added to the 50 mL of PC. A quantity of 150 mL of a 9:1 PAS‐E:ACD‐A solution was added or the second washing step. The washed PLTs were incubated with the 100 mL of biotin solution, for 30 minutes, under gentile agitation, at 22°C. Twelve milliliters of ACD‐A was added before centrifugation (1700 × g for 10 min), after which the biotinylated PLTs were resuspended in PAS‐E, to their original volume of 50 mL. To confirm biotinylation, samples of both biotinylated and unbiotinylated PLTs were counterstained with streptavidin 488 (1:200), Alexa Fluor 488 conjugate (Thermo Fisher Scientific, Cat. No. S32354), incubated for 30 minutes at room temperature, washed (1700 × g for 10 min) and measured by flow cytometry on a flow cytometer (LSRII + HTS, BD Biosciences). Data were analyzed with computer software (FlowJo v(CFC)).
Validation experiment
For the validation procedure, aliquots of six in plasma stored PCs were biotinylated on Days 1 and 7 of storage. At these time points a “sham” sample was also obtained from the same unit, in which all processing steps were identical to the biotinylated samples, except the incubation with sulfo‐NHS‐biotin, which was replaced by incubation with a 1:9 PBS:PAS‐E solution. PLTs that were biotinylated after 1 day of storage were subsequently stored for 2 more days and tested for biotinylation and quality variables (hence, on Day 3 of storage after donation). To show applicability to various types of PCs, three PCs that were obtained via apheresis and three PCs stored in 65% PAS‐E were also biotinylated on Day 1 of storage.
Storage of bioPLT
Two methods of storage of bioPLT were tested: first 50 mL of bioPLT and sham PLTs were stored for 3 days after processing and then tested for quality variables (Fig. S1B, available as supporting information in the online version of this paper). Since this led to unacceptably high PLT activation, a second method was tested. We hypothesized that storage of a small sample in this storage bag caused the high PLT activation. Therefore, 50 mL of bioPLT was returned to the retained original PC, resulting in the original volume of approximately 330 mL consisting of labeled and unlabeled PLTs (Fig. S1C, available as supporting information in the online version of this paper). Therefore, triple staining was necessary to distinguish PLT activation of the unlabeled and labeled PLTs, on the day of biotinylation and on Day 4 to Day 7 of storage.
Additional conditions
To evaluate the effect of storage of the sulfo‐NHS‐biotin solution on biotinylation, a part of the sulfo‐NHS‐biotin–PBS solution was stored within 30 minutes after dilution at −30(±5)°C. After 42 days the frozen sulfo‐NHS‐biotin–PBS solution was thawed at 37°C for 10 minutes to approximately 20°C. After being thawed, the sulfo‐NHS‐biotin–PBS solution was diluted 10 times with PAS‐E (at 20°C) to a final concentration of 5 mg/L, aliquoted to portions of 100 mL, and used within 30 minutes.
To analyze the effect of irradiation on the biotin label, biotin‐labeled PLTs were irradiated after labeling with a dose of 25 Gy (according to standard blood bank regulations). Samples were obtained before and after irradiation to assess the effect of this treatment on the biotin label.
PLT quality variables
Ranges for quality variables were predefined according to local blood bank guidelines and are shown in Table 1. Blood gas analysis was performed to determine the pH of the PCs (Rapidlab 1265, Siemens Medical Solution Diagnostics). PLT counts were measured on a hematology analyzer (Advia 2120, Siemens Medical Solutions Diagnostics).
Table 1.
PLT quality variables
| Referencevalues | Biotinylationon day | PLT count (800‐1600 [×109]) | pH(6.3‐7.5) | Swirl(>1) | Morphology >200 | ATP* |
|---|---|---|---|---|---|---|
| Control (n = 6) | Day 1 | 1126 (1016‐1202) | 7.2 (7.2‐7.2) | 3 (3‐3) | 270 (260‐288) | 42.6 (5.3) |
| Day 7 | 1083 (1004‐1152) | 7.1 (7.1‐7.2) | 3 (3‐3) | 245 (233‐250) | 40.6 (5.3) | |
| Sham (n = 6) | Day 1 | 971 (890‐1034) | 7.1 (7.0‐7.1) | 3 (3‐3) | 245 (233‐269) | 34.2 (3.6) |
| Day 7 | 997 (934‐1113) | 7.0 (7.0‐7.1) | 3 (3‐3) | 210 (205‐215) | 27.3 (3.4) | |
| Biotin (n = 6) | Day 1 | 1034 (965‐1166) | 7.0 (7.0‐7.0) | 3 (3‐2.3) | 258 (240‐275) | 33.2 (4.4) |
| Day 7 | 949 (928‐992) | 7.01 (7.1‐7.1) | 3 (3‐3) | 213 (199‐226) | 29.6 (4.9) |
No predefined range exists for ATP levels according to our local blood bank guidelines.
The morphology of the PLTs was assessed both noninvasive (swirl) and invasive (microscopically). To perform the PLT swirling test, the motion of the PLTs was assessed visually by gently moving the bag in front of a light source. The swirl was recorded as positive (3), moderate (2), impaired (1), or absent (0). The test was performed by an independent, experienced, laboratory staff member, who was blinded for the intervention. PLT morphology was also assessed by light microscopy, for which 50 μL of PC was mixed with 250 μL 0.5% glutaraldehyde (Merck) in PBS. The fixed PLTs were visualized with a 1000× magnification (Axio, Zeis).
Baseline PLT activation was assessed by CD62P expression.14 The samples were incubated for 20 minutes at room temperature with PE‐mouse anti‐human CD62P (BD PharMingen Biosciences) and FITC‐mouse antihuman CD61 (BD PharMingen Biosciences). For the triple staining, PLTs were also incubated with streptavidin 647 (1:200), Alexa Fluor 647 conjugate (Thermo Fisher Scientific, Cat. No. S32357). Immunoglobulin G1 mouse PE conjugated (Immunotech SAS, Beckman Coulter) was used as isotype control for the CD62P activation. To assess PLTs' ability to become activated, PLTs were incubated simultaneously with CD61 and CD62P. Agonists used were 625 nmol/L thrombin receptor‐activating peptide (TRAP‐6‐amide/trifluoracetate salt, Bachem AG) or 125 μL/ L of adenosine diphosphate (ADP, Chronolog). The reaction was stopped after 20 minutes by adding 1% formaldehyde (Merck) in PBS.15 Annexin V binding was assessed as a marker for phosphatidylserine, as described.16 Flow cytometry was performed using a flow cytometer (LSRII + HTS, BD Biosciences). Data were analyzed with computer software (FlowJo v (CFC)).
The nucleotide content of the PLTs was assessed in neutralized perchloric acid extracts, which were stored at −80°C, until batch analysis with high‐performance liquid chromatography using a cation exchange, column as described previously.4, 17 PCs were cultured by a microbial detection system (BacT/ALERT, bioMérieux), both before and after the biotinylation procedure, to rule out bacterial contamination.
Statistical analysis
Statistical analyses were performed in R, Version 3.5.0. Variables were assessed for normality and corresponding statistical tests were performed (paired t test for parametric data, Mann‐Whitney U test for nonparametric data). Differences were considered to be significant if the p value was less than 0.05.
RESULTS
Biotinylation of PCs
Six pooled buffy coat–derived PCs in plasma, three pooled buffy coat–derived PCs in 65% PAS‐E/35% plasma, and three apheresis PCs in plasma were biotinylated as described in the protocol (Appendix S1). After the biotinylation procedure, 98.4% ± 0.9% and 99.0% % ± 0.9% of PLTs were labeled with biotin on Days 1 and 7 of storage, respectively (Fig. 2). There was no difference in biotinylation of PCs obtained from pooled buffy coats and stored in plasma compared to apheresis PCs and PCs stored in PAS‐E. The unbiotinylated fraction and the biotinylated fraction of the PC could be visualized as two distinctive populations on flow cytometry. We confirmed that biotin labeling of PLTs is still successful after 42 days of storage of the dissolved biotin solution at −30°C (Fig. 3). Irradiation of the biotin‐labeled PC with a standard dose of 25 Gy did not affect the degree of biotinylation. (Fig. 3). It was not possible to incubate the PLTs with biotin and add ACD‐A simultaneously. (Fig. 3). This would have reduced one processing step. The reduction of biotinylation after additions of ACD‐A is probably due to a lower pH.
Figure 2.
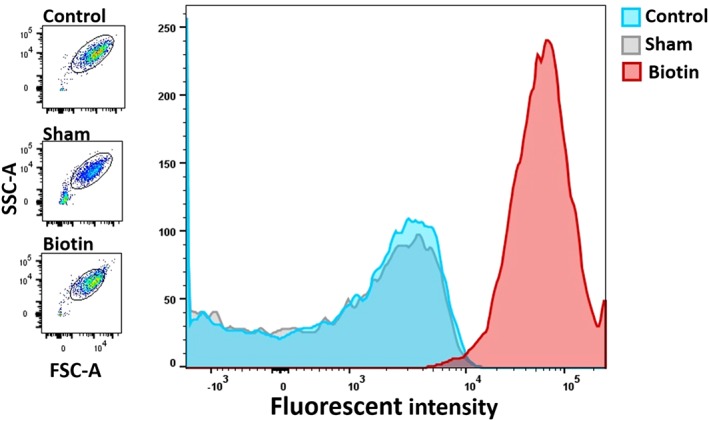
Flow cytometric analysis of unlabeled (blue), sham (gray), and bioPLT (red), after incubation with streptavidin 488. The bioPLT show a significantly higher fluorescent intensity compared to the sham and control PLTs. A total of 98.4% ± 0.9% of bioPLT were biotinylated and can be visualized as a distinct population. Scatters of all three populations are similar (left). Images are from a selected PC, but are representative for the other experiments (n = 6). [Color figure can be viewed at http://wileyonlinelibrary.com]
Figure 3.
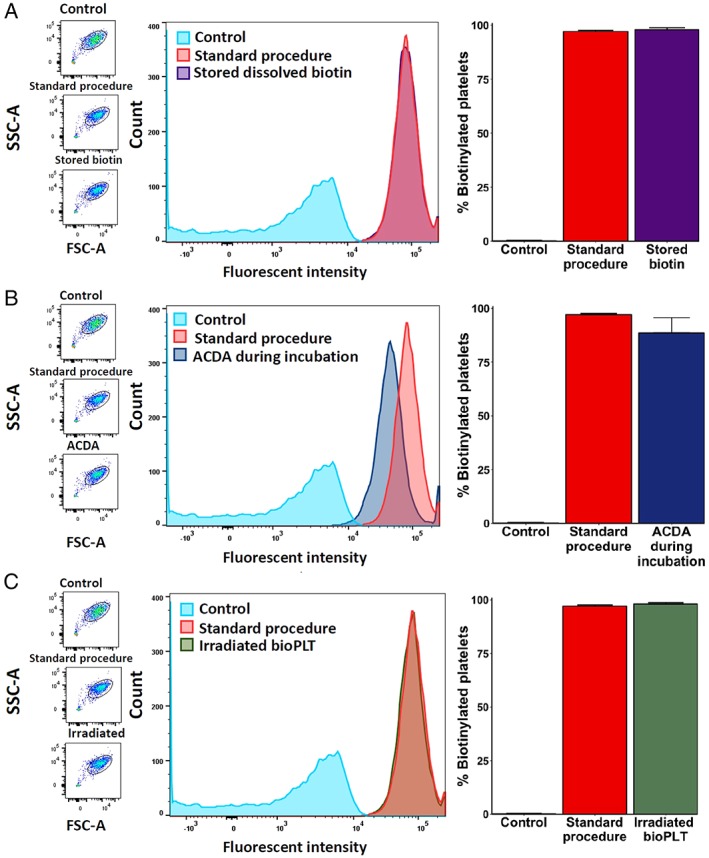
Biotinylation in various conditions. (A) Biotinylation performed with biotin stored in PBS for 42 days at −30°C. There was no difference between freshly dissolved biotin and a stored biotin solution (means, 97.9 and 97.1%, respectively; n = 3). (B) Adding ACD‐A simultaneously with the biotin led to a decrease of the amount of bioPLT (mean, 88.5% vs. 97.10%, n = 3). (C) Irradiation with 25 Gy did not influence the amount of bioPLT (mean, 98.1%) . [Color figure can be viewed at http://wileyonlinelibrary.com]
Effects of the biotinylation procedure on PLT quality variables
Platelet quality variables were assessed to assure that bioPLT met the requirements of the Dutch blood bank. Ranges for quality variables were predefined and are expressed in Table 1. PLT counts, pH, and “swirling” score were within the range accepted by the Dutch blood bank for all products. Morphology scores were higher for control PLTs, compared to sham and bioPLT. There was no significant difference between sham and bioPLT morphology scores, indicating that the difference to control was caused by the processing steps with repeated centrifugation steps and not by incubation with biotin. The procedure led to a marginal decrease in PLT count. Annexin V binding was not affected by the procedure (Fig. 4). CD62P expression was increased to the same extent in both the sham PLTs and the bioPLT (Fig. 5). Hence, the processing steps, but not biotin itself, led to activation of PLTs. The percentage of CD62P activation met blood bank standards. All samples showed maximal response to TRAP (Fig. 5). Similar results were observed in apheresis derived PCs and in PAS‐E–stored PCs (Table S1, available as supporting information in the online version of this paper). All blood products were culture negative before and after biotinylation.
Figure 4.
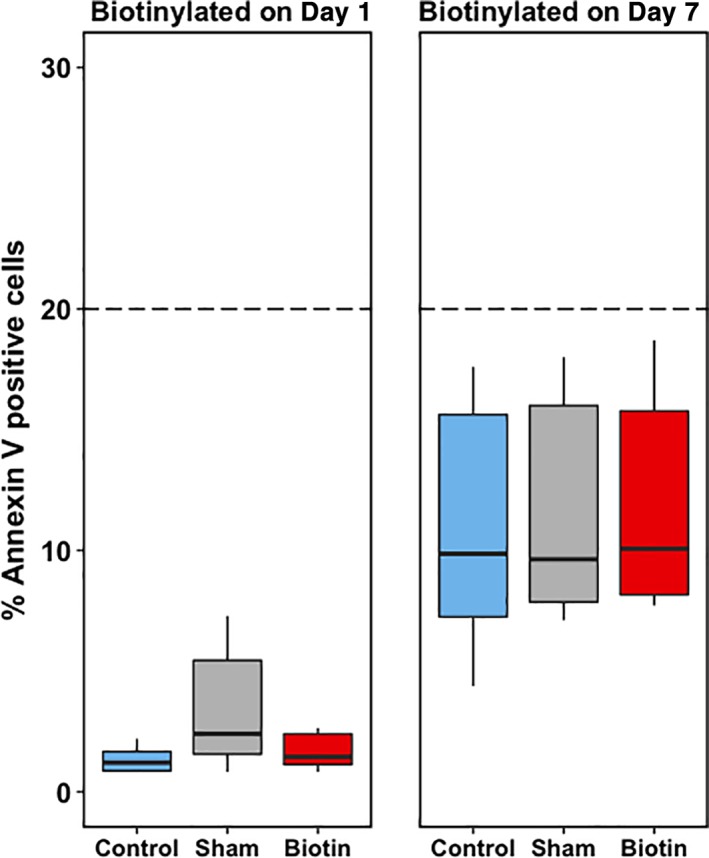
Annexin V expression of a fresh PC (Day 1, left panel, n = 6) and a stored PC (Day 7, right panel, n = 6). On Day 1, the bioPLT did not show a significant difference in Annexin V–positive cells, compared to control, 1.2% (0.9%‐1.7%; p = 0.56), and sham, 3.4% (1.6%‐5.5%; p = 0.16). On Day 7, the bioPLT also showed no significant difference in annexin V–positive cells: bioPLT, 10.1% (8.2%‐15.8%), compared with control, 9.9% (7.3%‐15.6%; p = 0.09), and sham, 9.6% (7.9%‐16.0%; p = 0.16). [Color figure can be viewed at http://wileyonlinelibrary.com]
Figure 5.
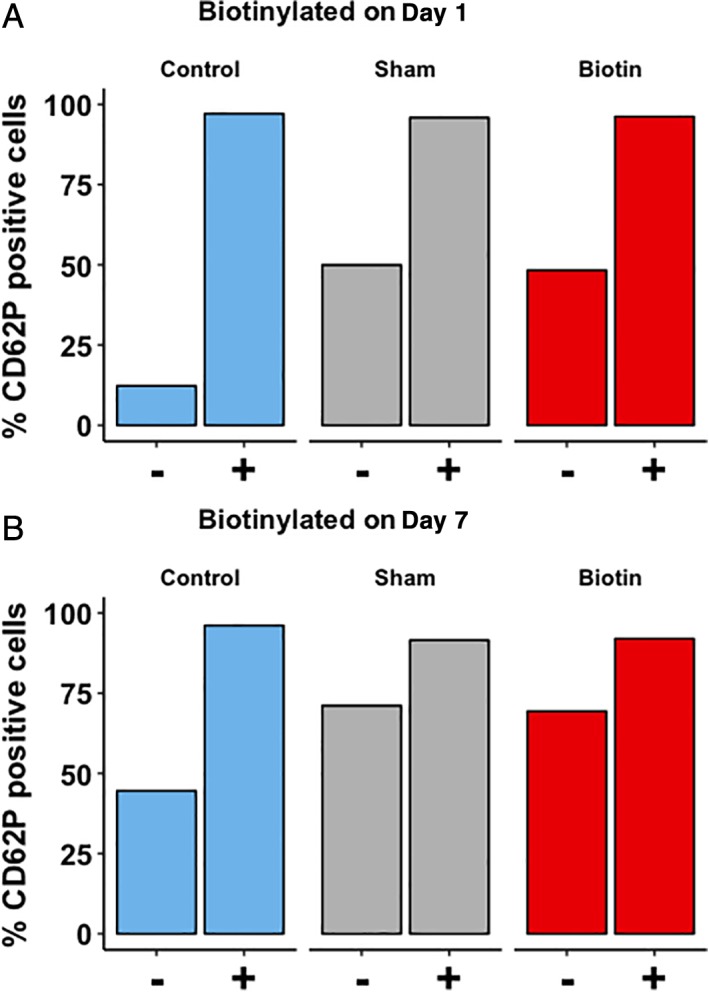
CD62P expression of a fresh PC (Day 1, A) and a stored PC (Day 7, B). For each condition, left bars (−) represent the unstimulated state, and right bars (+) represent CD62P expression in response to TRAP. After incubation with TRAP, all samples showed an increase in CD62P‐positive cells. On Day 1, the number of CD62P‐positive cells increased in both bioPLT, 48.4% (41.7%‐56.2%), and sham, 50.0% (41.7%‐56.2%), compared to control PLTs, 12.3% (9.5%‐12.7%; p = 0.03). On Day 7, more cells were CD62P positive in the bioPLT, 69.60% (64.5%‐70.3%), and sham, 71.2% (66.4%‐75.7%), compared to the control PLTs, 44.6% (39.7%‐50.3; p = 0.03). No significant difference was observed in comparing CD62P expression after incubation with TRAP in bioPLT with control (Day 1, p = 0.84; Day 7, p = 0.69) or sham PLTs (Day 1, p = 0.11; Day 7, p = 0.13). [Color figure can be viewed at http://wileyonlinelibrary.com]
The effect of storage on PLT quality variables
Platelet quality variables were measured directly after biotinylation of a 50‐mL aliquot of fresh (Day 1) and stored (Day 7) buffy coat–derived PCs. Both fresh and stored PLTs fulfilled PLT quality standards after biotinylation (Table 1). PLTs that were biotinylated on Day 1 of storage were subsequently stored for 3 additional days and tested for stability of the biotin label and PLT quality variables. Storage of bioPLT in the small aliquot volume of 50 mL led to substantial decrease of PLTs quality (data not shown). This might be due to the suboptimal storage and not to biotinylation itself. Therefore, for three PCs we transferred the biotinylated aliquot back to the retained fraction of the original PC and stored this PC for 7 days. BioPLT could be distinguished from the unbiotinylated PLTs (Fig. 6A). Both biotinylated and unbiotinylated showed minimal PLT activation, as expressed by CD62P expression (Fig. 6B). We confirmed that bioPLT can be stored for 7 days using this method; all PLT quality markers met Dutch blood bank quality standards.
Figure 6.
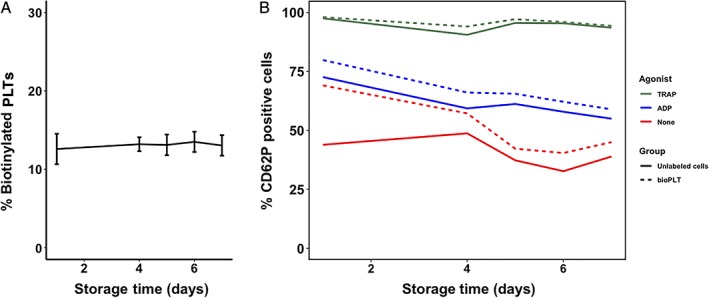
Stability of biotin label and CD62P expression of stored bioPLT. BioPLT were returned to the retained fraction of the original PC, to enhance storage conditions (n = 3). (A) The percentage of biotinylated PLTs remained stable throughout 7 days of storage. (means, 12.6% on Day 1 and 13.0% on Day 7). (B) CD62P expression was assessed in unstimulated PLTs (red), after stimulation with ADP (blue) and TRAP (green). CD62P expression was determined in both labeled (dotted lines) and unlabeled cells (continuous line). Measurements were performed on Days 1, 4, 5, 6, and 7 (n = 3). [Color figure can be viewed at http://wileyonlinelibrary.com]
DISCUSSION
Here, we describe a reproducible protocol for biotin labeling of PCs under GPG conditions in a closed system. Showing a low within‐unit and unit‐to‐unit variation. The findings will be of interest to blood banks and clinical researchers. BioPLT can be used to evaluate the in vivo effect of new ASs, donor variability, and the effect of transfusion in various patient categories.
The major advantage of biotin is that it enables in vivo tracing of transfused PLTs without exposing the recipient to radiation. Moreover, bioPLT enable tracing of multiple populations concurrently. Also, bioPLT can be isolated from venous blood samples, thereby permitting direct population analysis for surface markers and metabolomics composition of the PLT subgroups. HLA discrepancy is another nonradioactive method to discriminate transfused PLTs from the patients' circulating PLTs.18 However, this method inherently requires a HLA discrepancy, which excludes the possibility of tracing HLA‐matched PLT transfusions or autologous transfusions in the recipient. Isolation and subanalyses of PLTs are also not possible with this method.
Biotinylation of PLTs has previously been described under invalidated, experimental conditions.1, 13 Our protocol fulfills GPG requirements. Since US FDA guidelines differ from European GPG requirements, the protocol needs to be validated according to the FDA standard before it can be implemented in the United States. Our work can serve as a reference method.
We adapted the previous protocol on various crucial points (Table 2).13 After sterile filtration of the sulfo‐NHS‐biotin solution, the procedure took place in a closed system, minimizing the risk of bacterial contamination. We added an extra washing step, to minimize nonspecific biotinylation of plasma proteins in the PC. Our group showed that PAS‐E can be used to optimize PLT storage.19 We tested whether PAS‐E could be used to store the sulfo‐NHS‐biotin solution (for 42 days at <−30°C). However, the quality of biotinylation decreased after storage of dissolved biotin in PAS‐E. The biotin label remained stable when dissolved and stored at less than −30°C in PBS. Therefore, sulfo‐NHS‐biotin was dissolved and stored in PBS at a concentration of 50 mg/L. Shortly before biotinylation, the sulfo‐NHS‐biotin solution was diluted in PAS‐E in a 1:9 ratio, to obtain a concentration of 5 mg/L. Since the reactive group of dissolved sulfo‐NHS‐biotin is instable, the sulfo‐NHS‐biotin solution should be used either within 30 minutes or after frozen storage at less than −30°C, to be used within 42 days of storage. After being thawed, the solution should be used within 30 minutes, to avoid hydrolysis. Since more than 97% of all PLTs were biotinylated using our protocol, we found 30 minutes of incubation to be sufficient to adequately biotinylate PLTs, instead of the previously described 45 minutes.1
Table 2.
Adaptations on the previously described protocol
| Protocol described by Van Der Meer14 | Our protocol | Advantage |
|---|---|---|
|
A PLT sample is centrifuged, with the supernatant replaced by the biotin solution. |
Centrifuged and supernatant removed twice before incubation. | Limits rest‐biotinylation of proteins in PC. |
| Incubation in saline in which biotin is added at a final concentration of 25 mg/L. | The biotin solution was diluted 1:9 in PAS‐E. | Less activation of the PLTs. |
| Incubation for 45 min. | Incubation for 30 min. | Time reducing. |
|
Resuspended in saline/ACD. 250 mL |
Resuspended in PAS‐E. 50 mL |
Superior storage conditions, mimics PC more realistically. Minimal amount of traceable PLTs. |
BioPLT and sham samples showed equal decreases in PLT quality variables compared to control PLTs. Hence, PLTs were affected by the processing steps, but not by biotin itself. The processing steps are similar to the steps in obtaining PLT volume–reduced products, which have been in use for several years and showed, after correction for PLT loss during preparation, similar cell count increment as standard PCs.20, 21, 22 Centrifugation of PLTs has previously been suggested to activate PLTs,23 which is not completely prevented by the addition of ACD‐A. Radiolabeling of PLTs also requires centrifugation steps.24 Since the processing steps, and not the biotin, led to PLT activation, similar results can be expected for radiolabeling. We found that exposure to saline or PBS is detrimental to PLT quality; incubating PLTs in a PBS‐sulfo‐NHS‐biotin or saline solution led to unacceptably high activation of PLTs (data not shown). Therefore the PBS‐biotin was diluted in PAS‐E. To our knowledge, no data are available on the effect of radiolabeling on PLT quality variables. However, in previous labeling studies, PLTs were incubated in saline, both for radiolabeling and for biotin labeling,13, 24 which might be not optimal with respect to PLT quality. We recommend a comparative study to assess PLT activation in both bioPLT and radiolabeled PLTs.
An important limitation of our study is that biotin labeling has not yet been compared to radioactive labeling in humans. However, in dogs, survival of bioPLT was comparable to PLTs labeled with both indium‐111 oxine or chromium‐51.7 BioPLT survived normally after transfusion and could be used for determining PLT life spans in vivo. The PLT life span curves of bioPLT were in agreement with radiolabeled PLTs.
Red blood cell labeling studies showed modification of antigens and the risk of antibody formation against the biotin.25, 26 These antibodies did not affect RBC recovery and survival in the recipient. However, this limits the possibility of repeated transfusions with bioPLT for clinical research. To minimize the risk of antibody formation we labeled at the lowest possible traceable biotin density. Future research should include the assessment of the formation of antibodies against bioPLT. BioPLT will be first administered in an autologous transfusion model in healthy volunteers (registered at trialregister.nl, NTR6493). In conclusion, we developed a standardized, simple, reproducible, protocol according to GMP standards for biotin labeling of PLTs, as nonradioactive alternative to trace and isolate transfused PLTs in vivo.
CONFLICT OF INTEREST
The authors have disclosed no conflicts of interest.
Supporting information
Appendix S1. Supporting Information.
Contributor Information
Eric Gouwerok, Email: d.dekorte@sanquin.nl.
Dirk de Korte, Email: d.dekorte@sanquin.nl.
REFERENCES
- 1. van der Meer PF, Tomson B, Brand A. In vivo tracking of transfused platelets for recovery and survival studies: an appraisal of labeling methods. Transfus Apher Sci 2010;42:53‐61. [DOI] [PubMed] [Google Scholar]
- 2. Arnold DM, Heddle NM, Kulczycky M, et al. In vivo recovery and survival of apheresis and whole blood‐derived platelets: a paired comparison in healthy volunteers. Transfusion 2006;46:257‐64. [DOI] [PubMed] [Google Scholar]
- 3. Murphy S. Radiolabeling of PLTs to assess viability: a proposal for a standard. Transfusion 2004;44:131‐3. [DOI] [PubMed] [Google Scholar]
- 4. Bontekoe IJ, van der Meer PF, van den Hurk K, et al. Platelet storage performance is consistent by donor: a pilot study comparing "good" and "poor" storing platelets. Transfusion 2017;57:2373‐80. [DOI] [PubMed] [Google Scholar]
- 5. Mrša V, Tanner W. Role of NaOH‐extractable cell wall proteins Ccw5p, Ccw6p, Ccw7p and Ccw8p (members of the Pir protein family) in stability of the Saccharomyces cerevisiae cell wall. Yeast 1999;15:813‐20. [DOI] [PubMed] [Google Scholar]
- 6. Mock DM, Lankford GL, Widness JA, et al. Measurement of circulating red cell volume using biotin‐labeled red cells: validation against 51Cr‐labeled red cells. Transfusion 1999;39:149‐55. [DOI] [PubMed] [Google Scholar]
- 7. Heilmann E, Friese P, Anderson S, et al. Biotinylated platelets: a new approach to the measurement of platelet life span. Br J Haematol 1993;85:729‐35. [DOI] [PubMed] [Google Scholar]
- 8. Hurley WL, Finkelstein E, Holst BD. Identification of surface proteins on bovine leukocytes by a biotin‐avidin protein blotting technique. J Immunol Methods 1985;85:195‐202. [DOI] [PubMed] [Google Scholar]
- 9. Cavill I, Trevett D, Fisher J, et al. The measurement of the total volume of red cells in man: a non‐radioactive approach using biotin. Br J Haematol 1988;70:491‐3. [DOI] [PubMed] [Google Scholar]
- 10. de Back DZ, Vlaar R, Beuger B, et al. A method for red blood cell biotinylation in a closed system. Transfusion 2018;58:896‐904. [DOI] [PubMed] [Google Scholar]
- 11. Ault KA, Knowles C. In vivo biotinylation demonstrates that reticulated platelets are the youngest platelets in circulation. Exp Hematol 1995;23:996‐1001. [PubMed] [Google Scholar]
- 12. Valeri CR, MacGregor H, Barnard MR, et al. Survival of baboon biotin‐X‐N‐hydroxysuccinimide and (111)In‐oxine‐labelled autologous fresh and lyophilized reconstituted platelets. Vox Sang 2005;88:122‐9. [DOI] [PubMed] [Google Scholar]
- 13. Stohlawetz P, Horvath M, Pernerstorfer T, et al. Effects of nitric oxide on platelet activation during plateletpheresis and in vivo tracking of biotinylated platelets in humans. Transfusion 1999;39:506‐14. [DOI] [PubMed] [Google Scholar]
- 14. Berman C, Yeo E, Wencel‐Drake J, et al. A platelet alpha granule membrane protein that is associated with the plasma membrane after activation. Characterization and subcellular localization of platelet activation‐dependent granule‐external membrane protein. J Clin Invest 1986;78:130‐7. [DOI] [PMC free article] [PubMed] [Google Scholar]
- 15. Bontekoe IJ, van der Meer PF, de Korte D. Determination of thromboelastographic responsiveness in stored single‐donor platelet concentrates. Transfusion 2014;54:1610‐8. [DOI] [PubMed] [Google Scholar]
- 16. Dekkers DW, De Cuyper IM, van der Meer PF, et al. Influence of pH on stored human platelets. Transfusion 2007;47:1889‐95. [DOI] [PubMed] [Google Scholar]
- 17. de Korte D, Haverkort WA, van Gennip AH, et al. Nucleotide profiles of normal human blood cells determined by high‐performance liquid chromatography. Anal Biochem 1985;147:197‐209. [DOI] [PubMed] [Google Scholar]
- 18. Hughes DL, Evans G, Metcalfe P, et al. Tracking and characterisation of transfused platelets by two colour, whole blood flow cytometry. Br J Haematol 2005;130:791‐4. [DOI] [PubMed] [Google Scholar]
- 19. van der Meer PF, Bontekoe IJ, Daal BB, et al. Riboflavin and UV light treatment of platelets: a protective effect of platelet additive solution? Transfusion 2015;55:1900‐8. [DOI] [PubMed] [Google Scholar]
- 20. Dumont LJ, Taylor LA, Van Waeg G. Method and apparatus for collecting hyperconcentrated platelets: Google Patents, US6022306A. 2000 Feb 8. Available at: https://patents.google.com/patent/US6022306.
- 21. van der Meer PF, Bontekoe IJ, Kruit G, et al. Volume‐reduced platelet concentrates: optimization of production and storage conditions. Transfusion 2012;52:819‐27. [DOI] [PubMed] [Google Scholar]
- 22. Honohan A, Tomson B, van der Bom J, et al. A comparison of volume‐reduced versus standard HLA/HPA‐matched apheresis platelets in alloimmunized adult patients. Transfusion 2012;52:742‐51. [DOI] [PubMed] [Google Scholar]
- 23. Rock G, Haddad SA, Poon AO, et al. Reduction of plasma volume after storage of platelets in CP2D. Transfusion 1998;38:242‐6. [DOI] [PubMed] [Google Scholar]
- 24. The Biomedical Excellence for Safer Transfusion (BEST) Collaborative . Platelet radiolabeling procedure. Transfusion 2006;46:59S‐66S. [Google Scholar]
- 25. Cordle DG, Strauss RG, Lankford G, et al. Antibodies provoked by the transfusion of biotin‐labeled red cells. Transfusion 1999;39:1065‐9. [DOI] [PubMed] [Google Scholar]
- 26. Schmidt RL, Mock DM, Franco RS, et al. Antibodies to biotinylated red blood cells in adults and infants: improved detection, partial characterization, and dependence on red blood cell‐biotin dose. Transfusion 2017;57:1488‐96. [DOI] [PMC free article] [PubMed] [Google Scholar]
Associated Data
This section collects any data citations, data availability statements, or supplementary materials included in this article.
Supplementary Materials
Appendix S1. Supporting Information.


