
Figure 2.
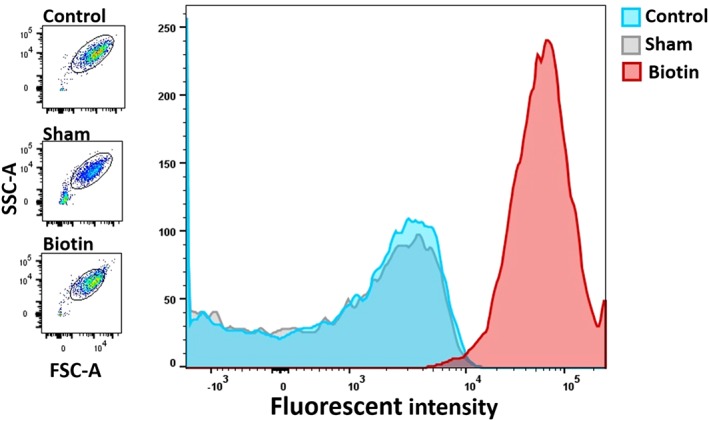
Flow cytometric analysis of unlabeled (blue), sham (gray), and bioPLT (red), after incubation with streptavidin 488. The bioPLT show a significantly higher fluorescent intensity compared to the sham and control PLTs. A total of 98.4% ± 0.9% of bioPLT were biotinylated and can be visualized as a distinct population. Scatters of all three populations are similar (left). Images are from a selected PC, but are representative for the other experiments (n = 6). [Color figure can be viewed at http://wileyonlinelibrary.com]