

Abstract
Chemotherapeutic drugs that induce DNA damage have the potential to kill cancer cells, but DNA repair protects cells from damage‐induced cell death. Thus, eliminating DNA repair is a potential approach to overcome cell drug resistance. In this study, we observed that the gene expression of C‐terminal binding protein interacting protein (CTIP) was promoted by TNF‐α stimulation and prevented TNF‐α‐induced double‐strand breaks (DSBs) in the genomes of cervical cancer cells. The putative miR‐130b targeted site within 3′ untranslated region (UTR) of CTIP mRNA was identified through in silico analysis and confirmed based on experimental data. By targeting the CTIP gene, miR‐130b caused the accumulation of DSBs and accelerated cell apoptosis in combination with poly ADP ribose polymerase (PARP) inhibitors. Additionally, overexpression of the CTIP gene elevated cancer cell viability by promoting proliferation while miR‐130b antagonized CTIP‐stimulated cell reproduction. Consequently, miR‐130b destruction of DNA repair should be employed as a strategy to treat cervical cancer.
Significance of the study
Cervical cancer threatens the health of women all over the world. In this study, we observed that miR‐130b was able to cause the accumulation of DNA double‐strand breaks through suppressing the gene expression of C‐terminal binding protein interacting protein and to accelerate cell apoptosis by preventing DNA damage repairs in cervical cancer cells. As far as we know, the impact of miR‐130b on the DNA double‐strand break repair and on the cell apoptosis induced by the destruction of DNA repair in cervical cancer cells was firstly documented. It is reasonable to believe that miR‐130b destruction of DNA repair may be employed as a strategy to treat cervical cancer in the future.
Keywords: apoptosis, C‐terminal binding protein interacting protein, double‐strand break, miR‐130b, proliferation
1. INTRODUCTION
Cervical cancer is a major public health concern of women worldwide. This cancer was the fourth most common disease in women.1 From 2007 to 2011, there was a slight reduction in the cervical cancer incidence rate per year, but the death rate had no change in the United States.2 The most recent investigation in Kazakhstan showed that the prevalence of human papillomavirus (HPV) infection ranges from 43.8% to 55.8%, and the incidence of cervical cancer has increased to approximately 3000 new cases each year.3 These reports suggested that more effective approaches in the treatment of cervical cancer are still needed.
Both the integrity and stability of genomic DNA are important in living cells, but DNA is subject to chemical reactions. Intrinsic or extrinsic stimuli have the ability to damage DNA.4, 5 The use of chemotherapeutic drugs that kill cancer cells by damaging genomic DNA is one of the major types of cancer therapy. Unfortunately, tumour cells have developed a variety of repair systems to remove various types of DNA damage.6, 7 Thus, eliminating DNA repair is an alternative strategy to enhance the sensitivities of cancer cells to genotoxic agents in the treatment of cancers. MicroRNAs (miRNAs) refer to a class of short noncoding RNA molecules that range from 19 to 22 nucleotides and regulate the translation of their target gene by their imperfect or perfect pairing with the 3′ untranslated region (UTR) of targeted genes.8, 9, 10 MiR‐138 downregulated histone H2AX expression, inhibited H2AX foci formation, and induced chromosomal instability after DNA damage.11 By targeting the genes NDFIP1, RHEB, and PPP2R5A, miR‐338‐5p sensitized glioblastoma cells to radiation.12 MiR‐890 negatively affected DNA damage repair and sensitized the target tumour cells to ionizing radiation by directly targeting MAD2L2, as well as WEE1 and XPC.13 These articles showed that miRNAs that regulating DNA damage repair should receive more attention in cancer therapies because they might be exploited as tools to sensitize tumours to genotoxic agents.
Both the upregulations of reactive oxygen and nitrogen species producing enzymes and the alterations in the levels of glutathione and damaging components of oxidative metabolism in the mitochondria that lead to excessive reactive oxygen species production were documented to be associated with TNF‐α induced DNA strand breaks.14, 15 The C‐terminal binding protein interacting protein (CTIP) is an endonuclease that specifically recognizes the 5′ flaps of damaged DNA and is known for its involvement in DNA double‐strand break (DBS) repair and genome stability.16, 17 In this study, we found that the increased gene expression of CTIP not only protected cervical cancer cells from TNF‐α‐induced DNA DSBs but also promoted the proliferation of cancer cells, while bioinformatics analysis of the sequences of miR‐130b and CTIP mRNA suggested that CTIP mRNA is a target of miR‐130b. These findings prompted us to test whether miR‐130b inhibited the gene expression of CTIP and whether the expected downregulation of CTIP gene expression resulted in the accumulation of DSBs, which might trigger DNA damage‐induced cell death and counteract the positive role of the CTIP gene in cell proliferation. If so, miR‐130b may be a potential therapeutic agent to treat cervical cancer.
2. MATERIALS AND METHODS
2.1. Cell culture and drug treatment
HeLa and Siha cells were grown in RPMI‐1640 medium supplemented with 10% (vol/vol) foetal bovine serum and 1% penicillin‐streptomycin (vol/vol). A volume of commercial stock solution of TNF‐α (Sigma, St. Louis, USA) was diluted using the medium to a final concentration of 100 ng mL−1 to constitute the TNF‐α solution, and an equal volume of phosphate‐buffered saline (PBS) with bovine serum albumin (BSA) was mixed with medium to form the vehicle control solution. The cells were incubated in medium containing TNF‐α or vehicle control for the desired times in a humidified atmosphere containing 5% CO2 at 37°C. The media containing AZD2461 agents (MedChemExpress, Suite Q, Monmouth Junction, USA) at working concentrations of 5μM were used in poly ADP ribose polymerase (PARP) inhibition assays. Neither TNF‐α nor AZD2461 was supplemented into the media that were used in the assays performed to monitor cell proliferations and to determine the distributions of cell cycles.
2.2. RNA extraction
RNA extraction was achieved using an RNA Isolation kit (Ambion, Inc, Austin, TX. USA). Gel electrophoresis followed by ethidium bromide staining was utilized to assess the RNA integrity, and the ratio between RNA absorbance at 260 nm and its absorbance at 280 nm was calculated to evaluate RNA purity.
2.3. The construction of vectors
The synthesis of DNA complementary to part of the CTIP mRNA was accomplished in a reverse transcription reaction using a specific primer named SCPRT and reverse transcriptase following the manual provided by the manufacturer (TaKaRa, Minato‐ku, Tokyo, Japan). The DNA fragment containing the Kozak sequence and the coding sequence of the CTIP gene was amplified through PCR amplification using two pairs of primers. One pair comprised CPF1 and CPR1, and the other pair included CPF2 and CPR2. After isolation using gel electrophoresis and purification using a gel extraction kit, the desired DNA fragments were digested using restriction enzyme and then ligated into the KpnI‐XhoI cloning sites in the pcDNA3.1 vector to construct the vector overexpressing CTIP protein, pcDNA3.1::CTIP, using T4 DNA ligase. The genomic region encoding the part of the 3′ UTR of CTIP mRNA bearing the predicted miR‐130b targeted site and its mutant encoding the domain lacking the target sites were imitated by a pair of synthesized complementary DNA strands, cptrU and cptrD, and another pair of complementary strands, cpmutU and cpmutD, respectively. Both pairs of complementary stands were denatured at 100°C and then incubated at 37°C for 30 minutes to be annealed. The annealed DNA was inserted into the BamHI‐XhoI cloning sites downstream of the green fluorescent protein (GFP) coding domain in the pEGFP vector to yield pEGFP::wt‐utr or pEGFP::mut‐utr. The DNA sequences of all the available oligonucleotides were listed as follows: ScpRT, 5′‐TGTTTCTGTTTCAACGTCT‐3′; cpF1, 5′‐CCGCCACCATGGACATCTCGGGAAG‐3′; cpR1, 5′‐TCCTGGCTCGTCACTATGTCTTCTGCTCCTTG‐3′; cpF2, 5′‐TGGGGTACCGCCG‐CCACCATGG‐3′; cpR2, 5′‐CGGGATCCCGCCTGGCTCGTCACTAT‐3′; cptrU, 5′‐GATCCCG‐CTTTCATTTTGCACTCTAACTTAAGC‐3′; cptrD, 5′‐TCGAGCTTAAGTTAGAGTGCAAAA‐TGAAAGCGG‐3′; cpmutU, 5′‐GATCCCGCTTTCATTTAGGAGTCTAACTTAAGC‐3′; cpmutD, 5′‐TCGAGCTTAAGTTAGACTCCTAAATGAAAGCGG‐3′.
2.4. Semiquantitative real‐time PCR assays
Real‐time PCR assays were carried out using the synthesized cDNAs, which were initiated by the specific primer SCPRT and Oligod(T)18 in the reverse transcription reactions consisting of 200 ng of total RNA templates to qualify the relative contents of CTIP mRNAs using the protocol from a qRT‐PCR mRNA detection kit (Roche, Indianapolis, IN., USA). A Roche Lightcycler 480 Detection System was used to amplify cDNAs and measure the CTIP and β‐ACTIN mRNA levels using two pairs of primers, cpretF/cpretR and bacRetF/bacRetR, respectively. β‐Actin mRNAs were utilized as internal controls for CTIP template normalization. The relative levels of CTIP mRNAs in the cells were determined using 2−ΔΔCT method.18 The DNA sequences of the primers utilized in the real‐time PCR assays were listed as follows: cpRetF, 5′‐ CGATTCCGCTACATTCCACC‐3′; pRetR, 5′‐CTTTTTGGACGAGGACAAGGAT‐3′; bacRetF, 5′‐AGTTGCGTTACACCCTTTCTTG‐3′; bacRetR, 5′‐TGTCACCTTCACCGTTCCAGT‐3′.
2.5. Transfection of cervical cancer cells
The transfection of tumour cells with exogenous nucleotides was achieved using RNA and DNA X‐fect transfection reagents according to the protocols provided by the producer (TaKaRa, Minato‐ku, Tokyo, Japan). Briefly, miR‐130b mimics, miR‐130b inhibitors, and their respective controls were used at final concentrations of 50 pmol mL−1, and pcDNA3.1, pEGFP, rTagRFP, and their derived plasmids were employed at final concentrations of 3 μg mL−1 in the transfection trials. The RNA sequences of miR‐130b mimics, miR‐130b inhibitors, and their respective negative controls are provided as follows: miR‐130b mimics, Sense: 5′‐CAGUGCAAUGAUGAAAGGG‐CAU‐3′/Anti‐Sense: 5′‐GCCCUUUCAUCAUUGCACUGUU‐3′; N.C., Sense: 5′‐UUCUCCGA‐ACGUGUGUCACGUUU‐3′/Anti‐Sense: 5′‐ACGUGACACGUUCGGAGAAUU‐3′; miR‐130b inhibitors, 5′‐AUGCCCUUUCAUCAUUGCACUG‐3′; inhibitor N.C., 5′‐CAGUACUUUUGU‐GUAGUACAA‐3′.
2.6. Comet assays
The comet assays were performed as documented previously.19 In brief, PBS containing approximately 8000 cells was blended with low‐gelling‐temperature agarose, and the mixture was added to the surface of a slide precoated with agarose. Then, the slide was submerged into neutral lysis buffer after the agarose gelled and incubated at 37°C overnight. After rinsing at room temperature, the slide was immersed in rinse buffer to conduct electrophoresis. In the next step, the slide was stained in solution containing propidium iodide (PI) and then rinsed with distilled water. Finally, 50 comet images from each slide were captured to determine the DNA Oliver tail moments, which were measured using Comet Assay Software Project (CASP) imaging software following the steps described in a previous publication.20
2.7. The measurements of γ‐H2AX levels
The levels of phosphorylated H2AX were detected following a protocol described in a previous report.21 The steps of experiment were described as follows: approximately 2 × 10⁵ of cells were seeded in each well of six‐well plates. After transfection followed by TNF‐α incubations over desired time courses, the cells were trypsinized, collected by centrifugation, and then washed with cold PBS buffer. The cells were incubated in 1% formaldehyde solution on ice for 15 minutes and then collected by centrifugation. The cell pellets were resuspended and incubated in 70% ethanol for another 4 hours at 4°C. After washed with PBS buffer and 1% BSA solution in turn, the cells were resuspended in 1% BSA reagent to obtain a 100 μL of cell suspension containing about 105 of cells. The γ‐H2AX proteins of cells in suspensions were labelled using the primary antibodies (1:100 dilution, Cambridge, MA, USA) against γ‐H2AX (phosphor S139) proteins and the secondary antibodies (1:100 dilution, Cambridge, MA, USA) against primary antibodies in turn. The mean levels of γ‐H2AX proteins expressed in cells were measured on a BD Accuri C6 Plus System (BD BioSciences, San Jose, CA, USA) and presented as the mean values of the intensities of fluorescence emitted by the excited Alexa Fluor 488 dye that were conjugated with the secondary antibodies. The relative levels of phosphor‐H2AX proteins in the cells of various test groups were determined based on the comparisons between the mean values of fluorescence intensities of cells in the test groups and the values of intensities of cells in the corresponding control groups. The mean values of fluorescence intensities acquired in the control groups were defined as 1 or 100% to normalize the levels of phosphor‐H2AX proteins in the distinct test groups.
2.8. CCK‐8 assays
Cancer cells were seeded on a 96‐well plate at a density of 5000 cells per well and cultured overnight. The transfections were performed on the next day. The original medium was replaced by fresh medium containing TNF‐α agents or both TNF‐α agents and AZD2461 after the transfections. The CCK‐8 commercial stock solution (Bosterbio, Pleasanton, CA, USA) was added to the culture at the desired time point after the drug treatment, and the cells were incubated at 37°C for an additional hour. The optical density was measured at 450 nm using an EnSpire Multilabel Reader (PerkinElmer, Wallac Oy, Mustionkatu 6, Turku, Finland). Each group was composed of three independent assays.
2.9. Determination of the cell cycle distribution
The assays were performed following the procedures described previously.22 Briefly, approximately 106 cells were incubated in 70% ethanol at 4°C for 4 hours. The fixed cells were centrifuged and collected and then washed using PBS buffer before a second centrifugation. The cell pellet was resuspended in PI staining buffer and was incubated in the dark at room temperature for 30 minutes. Finally, the samples were loaded on the FACSCalibur system, and the distributions of cell cycle phases were presented and calculated using ModFit LT 4.0 software (Verity Software House Inc., Topsham, ME, USA).
2.10. Measurement of cell apoptosis
Cervical cancer cells were labelled using an Annexin‐V apoptosis kit (BD BioSciences, San Jose, CA, USA). The apoptotic cells were separated from the normal cells, and their percentages were displayed on a BD Accuri C6 Plus System (BD BioSciences, San Jose, CA, USA).
2.11. Western blot assays
The western blot assays were performed following previously recorded procedures.23 In short, cancer cells were lysed using RIPA buffer. The extracted proteins whose concentrations were measured using a BCA Protein Assay Kit were blended with loading buffer and then subjected to SDS/PAGE. After electroblotting to PVDF membranes, the membrane was blocked in Tris‐buffered saline with Tween‐20 (TBST) buffer containing nonfat milk. The detection of the target proteins in the membranes was carried out using rabbit anti‐CTIP (1:500 dilution, Proteintech, IL, USA) or anti‐GADPH antibody (1:200 dilution, Saierbio, Tianjin, China), and nonspecific antibodies attached to the membrane were removed after the membrane was washed with TBST buffer. Then, the membrane was incubated with horseradish peroxidase‐conjugated goat anti‐rabbit IgG (H + L) (1:2000 dilution, Proteintech, IL, USA) and washed with TBST buffer. The protein levels were determined using an enhanced chemiluminescence detection kit (Bosterbio, Pleasanton, CA, USA) and analysed using AlphaView SA software (Proteinsimple, San Jose, California, USA).
2.12. Statistical analysis
All the experimental data were analysed using GraphPad Prism 5.0 software (GraphPad Software, La Jolla, CA, USA). The numerical data are presented as the mean ± SEM. The mean value of the data acquired in the control group was defined as 1 or 100% to normalize the level of the expressed target gene in the distinct test group. The confirmations of the normal distributions of experimental data were achieved using SPSS 16.0 software. Student's two‐tailed unpaired t‐tests were performed to statistically evaluate the data. The P values less than .05 were considered to be significant.
3. RESULTS
3.1. CTIP protein was involved in repairing TNF‐α‐induced DSBs
CTIP was documented as a factor playing a critical role in homologous recombination‐directed DNA repair.24 The CTIP mRNA levels increased by 1.19‐fold in HeLa cells and by 1.34‐fold in Siha cells 3 hours after the addition of TNF‐α to the cell cultures. There was a 1.71‐fold increase in the protein levels of CTIP in HeLa and a 1.78‐fold increment in Siha cells when the target cells were incubated with TNF‐α over 3‐hour time periods (Figure 1A,B). To determine the impact of TNF‐α on the chromosomes, the cultured HeLa and Siha cells were incubated with TNF‐α or its vehicle control for 3 hours. The produced DSBs were shown as elevations in DNA tail moments in the comet assays performed under neutral conditions and were further confirmed by the upregulated levels of γ‐H2AX proteins. As shown in Figure 1C, the mean levels of the tail moments increased by 1.84‐fold in TNF‐α‐treated HeLa cells and by 2.24‐fold in treated Siha cells containing pcDNA3.1 vectors compared with the mean levels in the corresponding vehicle‐treated cells, while no significant difference was observed in the mean levels between TNF‐α‐ and vehicle‐treated cancer cells bearing pcDNA3.1::CTIP prior to TNF‐α administrations. Consistent with the aforementioned results, the mean levels of γ‐H2AX proteins were elevated by 1.28‐fold and by 1.40‐fold in TNF‐α‐treated target cells compared with the mean levels in vehicle‐treated cells, while there were no obvious changes between the mean levels of phosphorylated H2AX proteins in the TNF‐α‐stimulated cells and their counterparts in the vehicle‐treated cells when the target cells were transfected with pcDNA3.1::CTIP before TNF‐α stimulations (Figure 1D).
Figure 1.
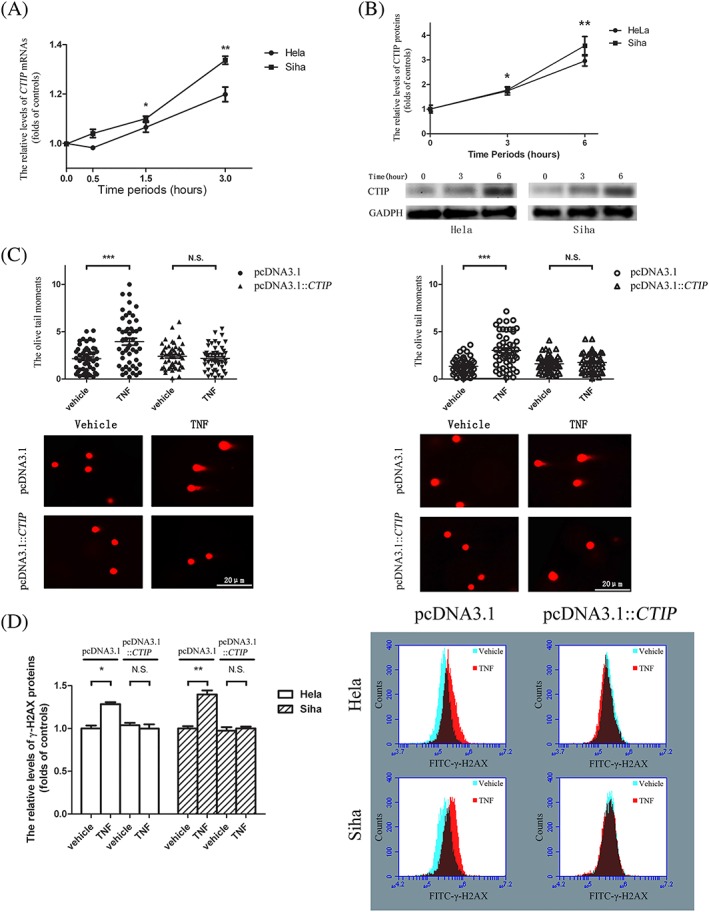
TNF‐α‐stimulated expressions of CTIP gene prevented cancer cells from TNF‐α‐induced DNA double‐strand breaks. A, There were significant augments in the levels of CTIP mRNAs transcribed in both HeLa and Siha cells. B, The expression levels of CTIP proteins increased obviously in both of HeLa and Siha cells. The graphic data obtained in Western blot assays were provided below the statistical analyses of the graphic data. Circles indicated the relative levels of CTIP mRNAs and CTIP proteins in HeLa cells and squares represented the levels in Siha cells at various time points when compared with the corresponding levels in target cells ahead of TNF‐α stimulations. C, The means of DNA Oliver tail moments in target cells treated with TNF‐α were apparently higher than the means in the cells with vehicle control. Circles represented the DNA Oliver tail moments in target cells transfected with pcDNA3.1 vectors, and triangles indicated the tail moments in the cells with pcDNA3.1::CTIP vectors. The solid signs and the hollow ones were respectively utilized to present the Oliver tail moments in HeLa and those in Siha cells. The representative graphic data were offered at the bottom of the statistical analyses of the graphic data. D, The mean levels of phosphorylated H2AX proteins in target cells that were exposed to TNF‐α increased when compared with the mean levels in the cells to vehicle control. The blank columns represented the relative levels of γ‐H2AX proteins in HeLa, and the shadow ones indicated the levels in Siha cells. The cells transfected with pcDNA3.1::CTIP and their control vectors were cultured in fresh media over 24‐hour time periods prior to TNF‐α stimulations. The representative graphic data were put on the right of the statistical analyses of the graphic data. Data were described as means ± SE (n = 3). The bars indicated the deviations from means. * P < .05. ** P < .005. *** P < .001. N.S., non‐significant. CTIP, C‐terminal binding protein interacting protein
3.2. The inhibitory roles of miR‐130bs in the repair of TNF‐α‐triggered DSBs were rescued by overexpression of CTIP
Analysis using four different bioinformatics algorithms including TargetScan, miRBD, Pictar, and DIANA tools showed that the sequence located at positions 3208‐3214 of CTIP mRNA was complementary to the seed region of miR‐130b (Figure 2A). After pEGFP::wt‐utr transfection into target cells accompanied with either miR‐130b mimics or their negative controls, cells with miR‐130b mimics had a decrease in the fluorescence intensity emitted from HeLa cells by 19.52%, and the intensities from Siha cells decreased by 20.98% compared with their negative controls. Following the transfection of miR‐130b mimics coupled with either pEGFP::wt‐utr or pEGFP::mut‐utr, the fluorescence intensities abated by 17.12% in HeLa cells and by 21.18% in Siha cells transfected with pEGFP::wt‐utr compared with pEGFP::mut‐utr (Figure 2B). MiR‐130b mimics caused 0.53‐fold reductions in CTIP mRNAs in both HeLa and Siha cells compared with cells with the negative controls of miR‐130b, while miR‐130b inhibitors resulted in a 1.16‐fold increase in CTIP mRNA in HeLa cells and a 1.11‐fold increase in Siha cells compared with inhibitor controls (Figure 2C). The protein levels of CTIP decreased by 30.52% in HeLa and by 50.91% in Siha cells transfected with miR‐130b mimics compared with the negative controls (Figure 2D). To determine the influence of miR‐130b mimics on DNA repair, we transfected miR‐130b mimics and their controls into cells prior to their 24‐hour incubation with TNF‐α. MiR‐130b mimics increased the mean tail moments by 1.42‐fold in HeLa and by 2.34‐fold in Siha cells compared with their controls (Figure 2E,F). Meanwhile, the mean phosphorylation levels of H2AX proteins were elevated by 1.64‐fold in HeLa cells and by 1.78‐fold in Siha cells transfected with miR‐130b mimics compared with the controls of miR‐130b mimics. However, pcDNA3.1::CTIP decreased the mean tail moments from 6.27 to 4.27 in miR‐130b transfected HeLa cells and from 4.57 to 2.98 in transfected Siha cells compared with pcDNA3.1 controls. At the same time, the mean levels of phosphorylated H2AX proteins decreased by 1.39‐fold in HeLa cells and by 1.44‐fold in Siha cells transfected with pcDNA3.1::CTIP compared with the levels of phosphorylated proteins in target cells with pcDNA3.1 following the transfections of pcDNA3.1::CTIP and their control vectors along with miR‐130b mimics.
Figure 2.
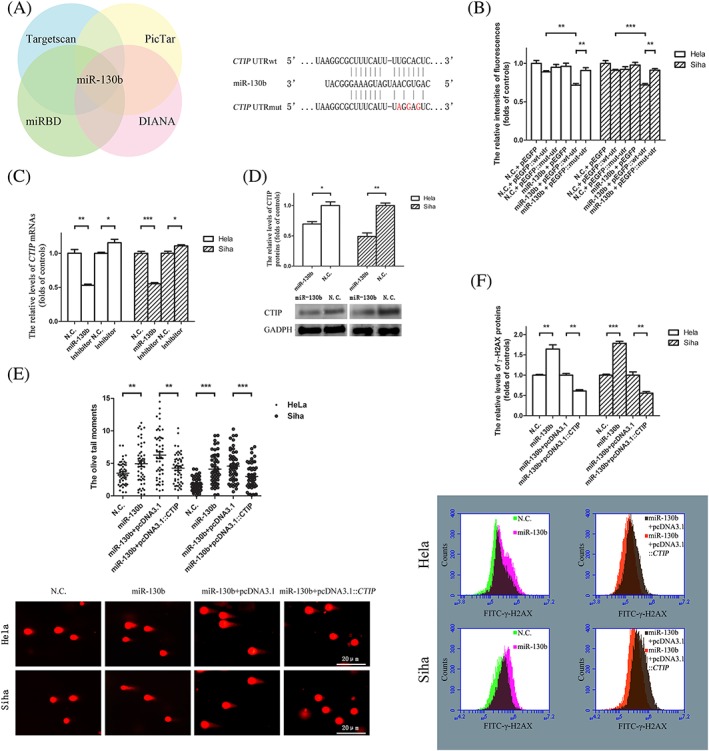
The inhibitor roles of miR‐130bs on the repairs of TNF‐α double‐strand breaks were rescued by the overexpressed genes of CTIP. A, A putative miR‐130b targeted site exists in the 3′ UTR of CTIP mRNA. The DNA sequences of wild type or mutated 3′ UTRs that were not shown in the figure were presented as the dotted lines. The base pairs between the sequences of miR‐130b and those of the wild type or the mutated 3′ UTR of CTIP mRNA were showed as vertical lines. The mutated points in the wild type of 3′ UTR of CTIP mRNA were exhibited as the words in red. B, The expression levels of green fluorescence proteins as reporters were downregulated by miR‐130bs based on the base pairing between the seed sequences of miR‐130bs and the regions complementary to the seed sequences within the wild‐type 3′ UTR of CTIP mRNAs. The relative fluorescence intensities of green fluorescence protein were determined at 24‐hour post‐transfection. The blank columns represented the relative fluorescence intensities of reporter proteins in HeLa, and the shadow ones represented the levels in Siha cells. C, miR‐130bs caused the reductions in the contents of CTIP mRNAs in HeLa and Siha cells. The blank columns represented the relative levels of CTIP mRNAs in HeLa, and the shadow ones indicated the levels in Siha cells. D, miR‐130b decreased the mounts of CTIP proteins in HeLa and Siha cells. The graphic data acquired in Western blot assays located at the bottom of the statistical analyses of the graphic data. The blank columns showed the relative levels of CTIP proteins in HeLa, and the shadow ones exhibited the levels in Siha cells. E, The increments in Oliver tail moments caused by miR‐130bs were restored by the enhanced gene expression of CTIP in HeLa and Siha cells. The solid and the hollow circles were individually exploited to indicate the DNA Oliver tail moments in HeLa and that in Siha cells. F, The elevations in the mean levels of γ‐H2AX proteins induced by miR‐130b transfections were reversed by the overexpression of CTIP gene in HeLa and Siha cells. All the transfected target cells were cultured in fresh medium over 24‐hour time periods prior to TNF‐α stimulations. The blank columns represented the relative levels of γ‐H2AX proteins in HeLa, and the shadow ones represented the levels in Siha cells. The representative graphic data were provided below the statistical analyses of the graphic data. Data were described as means ± SE (n = 3). The bars indicated the deviations from means. * P < .05. ** P < .005. *** P < .001. N.S., non‐significant. CTIP, C‐terminal binding protein interacting protein; UTR, untranslated region
3.3. MiR‐130b mimics sensitized cervical cancer cells to the toxic activity of PARP inhibitors
It has recorded in previous literature that the accumulation of DSBs as a result of the failure of SSB repair which was caused by PARP inhibition needs HR‐mediated repair.25 Thus, we assumed that the inhibition of miR‐130b mimics on the expression of CTIP gene might contribute to the death of cervical cancer cell induced by PARP inhibitor. As expected, miR‐130b mimics decreased the viabilities of HeLa cells by 15.08% and that of Siha cells by 30.32% compared with the negative controls, while pcDNA3.1::CTIP augmented the cell viabilities of HeLa and Siha cells transfected with miR‐130 mimics by 1.14‐fold and by 1.22‐fold, respectively, compared with pcDNA3.1 after the transfected target cells were treated with both TNF‐α and AZD2461 agents (Figure 3A). The apoptosis rates were increased by 1.28‐fold and 1.32‐fold in the HeLa and Siha cells bearing miR‐130b mimics, respectively, compared with the negative controls of miR‐130b mimics. Following the transfections of miR‐130b mimics in combination with pcDNA3.1::CTIP or their control vectors, the apoptosis rates of HeLa and Siha cells containing pcDNA3.1::CTIP were 38.96% and 40.38%, respectively, lower than the rates in the corresponding cells, including the control vectors, after the target cells were treated with both TNF‐α and AZD2461 (Figure 3B).
Figure 3.
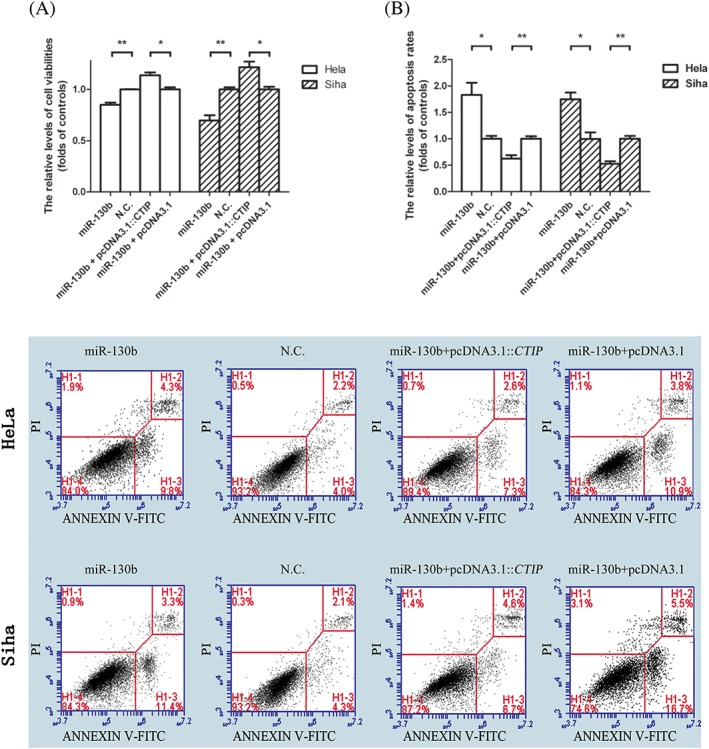
The miR‐130b‐induced cell apoptosis was relieved by the increased expression of CTIP gene in the presence of TNF‐α and PARP inhibitor. A, miR‐130b mimics decreased viabilities of HeLa and Siha cells incubated with TNF‐α agents along with PARP inhibitors, while pcDNA3.1::CTIP vectors elevated the viabilities of miR‐130b transfected target cells. The blank columns represented the relative levels of cell viabilities in HeLa, and the shadow ones indicated the levels in Siha cells. All the transfected cells were cultured in the fresh media over 24‐hour time periods and then incubated in the media containing TNF‐α and AZD2461 for another 24 hours ahead of CCK‐8 assays performed. B, miR‐130b mimics increased apoptosis rates of HeLa and Siha cells stimulated with TNF‐α agents coupled with PARP inhibitors while the enhanced expression of CTIP gene lowed the rates of target cells transfected with miR‐130b mimics. All the transfected cells were cultured in the fresh media over 48‐hour time periods and then incubated in the media containing TNF‐α and AZD2461 for another 24 hours prior to apoptosis assays performed. The graphic data presenting the apoptosis rates of tumour cells were provided below the statistical analyses of the graphic data, and the oligonucleotides used in the transfection assays were showed above the graphic data. The blank columns represented the relative levels of viabilities or apoptosis rates of HeLa cells, and the shadow ones represented the levels or rates of Siha cells. Data were described as means ± SE (n = 3). The bars indicated the deviations from means. * P < .05. ** P < .005. *** P < 0.001. N.S., non‐significant. CTIP, C‐terminal binding protein interacting protein; PARP, poly ADP ribose polymerase
3.4. The acceleration of cell proliferation caused by the increased gene expression of CTIP was relieved by miR‐130b mimics
Besides its critical function in HR, CTIP protein has been documented to participate in a variety of cellular processes including cell cycle regulation.26, 27 In this study, we have seen that pcDNA3.1::CTIP increased the viability of HeLa cell by 1.26‐fold and that of Siha cell by 1.23‐fold compared with its control vector. After the miR‐130b mimics and their negative controls were separately transfected into target cells along with pcDNA3.1::CTIP vectors, miR‐130b mimics led to a 14.14% decrease in the viability of HeLa cell and a 15.86% reduction in that of Siha cell compared with their controls (Figure 4A). pcDNA3.1::CTIP increased the percentages of cells in the S phase of the cell cycle from 28.29% to 32.30% in HeLa cells and from 27.02% to 33.34% in Siha cells compared with pcDNA3.1. Simultaneously, the ratios between the percentages of S and those of G1 phases in HeLa and Siha cells transfected with pcDNA3.1::CTIP vectors were 1.28‐ and 1.50‐fold higher than the ratios in their respective counterparts with controls. After transfection along with pcDNA3.1::CTIP, miR‐130b mimics decreased the proportions of cells in the S phases from 32.21% to 27.90% and the ratios between the percentages of S and those of G1 cell cycle phases from 0.60 to 0.50 in HeLa cells compared with their controls. In Siha cells subjected to the same transfections, the percentages of cells in S phases and the ratios between the percentages of S and those of G1 phases in cell cycles were 26.31% and 0.49, respectively, in the cells containing miR‐130b mimics and 32.13% and 0.64, respectively, in the cells carrying the negative controls of the miR‐130b mimics (Figure 4B).
Figure 4.
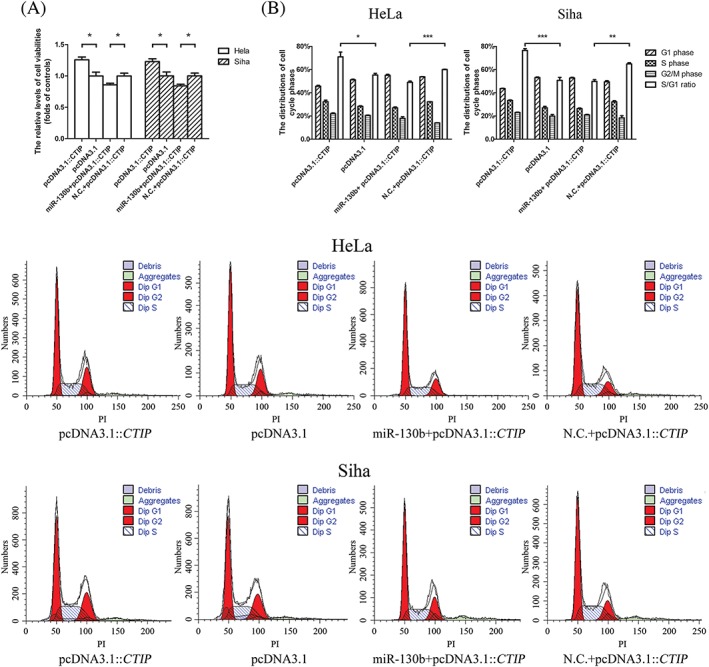
The positive roles of expressed CTIP genes in the cell proliferations were antagonized by miR‐130bs. A, The overexpressions of CTIP genes augmented viabilities of HeLa and Siha cells, while the transfections of miR‐130b mimics downregulated the viabilities of target cells bearing the pcDNA3.1::CTIP vectors. The blank columns represented the relative levels of cell viabilities in HeLa, and the shadow ones indicated the levels in Siha cells. B, The elevations in the gene expression of CTIP promoted cancer cells to enter S phases from G1 phases, while miR‐130b mimics decreased the ratios between the percentages of S and G1 phases in cell cycles. The blank columns indicated the ratios between the percentages of S and G1 phases in cell cycles of HeLa and Siha cells. The representative figures indicating the distributions of cell cycle phases in target cells located under the statistical analyses of the graphic data. Data were described as means ± SE (n = 3). The bars indicated the deviations from means. * P < .05. ** P < .005. *** P < .001. N.S., non‐significant; CTIP, C‐terminal binding protein interacting protein
4. DISCUSSION
TNF‐α is a pleiotropic proinflammatory cytokine that participates in the pathophysiology of different inflammatory disorders. TNF‐α causes oxidative DNA damage in murine hepatocytes and DNA strand breaks in L929 cells and shows inflammation‐associated genotoxicity in multiple types of cells within the peripheral blood stream.28, 29, 30 To test if TNF‐α could induce DNA damages and repairs in the genomes of cervical cancer cells, the mean levels of γ‐H2AX protein levels in Siha cells that were incubated with 100 ng mL−1 TNF‐α over different time periods were measured. The significant increases in the mean levels of γ‐H2X proteins in TNF‐α‐treated target cells were observed at 1.5‐ and 3‐hour post‐TNF‐α treatments, but no significant changes in the corresponding mean levels was seen at 24‐hour post‐drug treatment when compared with the mean levels of γ‐H2X proteins in vehicle treated cells (Figure S1). These experimental data indicated that the DNA breaks could be induced by TNF‐α treatments and detected at 1.5‐ and 3‐hour post‐TNF‐α administration but completely repaired and undetected at 24‐hour post‐drug administrations. Homologous recombination‐directed repair (HR), which utilizes the genetic information contained in the unimpaired sister chromatid as a template, is a well‐known major error‐free mechanism underlying DNA integrity, and it begins with DNA resection, which is initiated by the binding of the CTIP protein to the heterotrimeric MRN complex comprising MRE11, RAD50, and NBS11.24 The increases in the levels of CTIP mRNAs and proteins following TNF‐α treatment suggested that CTIP might be involved in the repair of induced DSBs (Figure 1A,B). This assumption was supported by the fact that transfection of vectors overexpressing CTIP proteins before TNF‐α stimulation could prevent DSBs in the genomes of TNF‐α‐treated cells (Figure 1C,D).
MiRNAs regulate the expression of their target genes by complementary binding to their 3′ UTR regions.31, 32 The putative target sites of miR‐130b in the 3′ UTR of CTIP mRNA were identified by in silico analysis (Figure 2A). The decreased CTIP mRNA levels caused by miR‐130b mimics and the elevated mRNA levels induced by miR‐130b inhibitors showed that miR‐130b inhibits CTIP gene expression by directly binding to the speculated target sites to promote degradation of CTIP mRNAs (Figure 2C). This hypothesis was confirmed based on the experimental findings that miR‐130b mimics led to a decline in the expression levels of reporter genes with the DNA sequences encoding wild‐type 3′ UTRs, but there was no apparent decrease in the levels of the reporter genes without 3′ UTR sequences or with the sequences encoding mutant 3′ UTRs (Figure 2B). Considering the greater changes observed in the levels of mRNAs after the transfection of miR‐130b mimics compared with miR‐130b inhibitors, we investigated the impacts of miR‐130bs on the protein expression and function of CTIP genes using miR‐130b mimics in subsequent assays (Figure 2C). Consistent with the influences of miR‐130bs on the mRNA levels, the protein levels of CTIP were decreased after the transfections of miR‐130b mimics as well (Figure 2D). The increase in the number of DSBs in cancer cells containing miR‐130b mimics compared with cells carrying miR‐130b negative controls demonstrated that miR‐130b impaired the repair of DSBs. Meanwhile, the attenuated counts of DSBs triggered by the overexpressed CTIP gene in miR‐130b‐transfected cells showed that CTIP proteins had the capacity to restore miR‐130b‐mediated inhibition of DSB repair (Figure 2E,F). In light of these results, we concluded that CTIP‐mediated repair of DSBs could be impaired by miR‐130b due to its negative regulation of CTIP gene expression.
DSBs are considered to be the most biologically hazardous types of DNA damage. A single unpaired DSB is sufficient to lead to cell death; thus, the repair of DSBs to maintain genome integrity is critical for cell survival.33, 34 Since accumulated DNA single‐strand breaks (SSBs) caused by the loss of PARP activity can be converted to DSBs by the cellular replication and transcription machinery, PARP inhibition can result in the death of cells with defects in proteins involved in HR.35, 36 As mentioned above, the gene expression of CTIP, which plays a critical role in HR, was shown to be downregulated by miR‐130b mimics, and the miR‐130b‐produced reduction in CTIP gene expression inhibited the repair of TNF‐α‐induced DSBs. Thus, miR‐130b might sensitize cells to TNF‐α killing in the presence of PARP inhibitors due to its inhibition of the CTIP‐mediated repairs of DSBs. Similar to our hypothesis, miR‐130b mimics decreased the viabilities but enhanced the apoptosis rates of cancer cells in the presence of PARP inhibitors, while CTIP gene overexpression enhanced cell viabilities and reduced apoptosis rates in target cells transfected with miR‐130b mimics (Figure 3A,B).
Based on deletion experiments in the mouse, CTIP was initially described as a tumour suppressor because it promoted oncogenesis upon haploid insufficiency.37 However, it was recently reported that CTIP was not a tumour suppressor but promoted tumourigenesis in the mouse, relying on its ability to facilitate microhomology‐mediated end joining (MMEJ)‐dependent genomic instability.38 The inconsistency between the conclusions obtained from two different studies indicated that more research is necessary to ascertain the function of the CTIP gene in tumour formation. Herein, we found that CTIP gene expression augmented the viabilities of cancer cells (Figure 4A). This experimental result indicated that the CTIP gene might promote tumour cell proliferation. It was reported that the binding of CTIP to the promoter of the Rb‐E2F downstream target genes resulted in the dissociation of Rb, which resulted in the expression of genes required for the G1/S transition and overcome RB‐mediated cell cycle arrest.39 In agreement with these results, we found that the ratios between the percentages of S and G1 cell cycle phases in target cells were elevated after the transfection of pcDNA3.1::CTIP compared with its control vector (Figure 4B). Meanwhile, when miR‐130b mimics or their negative controls together with pcDNA3.1::CTIP vectors were transferred into target cells, reductions in the viabilities and the ratios between the percentage of S and that of G1 phases were observed in the cells containing miR‐130b mimics (Figure 4A,B). Furthermore, the transfected cancer cells in S cell cycle phases were also labelled using Edu Apollo488 in vitro flow cytometry kit (RIBOBIO, Guangzhou, China) following the guideline provided by the manufacturer. And the percentages of target cells in S phases were determined and displayed on a BD Accuri C6 Plus System. As Figure S2 showed, the transfection of pcDNA3.1::CTIP increased the percentages of S cell cycle phases in both HeLa and Siha cells when compared with pcDNA3.1, while the transfected miR‐130b mimics reduced the percentages of S phases in target cells containing pcDNA3.1::CTIP vectors when compared with the negative controls of miR‐130b. Taken together, we concluded that CTIP enhanced the proliferation of cells by promoting cell cycle progression from the G1 to S phases and miR‐130b should offset the positive roles of CTIP in cell proliferation by targeting the CTIP gene. Moreover, we transfected miR‐130b mimics into target cells to test whether miR‐130b delayed cell reproduction. Contrary to our expectations, miR‐130b mimics enhanced the viabilities of target cells and the ratios between the percentages of S and that of G1 phases (Figure S3). As reported previously, miR‐130b acted as a tumour promoter in diverse cancer cell lines by suppressing the expression of antioncogenes.40, 41, 42 Consequently, miR‐130b may have weakened the positive effects of CTIP on cell proliferation but promoted cell proliferation by inhibiting the expression of other genes that functioned as tumour suppressors.
Supporting information
Table S1. The primary data obtained in the semi‐quantitative real‐time PCR assays of three biological replicates which were performed to determine the impacts of TNF‐α on the expression levels of CTIP mRNA in HeLa and Siha cells incubated in the mediums containing TNF‐α agents over different time courses.
Table S2. The primary data obtained in CCK‐8 assays which were performed to determine the impacts of miR‐130bs and CTIP proteins on the viabilities of HeLa and Siha cells incubated in the mediums containing TNF‐α agents and poly ADP ribose polymerase inhibitors.
Table S3. The primary data obtained in the assays performed to explore the effects of miR‐130bs and CTIP proteins on the apoptosis rates of HeLa and Siha cells incubated in the mediums containing TNF‐α agents and poly ADP ribose polymerase inhibitors.
Table S4. The primary data obtained in CCK‐8 assays carried out to see the impacts of CTIP proteins and miR‐130bs on the viabilities of HeLa and Siha cells.
Table S5. The primary data obtained in the assays performed to investigate the influences of CTIP proteins and miR‐130bs on the distributions of cell cycle phases of HeLa and Siha cells.
Figure S1. TNF‐α induced DNA double strand breaks and their repairs in the Siha cells. When compared with the vehicle‐treated controls, the increases in the mean levels of γ‐H2AX proteins in the TNF‐α treated target cells were displayed at 1.5 and 3 hour post‐drug administrations but not shown at 24 hour post‐drug treatments. The blank and shadow columns represented the relative levels of γ‐H2AX proteins in the target cells incubated in the mediums with TNF‐α or vehicle over 1.5 and 3 hour time periods respectively while the ones in grey indicated the relative levels of phosphorylated H2AX proteins in the cells cultured in the mediums containing TNF‐α or vehicle over 24 hour time periods. The representative graphic data were provided at the bottom of the statistical analyses of the graphic data. Data were described as means±S. E. (n = 3). The bars indicated the deviations from means. “*”, P < 0.05. “***”, P < 0.001. “N.S.”, non‐significant.
Figure S2. The positive roles of overexpressed CTIP genes in the cell proliferations were antagonized by miR‐130bs. The overexpressions of CTIP genes increased percentages of HeLa and Siha cells in S cell cycle phases while the transfections of miR‐130b mimics lessened the percentages of target cells containing the pcDNA3.1::CTIP vectors in S phases in cell cycles. The relative levels of Hela and Siha cells in S cell cycle phases were respectively indicated by the blank and shadow columns. The representative figures displaying the percentages of S phases in cell cycles of target cells located under the statistical analyses of the graphic data. Data were described as means±S. E. (n = 3). The bars indicated the deviations from means. “*”, P < 0.05. “**”, P < 0.005. “***”, P < 0.001. “N.S.”, non‐significant.
Figure S3. The miR‐130b promoted the proliferations of cervical cancer cells. A. The transfections of miR‐130b mimics into Hela and Siha cells augmented viabilities of target cells. The blank columns represented the relative levels of cell viabilities in HeLa and the shadow ones indicated the levels in Siha cells. B. The transfections of miR‐130b mimics drove HeLa and Siha cells to enter S phases from G1 phases and increased the ratios between the percentages of S and G1 phases in cell cycles of target cells. The blank columns indicated the ratios between the percentages of S and G1 phases in cell cycles of HeLa and Siha cells. The representative figures indicating the distributions of cell cycle phases in target cells located under the statistical analyses of the graphic data. Data were described as means±S. E. (n = 3). The bars indicated the deviations from means. “*”, P < 0.05. “**”, P < 0.005. “N.S.”, non‐significant.
ACKNOWLEDGEMENTS
This work was supported by the National Natural Science Foundation of China (Nos.81602403, 81470982, and 81602139) and the Natural Science Foundation of Tianjin City (16JCQNJC10100).
Yang L, Yang B, Wang Y, et al. The CTIP‐mediated repair of TNF‐α‐induced DNA double‐strand break was impaired by miR‐130b in cervical cancer cell. Cell Biochem Funct. 2019;37:534–544. 10.1002/cbf.3430
REFERENCES
- 1. Thapa N, Maharjan M, Xiong Y, et al. Impact of cervical cancer on quality of life of women in Hubei, China. Sci Rep. 2018;8(1):11993. [DOI] [PMC free article] [PubMed] [Google Scholar]
- 2. Benard VB, Thomas CC, King J, Massetti GM, Doria‐Rose VP, Saraiya M. Vital signs: cervical cancer incidence, mortality, and screening—United States, 2007‐2012. MMWR. 2014;63:1004‐1009. [PMC free article] [PubMed] [Google Scholar]
- 3. Aimagambetova G, Azizan A. Epidemiology of HPV infection and HPV‐related cancers in Kazakhstan: a review. Asian Pac J Cancer Prev. 2018;19(5):1175‐1180. [DOI] [PMC free article] [PubMed] [Google Scholar]
- 4. Hoeijmakers JH. DNA damage, aging and cancer. N Engl J Med. 2009;361(15):1475‐1485. [DOI] [PubMed] [Google Scholar]
- 5. De Bont R, van Larebeke N. Endogenous DNA damage in humans: a review of quantitative data. Mutagenesis. 2004;19(3):169‐185. [DOI] [PubMed] [Google Scholar]
- 6. Lord CJ, Ashworth A. The DNA damage response and cancer therapy. Nature. 2012;481(7381):287‐294. [DOI] [PubMed] [Google Scholar]
- 7. Tian H, Gao Z, Li H, et al. DNA damage response—a double‐edged sword in cancer prevention and cancer therapy. Cancer Lett. 2015;358(1):8‐16. [DOI] [PubMed] [Google Scholar]
- 8. Carthew RW, Sontheimer EJ. Origins and mechanisms of miRNAs and siRNAs. Cell. 2009;136(4):642‐655. [DOI] [PMC free article] [PubMed] [Google Scholar]
- 9. Bushati N, Cohen SM. MicroRNA functions. Annu Rev Cell Dev Biol. 2007;23(1):175‐205. [DOI] [PubMed] [Google Scholar]
- 10. Macfarlane LA, Murphy PR. MicroRNA: biogenesis, function and role in cancer. Curr Genomics. 2010;11(7):537‐561. [DOI] [PMC free article] [PubMed] [Google Scholar]
- 11. Yang H, Luo J, Liu Z, Zhou R, Luo H. MicroRNA‐138 regulates DNA damage response in small cell lung cancer cells by directly targeting H2AX. Cancer Invest. 2015;33(4):126‐136. [DOI] [PubMed] [Google Scholar]
- 12. Besse A, Sana J, Lakomy R, et al. miR‐338–5p sensitizes glioblastoma cells to radiation through regulation of genes involved in DNA damage response. Tumour Biol. 2016;37(6):7719‐7727. [DOI] [PubMed] [Google Scholar]
- 13. Hatano K, Kumar B, Zhang Y, et al. A functional screen identifies miRNAs that inhibit DNA repair and sensitize prostate cancer cells to ionizing radiation. Nucleic Acids Res. 2015;43(8):4075‐4086. [DOI] [PMC free article] [PubMed] [Google Scholar]
- 14. Chen X, Andresen BT, Hill M, Zhang J, Booth F, Zhang C. Role of reactive oxygen species in tumor necrosis factor‐alpha induced endothelial dysfunction. Curr Hypertens Rev. 2008;4(4):245‐255. [DOI] [PMC free article] [PubMed] [Google Scholar]
- 15. Natarajan M, Gibbons CF, Mohan S, Moore S, Kadhim MA. Oxidative stress signalling: a potential mediator of tumour necrosis factor alpha‐induced genomic instability in primary vascular endothelial cells. Br J Radiol. 2007;80(special_issue_1):S13‐S22. [DOI] [PubMed] [Google Scholar]
- 16. Makharashvili N, Tubbs AT, Yang SH, et al. Catalytic and noncatalytic roles of the CtIP endonuclease in double‐strand break end resection. Mol Cell. 2014;54(6):1022‐1033. [DOI] [PMC free article] [PubMed] [Google Scholar]
- 17. Wang H, Li Y, Truong LN, et al. CtIP maintains stability at common fragile sites and inverted repeats by end resection‐independent endonuclease activity. Mol Cell. 2014;54(6):1012‐1021. [DOI] [PMC free article] [PubMed] [Google Scholar]
- 18. L Livak KJ, Schmittgen TD. Analysis of relative gene expression data using real‐time quantitative PCR and the 2−ΔΔCT method. Methods. 2001;25(4):402‐408. [DOI] [PubMed] [Google Scholar]
- 19. Olive PL, Banáth JP. The comet assay: a method to measure DNA damage in individual cells. Nat Protoc. 2006;1(1):23‐29. [DOI] [PubMed] [Google Scholar]
- 20. Końca K, Lankoff A, Banasik A, et al. A cross‐platform public domain PC image‐analysis program for the comet assay. Mutat Res. 2003;534(1‐2):15‐20. [DOI] [PubMed] [Google Scholar]
- 21. Sharma A, Singh K, Almasan A. Histone H2AX phosphorylation: a marker for DNA damage. Methods Mol Biol. 2012;920:613‐626. [DOI] [PubMed] [Google Scholar]
- 22. Pozarowski P, Darzynkiewicz Z. Analysis of cell cycle by flow cytometry. Methods Mol Biol. 2004;281:301‐311. [DOI] [PubMed] [Google Scholar]
- 23. Yang L, Wang Y, Shi S, et al. The TNF‐α‐induced expression of miR‐130b protects cervical cancer cells from the cytotoxicity of TNF‐α. FEBS Open Bio. 2018;8(4):614‐627. [DOI] [PMC free article] [PubMed] [Google Scholar]
- 24. Sartori AA, Lukas C, Coates J, et al. Human CtIP promotes DNA end resection. Nature. 2007;450(7169):509‐514. [DOI] [PMC free article] [PubMed] [Google Scholar]
- 25. Jones P, Wilcoxen K, Rowley M, Toniatti C. Niraparib: a poly(ADP‐ribose) polymerase (PARP) inhibitor for the treatment of tumors with defective homologous recombination. J Med Chem. 2015;58(8):3302‐3314. [DOI] [PubMed] [Google Scholar]
- 26. Chinnadurai G. CtIP, a candidate tumor susceptibility gene is a team player with luminaries. Biochim Biophys Acta. 2006;1765:67‐73. [DOI] [PubMed] [Google Scholar]
- 27. Wu G, Lee WH. CtIP, a multivalent adaptor connecting transcriptional regulation, checkpoint control and tumor suppression. Cell Cycle. 2006;5(15):1592‐1596. [DOI] [PubMed] [Google Scholar]
- 28. Wheelhouse NM, Chan YS, Gillies SE, et al. TNF‐α induced DNA damage in primary murine hepatocytes. Int J Mol Med. 2003;12:889‐894. [PubMed] [Google Scholar]
- 29. Shoji Y, Uedono Y, Ishikura H, Takeyama N, Tanaka T. DNA damage induced by tumour necrosis factor‐alpha in L929 cells is mediated by mitochondrial oxygen radical formation. Immunology. 1995;84:543‐548. [PMC free article] [PubMed] [Google Scholar]
- 30. Westbrook AM, Wei B, Hacke K, Xia M, Braun J, Schiestl RH. The role of tumour necrosis factor‐α and tumour necrosis factor receptor signalling in inflammation‐associated systemic genotoxicity. Mutagenesis. 2012;27(1):77‐86. [DOI] [PMC free article] [PubMed] [Google Scholar]
- 31. Bartel DP. MicroRNAs: target recognition and regulatory functions. Cell. 2009;136(2):215‐233. [DOI] [PMC free article] [PubMed] [Google Scholar]
- 32. Farh KK, Grimson A, Jan C, et al. The widespread impact of mammalian MicroRNAs on mRNA repression and evolution. Science. 2005;310(5755):1817‐1821. [DOI] [PubMed] [Google Scholar]
- 33. van Gent DC, Hoeijmakers JH, Kanaar R. Chromosomal stability and the DNA double‐stranded break connection. Nat Rev Genet. 2001;2(3):196‐206. [DOI] [PubMed] [Google Scholar]
- 34. Khanna KK, Jackson SP. DNA double‐strand breaks: signaling, repair and the cancer connection. Nat Genet. 2001;27(3):247‐254. [DOI] [PubMed] [Google Scholar]
- 35. Patel AG, Sarkaria JN, Kaufmann SH. Nonhomologous end joining drives poly(ADP‐ribose) polymerase (PARP) inhibitor lethality in homologous recombination‐deficient cells. Proc Natl Acad Sci U S A. 2011;108(8):3406‐3411. [DOI] [PMC free article] [PubMed] [Google Scholar]
- 36. Schoonen PM, Talens F, Stok C, et al. Progression through mitosis promotes PARP inhibitor‐induced cytotoxicity in homologous recombination‐deficient cancer cells. Nat Commun. 2017;8(1):15981. [DOI] [PMC free article] [PubMed] [Google Scholar]
- 37. Chen PL, Liu F, Cai S, et al. Inactivation of CtIP leads to early embryonic lethality mediated by G1 restraint and to tumorigenesis by haploid insufficiency. Mol Cell Biol. 2005;25(9):3535‐3542. [DOI] [PMC free article] [PubMed] [Google Scholar]
- 38. Reczek CR, Shakya R, Miteva Y, Szabolcs M, Ludwig T, Baer R. The DNA resection protein CtIP promotes mammary tumorigenesis. Oncotarget. 2016;7:32172‐32183. [DOI] [PMC free article] [PubMed] [Google Scholar]
- 39. Liu F, Lee WH. CtIP activates its own and cyclin D1 promoters via the E2F/RB pathway during G1/S progression. Mol Cell Biol. 2006;26(8):3124‐3134. [DOI] [PMC free article] [PubMed] [Google Scholar]
- 40. Yu T, Cao R, Li S, et al. MiR‐130b plays an oncogenic role by repressing PTEN expression in esophageal squamous cell carcinoma cells. BMC Cancer. 2015;15(1):29. [DOI] [PMC free article] [PubMed] [Google Scholar]
- 41. Leone V, Langella C, Esposito F, et al. miR‐130b‐3p upregulation contributes to the development of thyroid adenomas targeting CCDC6 gene. Eur Thyroid J. 2015;4(4):213‐221. [DOI] [PMC free article] [PubMed] [Google Scholar]
- 42. Li P, Wang X, Shan Q, Wu Y, Wang Z. MicroRNA‐130b promotes cell migration and invasion by inhibiting peroxisome proliferator‐activated receptor‐gamma in human glioma. Oncol Lett. 2017;13(4):2615‐2622. [DOI] [PMC free article] [PubMed] [Google Scholar]
Associated Data
This section collects any data citations, data availability statements, or supplementary materials included in this article.
Supplementary Materials
Table S1. The primary data obtained in the semi‐quantitative real‐time PCR assays of three biological replicates which were performed to determine the impacts of TNF‐α on the expression levels of CTIP mRNA in HeLa and Siha cells incubated in the mediums containing TNF‐α agents over different time courses.
Table S2. The primary data obtained in CCK‐8 assays which were performed to determine the impacts of miR‐130bs and CTIP proteins on the viabilities of HeLa and Siha cells incubated in the mediums containing TNF‐α agents and poly ADP ribose polymerase inhibitors.
Table S3. The primary data obtained in the assays performed to explore the effects of miR‐130bs and CTIP proteins on the apoptosis rates of HeLa and Siha cells incubated in the mediums containing TNF‐α agents and poly ADP ribose polymerase inhibitors.
Table S4. The primary data obtained in CCK‐8 assays carried out to see the impacts of CTIP proteins and miR‐130bs on the viabilities of HeLa and Siha cells.
Table S5. The primary data obtained in the assays performed to investigate the influences of CTIP proteins and miR‐130bs on the distributions of cell cycle phases of HeLa and Siha cells.
Figure S1. TNF‐α induced DNA double strand breaks and their repairs in the Siha cells. When compared with the vehicle‐treated controls, the increases in the mean levels of γ‐H2AX proteins in the TNF‐α treated target cells were displayed at 1.5 and 3 hour post‐drug administrations but not shown at 24 hour post‐drug treatments. The blank and shadow columns represented the relative levels of γ‐H2AX proteins in the target cells incubated in the mediums with TNF‐α or vehicle over 1.5 and 3 hour time periods respectively while the ones in grey indicated the relative levels of phosphorylated H2AX proteins in the cells cultured in the mediums containing TNF‐α or vehicle over 24 hour time periods. The representative graphic data were provided at the bottom of the statistical analyses of the graphic data. Data were described as means±S. E. (n = 3). The bars indicated the deviations from means. “*”, P < 0.05. “***”, P < 0.001. “N.S.”, non‐significant.
Figure S2. The positive roles of overexpressed CTIP genes in the cell proliferations were antagonized by miR‐130bs. The overexpressions of CTIP genes increased percentages of HeLa and Siha cells in S cell cycle phases while the transfections of miR‐130b mimics lessened the percentages of target cells containing the pcDNA3.1::CTIP vectors in S phases in cell cycles. The relative levels of Hela and Siha cells in S cell cycle phases were respectively indicated by the blank and shadow columns. The representative figures displaying the percentages of S phases in cell cycles of target cells located under the statistical analyses of the graphic data. Data were described as means±S. E. (n = 3). The bars indicated the deviations from means. “*”, P < 0.05. “**”, P < 0.005. “***”, P < 0.001. “N.S.”, non‐significant.
Figure S3. The miR‐130b promoted the proliferations of cervical cancer cells. A. The transfections of miR‐130b mimics into Hela and Siha cells augmented viabilities of target cells. The blank columns represented the relative levels of cell viabilities in HeLa and the shadow ones indicated the levels in Siha cells. B. The transfections of miR‐130b mimics drove HeLa and Siha cells to enter S phases from G1 phases and increased the ratios between the percentages of S and G1 phases in cell cycles of target cells. The blank columns indicated the ratios between the percentages of S and G1 phases in cell cycles of HeLa and Siha cells. The representative figures indicating the distributions of cell cycle phases in target cells located under the statistical analyses of the graphic data. Data were described as means±S. E. (n = 3). The bars indicated the deviations from means. “*”, P < 0.05. “**”, P < 0.005. “N.S.”, non‐significant.