Abstract
Purpose
19F‐MRI is gaining widespread interest for cell tracking and quantification of immune and inflammatory cells in vivo. Different fluorinated compounds can be discriminated based on their characteristic MR spectra, allowing in vivo imaging of multiple 19F compounds simultaneously, so‐called multicolor 19F‐MRI. We introduce a method for multicolor 19F‐MRI using an iterative sparse deconvolution method to separate different 19F compounds and remove chemical shift artifacts arising from multiple resonances.
Methods
The method employs cycling of the readout gradient direction to alternate the spatial orientation of the off‐resonance chemical shift artifacts, which are subsequently removed by iterative sparse deconvolution. Noise robustness and separation was investigated by numerical simulations. Mixtures of fluorinated oils (PFCE and PFOB) were measured on a 7T MR scanner to identify the relation between 19F signal intensity and compound concentration. The method was validated in a mouse model after intramuscular injection of fluorine probes, as well as after intravascular injection.
Results
Numerical simulations show efficient separation of 19F compounds, even at low signal‐to‐noise ratio. Reliable chemical shift artifact removal and separation of PFCE and PFOB signals was achieved in phantoms and in vivo. Signal intensities correlated excellently to the relative 19F compound concentrations (r−2 = 0.966/0.990 for PFOB/PFCE).
Conclusions
The method requires minimal sequence adaptation and is therefore easily implemented on different MRI systems. Simulations, phantom experiments, and in‐vivo measurements in mice showed effective separation and removal of chemical shift artifacts below noise level. We foresee applicability for simultaneous in‐vivo imaging of 19F‐containing fluorine probes or for detection of 19F‐labeled cell populations.
Keywords: 19F, compressed sensing, deconvolution, fluorine MRI, multicolor, multiplex, sparse MRI
1. INTRODUCTION
Fluorine (19F) MRI is rapidly gaining traction for in‐vivo cell tracking as it possesses several advantages over traditional 1H MRI and other imaging methods.1 First, the human body contains negligible amounts of 19F. Therefore, any detected 19F‐MRI signal originates solely from exogenously administered fluorine probes, making accurate quantification possible.2 Second, given that 19F resonates at a frequency distinguishable from 1H, the 19F signal does not influence 1H contrast, allowing imaging with regular proton density and T1‐ and T2‐weighted 1H‐MRI.
For most cell tracking and inflammation 19F‐MRI studies, perfluorocarbon (PFC)–based nanoparticles are applied.3, 4, 5 Upon intravenous injection, these fluorinated nanoparticles accumulate at inflamed tissues, hematopoietic organs, such as the bone marrow and spleen, as well as in the liver, where they are taken up by phagocytic cells. So far, 19F‐MRI has shown great potential and has been explored in a variety of studies including Alzheimer's disease, lung imaging, cancer, myocardial infarction and stroke, and inflammatory bowel disease.2, 6, 7, 8
The different PFCs differ from one another in terms of the number of 19F resonances and their chemical shifts. This enables unambiguous discrimination on the basis of their MR spectrum. This property has been previously exploited to separate confounding signal from isoflurane (a commonly used anesthetic) from the 19F signal of interest.9 More important, these differences can be leveraged to detect different 19F‐containing nanoparticles—and thus populations of 19F‐labeled cells—in the same sample and in the same imaging session, enabling “multicolor” or “multiplex” 19F‐MRI. This technique has potential as an in‐vivo, noninvasive readout of tissue immune cells composition, similar to commonly used ex‐vivo immunological assays, such as flow cytometry.
However, recording multiple 19F resonances in a single MR spectrum gives rise to chemical shift artifacts, which present themselves as signal ghosts in the readout gradient direction and hinder accurate localization and quantification. Several strategies have been proposed to avoid or mitigate these. The first is spectrally selective excitation and selective suppression of certain resonances,10, 11, 12, 13 which can also be used to image multiple different compounds,14, 15, 16 at the cost of increased scan times and excluding signal of nonexcited resonances.
A second strategy is chemical shift imaging (CSI).17, 18 CSI suffers from long acquisition times though and therefore acceleration by the use of pseudo‐radial projections19 and compressed sensing20 has been proposed. Although effective in terms of signal‐to‐noise ratio (SNR),21 lengthy acquisitions remain a problem for 3D acquisitions at moderate‐to‐high spatial and spectral resolutions.
Dixon‐type bSSFP (balanced steady‐state free precession) and multiecho acquisitions methods separate the 19F resonances based on their phase evolution.9, 22 These methods require the acquisition of multiple echoes with increasing TE. This comes at the cost of increased scan time decreased SNR and increased sensitivity to T2* effects and motion with increasing TE.
As an alternative to acquisition‐based methods, sensitivity encoding23 includes coil sensitivities and spectra in a linear model, which is subsequently solved by pseudo‐inversion. Although artifact‐free multicolor imaging was demonstrated, this method is prone to noise and in this implementation requires multiple coil elements.
Finally, chemical shift artifacts can be resolved during image reconstruction. As early as in the 1980s, deconvolution methods were proposed as an approach to remove chemical shift image artifacts.24 However, plain deconvolution in the presence of noise results in noise amplification, thereby affecting image quality. More advanced deconvolution algorithms, such as the reblurred deconvolution method,25 have been proposed to overcome this issue. More recently, iterative regularized deconvolution under the assumption of sparsity in the image domain as an additional prior26 has been introduced. However, these deconvolution techniques do not allow discrimination of multiple fluorinated compounds because the underlying models assume an equal MR spectrum for all 19F signal.
Here, we introduce an alternative deconvolution approach that is based on cycling of the readout gradient, allowing multicolor imaging of different 19F compounds with complex and overlapping spectra. The method exploits the sparse nature of most 19F images by iterative deconvolution, removes the chemical shift artifacts associated with multiple peaks in the 19F spectra, and thereby enables discrimination of 19F compounds in the resulting images. We show reliable separation and artifact removal in numerical simulations and in phantoms, as well as in mice after intramuscular injection of perfluorooctyl bromide (PFOB) and perfluoro‐15‐crown‐5‐ether (PFCE) nanoparticles and in mouse liver and spleen at several time points after intravenous administration.
2. METHODS
Our method is based on a sequential or interleaved acquisition of images with different readout directions. While in our experiments we have used a 3D gradient echo acquisition (see Table 1 for imaging parameters), this method can be applied to 3D imaging (e.g., fast spin echo), or any other sequences with predictable chemical shift artifacts, optimized to SNR per unit time. Imaging requires a broadband excitation to excite all peaks in the 19F spectra and a k‐space sampling method resulting in well‐defined chemical shift artifacts.
Table 1.
Scan parameters
| Phantom | Mouse | ||||
|---|---|---|---|---|---|
| Intramuscular | Intravascular | ||||
| 19F | 19F | 1H | 19F | 1H | |
| Sequence | 3D FLASH | 3D FLASH | 3D FLASH | 3D FLASH | 3D FLASH |
| Readout direction | FH, HF, LR, RL | FH and LR | FH | FH and LR | FH |
| Acquisition matrix | 128 × 128 × 128 | 128 × 128 × 128 | 128 × 128 × 128 | 64 × 64 × 64 | 128 × 128 × 128 |
| Field of view (mm3) | 40 × 40 × 40 | 40 × 40 × 40 | 40 × 40 × 40 | 40 × 40 × 40 | 40 × 40 × 40 |
| TE (ms) | 3.03 | 3.03 | 2.76 | 2.76 | 2.76 |
| TR (ms) | 20 | 20 | 20 | 20 | 20 |
| Flip angle | 35° | 25° | 25° | 25° | 25° |
| Excitation BW (Hz) | 33,000 | 33,000 | 33,000 | 33,000 | 33,000 |
| Receiver BW (Hz) | 44,600 | 44,600 | 44,600 | 44,600 | 44,600 |
| No. of averages | 4 | 6 | 2 | 24 | 4 |
| Scan time | 4 × 21m51s | 2 × 32m46s | 10m55s | 2 × 32m46s | 10m55s |
BW = bandwidth; FH = foot‐to‐head; HF = head‐to‐foot; LR = left‐to‐right; RL = right‐to‐left.
2.1. A 2‐compound, 2‐measurement model
We illustrate the method by considering two 19F compounds with different resonance spectra (i.e., PFOB and PFCE) in Figure 1A. PFOB has a complex 19F spectrum with multiple resonance peaks originating from 1 CF2Br, 1 CF3, and 6 CF2 groups, whereas PFCE has a single peak from 10 identical CF2 groups at a different resonance frequency than those of PFOB.17
Figure 1.
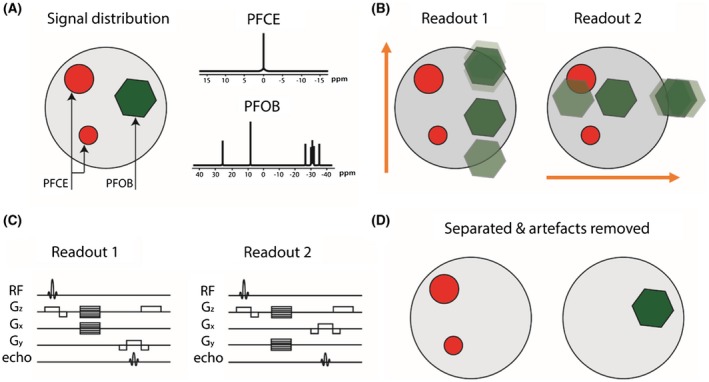
Schematic illustration of the technique to correct chemical shift artifacts and separate multiple compounds in 19F‐MRI. A, PFOB and PFCE at different locations in the image. PFOB has a complex spectrum with several resonances, whereas PFCE has a single resonance. B, Two acquisitions with readout in down‐up and left‐right directions (orange arrows), leading to chemical shift artifacts from the multiple PFOB resonances in vertical and horizontal direction, respectively. C, The FLASH sequence diagrams describing the 2 acquisitions with different readout directions. D, The 2 acquisitions are combined using the algorithm described, showing that PFOB and PFCE are separated and chemical shift artifacts resolved
To spectrally unmix the 2 compounds in MR imaging, at least 2 acquisitions with different chemical shift artifact behavior are required, for example, 1 with a readout direction in the horizontal orientation and 1 with the readout in the vertical direction. We will represent these measurements by the column vectors and , respectively. Let F be the Fourier sampling operator and C ℎ and Cv the circular convolution operators convolving an image with the spectrum of PFOB in horizontal and vertical directions of frequency encoding, respectively. A single reconstructed PFOB and PFCE image xi will thus contain chemical shift artifacts, described by Equation 1:
| (1) |
Because PFCE has only a single peak which we center at 0 ppm, the sampling convolution operator for PFCE is the identity operator I. The full measurement model for 2 frequency encoding directions, horizontal ℎ and vertical v, together now reads as shown by Equation 2:
| (2) |
with the noise contribution. Equation 2 can be generalized to Equation 3:
| (3) |
with M the full signal encoding matrix for both compounds and readout directions. The method is illustrated in Figure 1.
2.2. Generalization of the measurement model
The encoding matrix M can be extended in a straightforward way to include more 19F‐containing compounds and more measurements. One needs at least as many measurements as the number of 19F‐compounds to solve the reconstruction problem. A higher number of measurements would improve the robustness of the reconstruction. A generalized form of Equation 2 with N measurements and M compounds reads as shown by Equation 4:
| (4) |
where yn is the nth different direction acquired and xPFC‐m is the mth different 19F‐containing compound. Cn,m are the expected spectra for compounds m and readout n. These can be varied by changing readout direction, like we have done in this article, but also by, for example, modifying the readout bandwidth. The acquisitions yn need not be full k‐space acquisitions, but can be undersampled to accommodate parallel imaging or compressed sensing reconstructions.
2.3. Image reconstruction
Equation 3 can be solved by direct inversion, that is, multiplying the measurement data by the pseudo‐inverse of the signal encoding matrix M +, according to Equation 5:
| (5) |
However, this approach will induce noise amplification, even for very low noise levels.25 To prevent this, Equation 3 can be modified to a least absolute shrinkage and selection operator (LASSO), as shown by Equation 6:
| (6) |
where W is an image transform, such as a wavelet transform or a total‐variation operator, and λ a regularization parameter which controls the balance between sparsity and data consistency. In this study, the wavelet transform was used, and the equation was solved with a nonlinear conjugate gradient algorithm.27 In addition to increased noise robustness, the LASSO method allows for flexibility in k‐space acquisition, enabling advanced sampling schemes, such as random undersampling. As such, our approach is also fully compatible with compressed sensing acceleration.
2.4. Estimation of the convolution operator
The convolution operator (point‐spread function) of PFOB is shown by Equation 7:
| (7) |
where NR is the number of resonances, αj is the relative amplitude and δj (Hz) the chemical shift of resonance peak j, BW (Hz) the readout bandwidth, and Ni the matrix size in readout direction. PFOB has 7 resonances, but 3 of them are close and their relative chemical shift is generally smaller than a pixel. Therefore, we have used NR = 5 for PFOB in this study.
The relative amplitudes and pixel shifts of Ci can be calculated from the theoretical spectrum or measured in a phantom with a pure compound.
2.5. Numerical simulation of noise robustness
The influence of noise on the ability of our algorithm to reconstruct and separate the signal of 2 19F‐containing nanoemulsions was investigated by numerical simulations in Matlab (The MathWorks, Inc., Natick, MA). A 2D image of 64 × 64 pixels, containing 2 elliptical PFOB and 2 elliptical PFCE phantoms, was used. The PFOB chemical shift artifacts were calculated as in Equation 7. Two readout directions were simulated, and Gaussian noise was added to the fully sampled k‐space. Reconstruction was performed in 2 ways: (1) a simple deconvolution, by multiplying the k‐space with the pseudo‐inverse of M, as in Equation 5; (2) minimization of Equation 6 with a nonlinear conjugate gradient algorithm. Simulations were performed for a range of noise inputs, with zero mean and a standard deviation ranging from 0 to 20 a.u. (one‐fifth of the maximum intensity of the 2 brightest ellipses), corresponding to the lowest SNR = 5. For all simulated noise values, the mean intensity of the reconstructed images was tested in 3 regions‐of‐interest (ROI): (i) a ROI in the PFOB phantom; (ii) a ROI in the PFCE phantom; and (iii) a ROI in a noise‐only region of the image.
2.6. Imaging
All imaging was performed on a 7T preclinical scanner (Bruker Biospec 70/30; Bruker Corporation, Billerica, MA) using a dedicated 1H/19F volume coil with a 4‐cm inner diameter (MR Coils, Zaltbommel, The Netherlands). The imaging frequency was centered on the PFCE peak in the MR spectrum before 2 or 4 sets of 19F images were acquired using a 3D fast‐low angle shot (FLASH) sequence. In the case of 2 readout directions, half of the data was acquired with readout direction left‐to‐right, whereas the other half was acquired with readout direction foot‐to‐head. In the case of 4 directions, additional right‐to‐left and head‐to‐foot readouts were acquired.
2.7. Phantom 19F MRI
Six 200‐µL Eppendorf tubes with a mixture of pure PFOB/PFCE oils (Avanti Lipids, Alabaster, AL) were prepared by linearly varying the relative volume in the mixtures in a total volume of 100 µL (0/100; 20/80; 40/60; 60/40; 80/20; 100/0 mL PFOB/mL PFCE respectively). These tubes were positioned in a circular phantom setup, also containing an Eppendorf tube filled with water for localization by 1H imaging. Imaging was performed with the scan parameters reported in Table 1. The mean and standard deviation of the intensities in the 6 phantoms in an ROI covering the entire tube was calculated in the resulting images. Means and standard deviations were then normalized to the mean intensities of the pure compounds.
2.8. In vivo 19F MRI
All experiments were performed in accord with protocols approved by the Mount Sinai Animal Care and Utilization Committee.
2.9. Synthesis of the PFOB and PFCE containing nanoemulsions
2.9.1. Materials
PFOB, PFCE, DMPC (1,2‐dimyristoyl‐sn‐glycero‐3‐phosphocholine), and DPSE‐PEG2000 (1,2‐distearoyl‐sn‐glycero‐3‐phosphoethanolamine‐N‐[methoxy(polyethyleneglycol)‐2000]) were obtained from Avanti Lipids, chloroform was obtained from Sigma‐Aldrich (St. Louis, MO), and phosphate‐buffered saline (PBS) from Gibco (Grand Island, NY). Vivaspin (20‐mL variant) centrifugal filters were purchased from Sartorius (Göttingen, Germany). Dynamic light scattering measurements were performed on a ZetaPals analyzer (Brookhaven Instrument Corp., Holtsville, NY). Sonication was performed using a 150‐V/T ultrasonic homogenizer working at 30% power output.
2.9.2. Experimental procedure
Nanoemulsions were made by dissolving DMPC (36.17 mg, 53.4 μmol) and DPSE‐PEG2000 (63.8 mg, 22.86 μmol) in chloroform (~2 mL) and slowly dripping this in PBS (10 mL) at 80ºC under vigorous stirring. After all chloroform was added, the viscous solution was allowed to cool to room temperature and additional PBS added to compensate for evaporation. The lipid solution (1 mL) was combined with PBS (9 mL) in a Falcon tube (15 mL) and either PFOB or PFCE (320 μL) was added. This solution was subsequently sonicated using a tip sonicator (30 minutes) while cooled in an ice bath. Large precipitates were removed by carefully decanting the solution. The particles were concentrated by centrifugal filtration (1 MDa molecular‐weight cutoff) to approximately 1 mL. Samples for dynamic light scattering measurements were prepared by diluting the nanoparticles with PBS. The mean of the number average size distribution was typically 160 to 180 nm.
2.10. Intramuscular injection
A male C57BL/6 mouse was injected with the PFCE nanoemulsion in the right upper leg and with the PFOB nanoemulsion in both left and right upper legs. The animal was anesthetized with 1.5% isoflurane. Subsequently, 1H and 19F MRI was performed using the parameters described in Table 1. After image reconstruction, the PFCE and PFOB images were color‐coded and overlaid on the proton scan in Matlab.
2.11. Intravascular injection
Three male C57BL/6 mice were anesthetized with 1.5% isoflurane and underwent 3 longitudinal imaging sessions 24 hours apart, after intravenous injections of PFCE and PFOB containing nanoemulsions. At the beginning of each imaging session, 1H images were acquired using a FLASH 3D sequence. Relevant scan parameters can be found in Table 1. Before the first imaging session, PFCE nanoemulsion (200 μL) was injected through a lateral tail vein. Twenty‐four hours afterward, mice were injected with PFOB nanoemulsion (200 μL) and immediately imaged using the same protocol. The third and final imaging session was performed 24 hours later (48 hours after PFCE nanoemulsion injection and 24 hours after PFOB nanoemulsion injection). After image reconstruction, a coronal slice was chosen that contained both liver and spleen tissue. The liver and spleen were segmented, and the mean image intensity was determined. The PFCE and PFOB images were colored and overlaid on the proton scan in Matlab.
2.12. Reconstruction and postprocessing
Translation errors may occur when the PFCE resonance is not exactly centered at 0 ppm. Before spectral unmixing, the images with different readout directions were 3‐dimensionally co‐registered using Matlab's imregister, to quantify the translation mismatch. A regular step gradient descent algorithm was used for imregister, with a maximum number of iterations of 100 and a relaxation factor of 0.5. The translation error was subsequently corrected in k‐space. All data in this article were reconstructed with the conjugate gradient algorithm, using a value of λ = 0.01 and 75 iterations. These reconstruction parameters were empirically selected for optimal SNR, while limiting oversmoothing. The peak heights in the convolution spectrum (Equation 7) were based on the relative amplitudes of a PFOB phantom scanned with the same sequence parameters. After reconstruction, 19F images were color‐coded and overlaid on proton images. Thresholding of the 19F signal was performed by setting all signal below the noise level to zero. Reconstruction code and example data are available online at https://github.com/amc-mri/19F-multicolor.
3. RESULTS
3.1. Numerical simulations
Numerical simulations were performed for an image containing 2 PFOB and 2 PFCE hot spots (Figure 2). The regular Fourier transform images for vertical and horizontal readout directions contain chemical shift artifacts for the PFOB (Figure 2A). Reconstruction was performed either as multiplication with the pseudo‐inverse (Figure 2B) or by using the LASSO with a conjugate gradient (CG; Figure 2C). Both methods successfully separated the 2 compounds and removed the chemical shift artifacts for PFOB. However, the pseudo‐inverse reconstruction resulted in visually more noisy images as compared to CG reconstruction. Figure 3 presents the results for a simulation with a range of noise input images. Over the whole range of SNR values, the discrimination of the 2 compounds remained successful; there was no residual PFCE signal in the PFOB images because the signal at the location of the PFCE hot spots was equal to background signal. Similarly, no residual PFOB signal was observed in the PFCE images. For the CG method, the background signal (noise) essentially followed the nominal input SNR values. However, the pseudo‐inverse method leads to significant noise amplification, particularly for the PFOB images.
Figure 2.
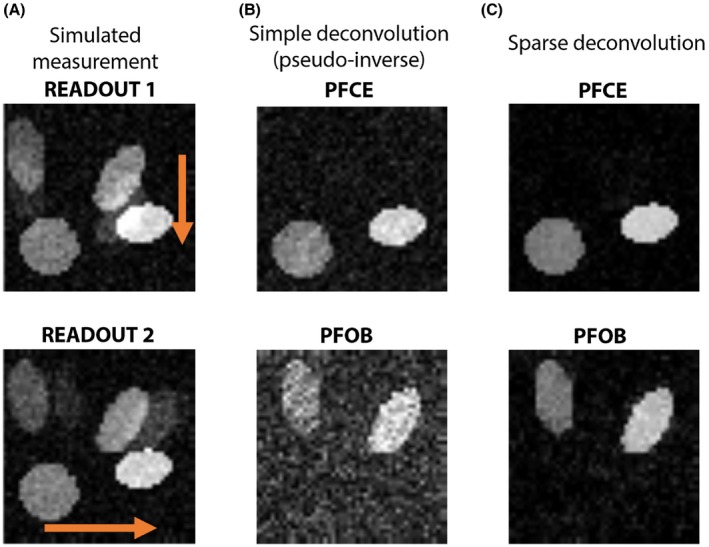
Simulation of PFOB and PFCE signal separation and chemical shift artifact removal. A, Noisy acquisitions of 2 PFOB and 2 PFCE hot spots with readout in vertical and horizontal directions (orange arrows). The chemical shift artifacts from PFOB are apparent. B, A pseudo‐inverse reconstruction effectively separates the 2 compounds, but results in noise amplification. C, Our sparse deconvolution method achieves excellent signal separation, while preserving SNR. a.u. = arbitrary units
Figure 3.
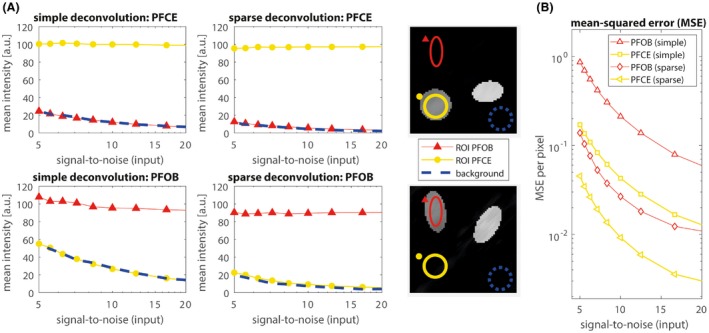
Simulated results for SNR levels between 5 and 20. A, Red triangles represent the mean signal in an ROI at the location of the PFOB phantom, yellow circles represent the mean signal in an ROI at the location of the PFCE phantom, whereas the blue dashed line indicates the mean signal intensity in noise ROI in the background. Both PFOB and PFCE mean signal intensities are relatively constant over the range of SNR values, and both methods achieve good signal separation. There is no residual PFOB signal in the PFCE images (top two graphs), given that the residual signal in the PFOB ROI (red triangles) is equal to the mean noise signal (blue dashed line). The same holds for residual PFCE in the PFOB image (bottom 2 graphs). However, noise levels with the new sparse‐deconvolution method are much lower compared to simple pseudo‐inverse reconstruction. B, Average mean squared error per pixel for the separated PFOB and PFCE images. Error levels are much lower for sparse deconvolution than for simple deconvolution. a.u. = arbitrary units; MSE = mean squared error
3.2. Phantom 19F MRI
Figure 4A shows the linear Fourier transform reconstructions of the PFOB/PFCE mixture phantoms for the acquisitions with readout in 4 different directions. Our CG method successfully discriminated PFCE and PFOB in the different phantoms and removed the chemical shift artifacts (Figure 4B). The relative PFOB and PFCE signal intensities in the images were consistent with the mixture ratios (Figure 4C,D). The coefficients of variations (r2) were 0.966 and 0.990 for PFOB and PFCE respectively.
Figure 4.
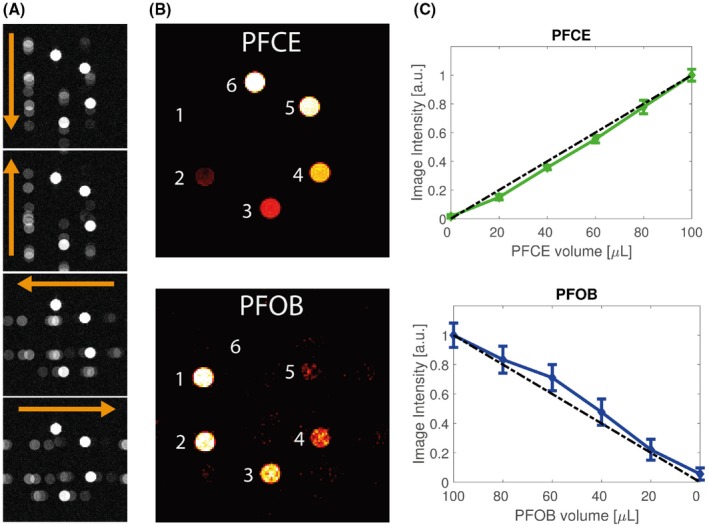
Phantom measurement of 6 Eppendorf tubes containing PFOB/PFCE with varying volume ratios. A, 19F‐MRI of the 6 phantoms with readout in 4 different directions (orange arrows). B, Reconstructions of PFOB and PFCE signals. C, Normalized mean signal intensities and standard deviation in the phantoms as function of PFCE and PFOB volume contributions. The dashed black line indicates a linear increase from 0 to 1. The coefficients of variation for PFOB and PFCE were r2 = 0.966 and r2 = 0.990, respectively. a.u. = arbitrary units
3.3. Intramuscular injection
Figure 5 displays an axial, sagittal, and coronal slice, as well as magnifications, through the pockets of PFOB and PFCE nanoemulsions, which were injected in the mouse muscle. The 19F images resulting from PFOB and PFCE are shown as green, and red overlays on the 1H MR images. Our CG method successfully removed the chemical shift artifacts from PFOB and separated the PFOB and PFCE signals. The pockets of nanoemulstions are also visible on the 1H MR images as darker regions.
Figure 5.
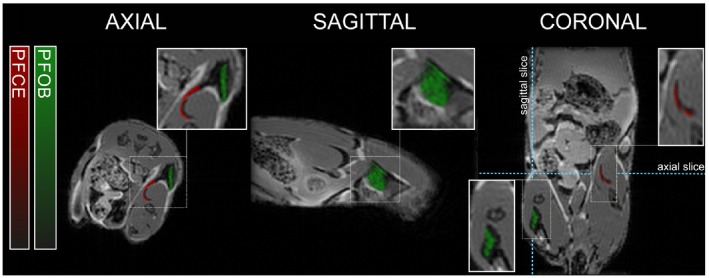
19F‐MRI after intramuscular injections of PFOB and PFCE nanoemulsions. Reconstructed PFOB (green) and PFCE (red) signals (arbitrary units) are overlaid on the 1H‐MRI anatomical image. PFOB was injected on both sides and PFCE in the right upper leg only
3.4. Intravascular injection
Images of a representative mouse which received intravascular injections of PFCE and PFOB nanoemulsions are shown in Figure 6. Again, 19F signal resulting from PFOB and PFCE are shown as green and red overlays on 1H MRI anatomical images. After injection, both PFCE and PFOB accumulated in liver and mainly spleen over time. PFCE was injected at day 0 before the first imaging session and PFOB emulsion 1 day later. Therefore, at day 0, only PFCE signal was observed, whereas PFOB appears at the 24‐hour time point. At 48 hours, PFCE signal was also observed in the bone marrow in the spine and hip bones.
Figure 6.
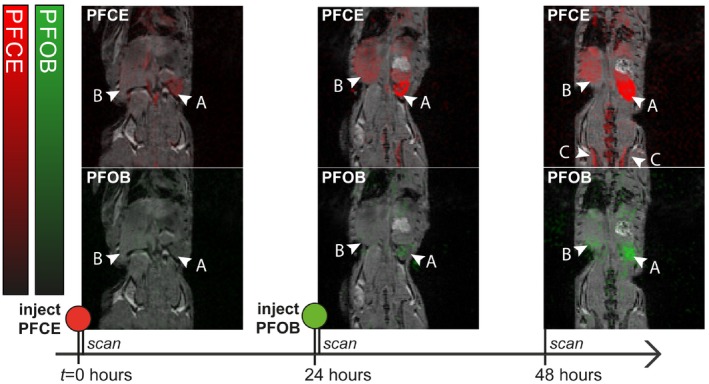
In vivo 19F‐MRI of a mouse injected with PFCE nanoemulsion at t = 0 hours and PFOB nanoemulsion at t = 24 hours. PFOB and PFCE signal are reconstructed and overlaid on a 1H‐MRI anatomical image. Color bars indicate PFOB (green) and PFCE (red) signal intensity in arbitrary units. The nanoemulsions accumulate mainly in the spleen (arrow head marked “a”) and to a lesser extent in liver (arrow head marked ‘b’). At 48 hours, accumulation in bone marrow (arrow heads marked “c”) is also observed
The mean 19F PFOB and PFCE signal intensities of the spleen and liver of the 3 mice as a function of time are plotted in Figure 7. The PFCE signal in both organs increased after the injection time, between day 0 and day 1, and remained relatively constant between day 1 and day 2. In contrast, the PFOB signal, which was injected 24 hours later, was not visible above the noise level at day 0 and increased between day 1 and day 2.
Figure 7.
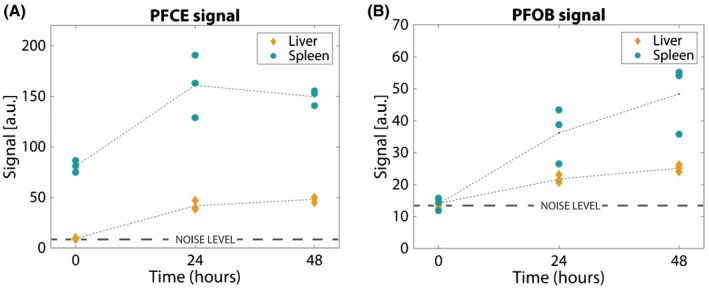
Mean image intensities in liver (yellow diamonds) and spleen (blue circles) of the 3 measured mice. Intensities are clustered closely together both in the PFCE (a) as in the PFOB images (b), for similar time points and organs. The increase in intensity over time corresponds to the IV injection times: PFOB image intensity increases overall between 24 and 48 hours, whereas PFCE intensity remains relatively constant between these time points. a.u. = arbitrary units
4. DISCUSSION
We have introduced a novel deconvolution approach for multicolor imaging of different 19F compounds with complex spectra. Our method exploits the sparse nature of most 19F images by iterative sparse deconvolution, removes the chemical shift artifacts associated with multiple peaks in the 19F spectra, and efficiently separates multiple 19F compounds in the images. We have also successfully applied this technique in in‐vivo small animal MR imaging.
We showed reliable separation and chemical shift artifact removal in numerical simulations. We found that, even for measurements with an SNR as low as 5, the separation of compounds was successful and signal intensities remained constant over SNR values ranging from 5 to 20, although background signal (noise) for the PFOB with the complex spectrum was consistently higher than for the single‐peak PFCE. Nevertheless, this shows that the LASSO reconstruction algorithm, which enforces sparsity in the images, efficiently regularizes the reconstruction to avoid noise amplification while preserving relative signal intensity and separation. We can conclude that this method is robust at low SNRs and does not lead to noise amplification, which is important given that 19F‐MRI is often signal deprived.
The phantom experiments (Figure 4) demonstrated that chemical shift artifacts are successfully removed and relative concentrations of PFOB and PFCE accurately determined. Relative signal intensities of both PFOB and PFCE scaled linearly with concentrations, although the standard deviation of the PFOB signal was somewhat higher than that of PFCE. This can be explained partly by lower signal of PFOB as compared to PFCE, attributed to differences in T1, T2, and 19F atom concentration, but also by the higher residual background signal (noise amplification25) associated with the reconstruction of the PFOB signal (Figure 3). The degree of noise amplification attributed to the deconvolution is controlled by the regularization parameter λ and is a trade‐off between denoising and over smoothing.
Intramuscular injections of PFOB and PFCE nanoemulsions were used to test the acquisition and reconstruction protocol in an in‐vivo setting. The pockets of PFOB and PFCE in the muscle could be readily identified and separated (Figure 5). The injection pockets were also observed on the anatomical T1‐weighted proton images as signal voids. These signal voids colocalized well with the reconstructed PFOB and PFCE hot spots.
Finally, the applicability of our approach was put to the test in 3 mice which were intravenously injected with PFCE and PFOB nanoemulsions. These experiments indeed demonstrated that PFOB and PFCE nanoemulsion accumulations can be separately imaged, even when both compounds are present in the same organs.
4.1. Technical considerations
Although we require multiple acquisitions with different readout gradient directions, our multicolor 19F‐MRI experiment does not lead to increased acquisition times. Given that 19F‐MRI generally involves the detection and localization of low concentrations of 19F‐containing compounds, many signal averages are required to achieve acceptable SNR. The measurements in different directions can therefore be distributed over the averages, ensuring that the total acquisition time remains the same as the normal sequence and the resulting image SNR is not affected. SNR can even be improved by an optimized sparse k‐space sampling and compressed sensing reconstruction strategy.28 Our approach can be applied with different sequences (e.g., gradient‐echo or spin‐echo), provided that the multiple 19F resonances lead to predictable and nonidentical point spread functions.
We have neglected phase in our deconvolution model, given that no signal cancellations issues were noticed. Also, we think that the deconvolution method is robust to incidental phase‐related signal cancellation because the method can rely on the 7 resonances in the PFOB spectrum. Although the introduction of phase would be possible, a magnitude approach was chosen because phase images are much more prone to artifacts resulting from global and local field inhomogeneities.
Our experiments started with carefully centering the PFCE resonance frequency, which resulted in minimal (and often absent) misalignment between different readout directions. Any misalignment was then corrected with an image‐based registration algorithm. In case a simple registration fails, the registration can be included in the reconstruction algorithm in a so‐called blind deconvolution method, which jointly optimizes the deconvolution spectrum as well as the images. In that case, misregistration between images is also included in the optimization.
Although the SNR efficiency of the FLASH sequence is not optimal compared to more SNR‐efficient sequences like bSSFP, particularly when T1 and T2 are long, we believe our approach has distinct advantages that justify the use of the FLASH sequence. We collect all the signal from the different resonances in a single acquisition; the deconvolution has the effect of “collapsing” the signal of all peaks into one. Moreover, the FLASH sequence is relatively robust to Bo and B1 inhomogeneities and movement, which is a big advantage for 3D mouse abdominal imaging. Whereas a regular FLASH sequence may display the inhomogeneity artifacts, the relatively low matrix size in combination with an intermediate acquisition bandwidth limits pixel shifts. In practice, shimming in the mouse was adequate and we did not encounter problems. Even in the case of the plastic Eppendorf phantoms, which are difficult to shim and can induce considerable B0 inhomogeneities, our technique performed well. B1 inhomogeneities will have the usual influence on flip angle and signal intensity, but this will not influence the performance of the deconvolution method.
On the other hand, bSSFP is experimentally difficult at high magnetic fields in the mouse, and artifacts in the hot‐spot 19F images will be difficult to recognize. Moreover, bSSFP is not balanced for off‐resonance PFOB peaks, adding complexity to SNR behavior.
Previous work has demonstrated the possibility and usefulness of multicolor 19F imaging. Compared to multicolor imaging with selective excitation,14, 15 our method does not require multiple scans or acquisition of multiple echoes. SNR is maximized because we collect all the signal from the different resonances in a single acquisition and distribute the different readout directions over the averages.
Chemical shift imaging has been proposed17, 18; however, this method suffers from long acquisition times because of the need for an additional phase‐encoding dimension. Even accelerated chemical shift imaging19, 20 will ultimately be time‐limited with excessively long scan times for high‐resolution 3D imaging.
Chemical shift encoding22 uses a Dixon‐like approach to separate multiple PFC compounds and remove artefacts. This requires acquisition of multiple echoes with varying TE. However, our approach is sequence independent and does not suffer from T2* effects.
The usage of a multiple measurement model is closely related to the SENSE‐like, coil‐sensitivity–based decoupling.23 Here, we have demonstrated deconvolution with different readout directions, but, if available, acquisition with multiple receive coils can also be included in the reconstruction model.
Future work will focus on comparing our method to other multicolor 19F techniques.
We have used a volume coil in this study, but the algorithm does not put constraints on coil type. Multicoil arrays could further improve SNR.
This method of separating 19F signal can be integrated into recently adapted compressed sensing techniques.20, 29 The here presented approach for multicolor 19F‐MRI is fully compatible with parallel imaging and k‐space undersampling, and future work will focus on this application. More recently, machine learning (ML) techniques have been used to remove ghosts in spectroscopy.30 In a similar vein, ML methods could be developed for the purposes of multicolor 19F‐MRI artifact removal and denoising.
Our experiments were designed with either 2 or 4 different readout directions. While keeping the acquisition time the same, one can increase the number of readout directions and reduce the number of averages per direction. We think that it is beneficial to use more readout directions (with less averages) to mitigate direction‐related imperfections attributed to translation, motion, or gradient imperfections. On the other hand, the SNR per readout should be high enough to distinguish the chemical‐shifted 19F resonances. The optimal number of directions therefore needs to be balanced with SNR, which could be a topic of future studies.
We expect our methodology to find application in noninvasive readout of tissue immune cells composition. In mouse studies, 19F multicolor MRI may replace commonly used ex‐vivo immunological assays, such as flow cytometry, and facilitate longitudinal in‐vivo studies. The methods may be translated to clinical scanners in a straightforward way, given that it requires merely a standard 3D FLASH sequence with different readout directions. Of course, the clinical system needs to be equipped with 19F coils, 19F send and receive capability, and multinuclear software. At 3T, the lower field strength will result in decreased detection sensitivity, which might be mitigated with improved sampling strategies. Also, the appropriate regulatory approval is required for the safe use of specific 19F compounds in humans. If these conditions are met, we believe that our approach can be a valuable addition to 19F‐labeled cell tracking studies in humans.
5. CONCLUSION
We successfully implemented an iterative deconvolution method for multicolor 19F‐MRI that is applicable in all sequences exhibiting well‐defined chemical shift artifacts. In phantoms as well as in mice, in‐vivo reliable chemical shift artifact removal and separation of PFCE and PFOB compounds was achieved. Our technique efficiently discriminates different 19F compounds and facilitates in‐vivo MRI localization and quantification of multiple 19F compounds.
ACKNOWLEDGMENTS
We gratefully acknowledge the support of NVIDIA Corporation with the donation of the Titan X Pascal GPU used for this research.
Schoormans J, Calcagno C, Daal MRR, et al. An iterative sparse deconvolution method for simultaneous multicolor 19F‐MRI of multiple contrast agents. Magn Reson Med. 2020;83:228–239. 10.1002/mrm.27926
Funding information
Dutch Technology Foundation TTW, Grant/Award Number: MUSICIAN #14716; Dutch Technology Foundation STW (Stichting voor Technische Wetenschappen), Grant/Award Number: VENI grant #14348; and National Insititute of Health, Grants/Award Numbers: P01 HL131478 (W.J.M.M.) and R01 HL143814 (Z.A.F.), and American Heart Association 16SDG27250090 (C.C.); Deutsche Forschungsgemeinschaft, Grant/Award Number: MA 7059/1 (A.M.).
REFERENCES
- 1. Ahrens ET, Flores R, Xu H, Morel PA. In vivo imaging platform for tracking immunotherapeutic cells. Nat Biotechnol. 2005;23:983–987. [DOI] [PubMed] [Google Scholar]
- 2. Srinivas M, Heerschap A, Ahrens ET, Figdor CG, de Vries I. 19F MRI for quantitative in vivo cell tracking. Trends Biotechnol. 2010;28:363–370. [DOI] [PMC free article] [PubMed] [Google Scholar]
- 3. Temme S, Bönner F, Schrader J, Flögel U. 19F magnetic resonance imaging of endogenous macrophages in inflammation. Wiley Interdiscip Rev Nanomed Nanobiotechnol. 2012;4:329–343. [DOI] [PubMed] [Google Scholar]
- 4. Ruiz‐Cabello J, Walczak P, Kedziorek DA, et al. In vivo ‘hot spot’ MR imaging of neural stem cells using fluorinated nanoparticles. Magn Reson Med. 2009;60:1506–1511. [DOI] [PMC free article] [PubMed] [Google Scholar]
- 5. Ruiz‐Cabello J, Barnett BP, Bottomley PA, Bulte J. Fluorine (19F) MRS and MRI in biomedicine. NMR Biomed. 2011;24:114–129. [DOI] [PMC free article] [PubMed] [Google Scholar]
- 6. Yanagisawa D, Amatsubo T, Morikawa S, et al. In vivo detection of amyloid β deposition using 19F magnetic resonance imaging with a 19F‐containing curcumin derivative in a mouse model of Alzheimer's disease. Neuroscience. 2011;184:120–127. [DOI] [PubMed] [Google Scholar]
- 7. Ebner B, Behm P, Jacoby C, et al. Early assessment of pulmonary inflammation by 19F MRI in vivo. Circ Cardiovasc Imaging. 2010;3:202–210. [DOI] [PMC free article] [PubMed] [Google Scholar]
- 8. Kadayakkara DK, Ranganathan S, Bin Young W, Ahrens ET. Assaying macrophage activity in a murine model of inflammatory bowel disease using fluorine‐19 MRI. Lab Investig. 2012;92:636–645. [DOI] [PMC free article] [PubMed] [Google Scholar]
- 9. van Heeswijk RB, Colotti R, Darçot E, et al. Chemical shift encoding (CSE) for sensitive fluorine‐19 MRI of perfluorocarbons with complex spectra. Magn Reson Med. 2018;79:2724–2730. [DOI] [PMC free article] [PubMed] [Google Scholar]
- 10. Freeman DM, Muller HH, Hurd RE, Young SW. Rapid 19F magnetic resonance imaging of perfluorooctyl bromide in vivo. Magn Reson Imaging. 1988;6:61–64. [DOI] [PubMed] [Google Scholar]
- 11. Nöth U, Jäger LJ, Lutz J, Haase A. Fast F‐19‐NMR imaging in‐vivo using flash‐MRI. Magn Reson Imaging. 1994;12:149–153. [DOI] [PubMed] [Google Scholar]
- 12. Giraudeau C, Flament J, Marty B, et al. A new paradigm for high‐sensitivity 19F magnetic resonance imaging of perfluorooctylbromide. Magn Reson Med. 2010;63:1119–1124. [DOI] [PubMed] [Google Scholar]
- 13. Goette MJ, Keupp J, Rahmer J, Lanza GM, Wickline SA, Caruthers SD. Balanced UTE‐SSFP for 19F MR imaging of complex spectra. Magn Reson Med. 2015;74:537–543. [DOI] [PMC free article] [PubMed] [Google Scholar]
- 14. Bulte J. Detecting different cell populations using multispectral 19F MRI. Radiology. 2019;291:358–359. [DOI] [PubMed] [Google Scholar]
- 15. Partlow KC, Chen J, Brant JA, et al. 19F magnetic resonance imaging for stem/progenitor cell tracking with multiple unique perfluorocarbon nanobeacons. FASEB J. 2007;21:1647–1654. [DOI] [PubMed] [Google Scholar]
- 16. Chirizzi C, De Battista D, Tirotta I, et al. Multispectral MRI with dual fluorinated probes to track mononuclear cell activity in mice. Radiology. 2019;20:1–7. [DOI] [PubMed] [Google Scholar]
- 17. Jacoby C, Temme S, Mayenfels F, et al. Probing different perfluorocarbons for in vivo inflammation imaging by 19F MRI: image reconstruction, biological half‐lives and sensitivity. NMR Biomed. 2014;27:261–271. [DOI] [PubMed] [Google Scholar]
- 18. Basse‐Lüsebrink TC, Stoll G, Weise G, Jakob PM, Kleinschnitz C, Kampf T. In vivo imaging of stepwise vessel occlusion in cerebral photothrombosis of mice by 19F MRI. PLoS ONE. 2011;6:e28143. [DOI] [PMC free article] [PubMed] [Google Scholar]
- 19. Yildirim M, Keupp J, Nicolay K, and Lamerichs R. Chemical shift independent imaging of 19F contrast agents using ultrafast MRSI (F‐uTSI) M. In Proceedings of the 15th Annual Meeting of the ISMRM, Berlin, Germany, 2007. p. 1249. [Google Scholar]
- 20. Kampf T, Fischer A, Basse‐Lüsebrink TC, et al. Application of compressed sensing to in vivo 3D 19F CSI. J Magn Reson. 2010;207:262–273. [DOI] [PubMed] [Google Scholar]
- 21. Pohmann R, Von Kienlin M, Haase A. Theoretical evaluation and comparison of fast chemical shift imaging methods. J Magn Reson. 1997;129:145–160. [DOI] [PubMed] [Google Scholar]
- 22. Ludwig KD, Hernando D, Roberts NT, van Heeswijk RB, Fain SB. A chemical shift encoding (CSE) approach for spectral selection in fluorine‐19 MRI. Magn Reson Med. 2018;79:2183–2189. [DOI] [PMC free article] [PubMed] [Google Scholar]
- 23. Lips O, Keupp J. Reduction of chemical shift artifacts in 19F imaging utilizing coil sensitivities. In Proceedings of the 16th Annual Meeting of the ISMRM, Toronto, Ontario, Canada, 2008. p. 1738. [Google Scholar]
- 24. Busse LJ, Thomas SR, Pratt RG, et al. Deconvolution techniques for removing the effects of chemical shift in 19F nuclear magnetic resonance imaging of perfluorocarbon compounds. Med Phys. 1986;13:518–524. [DOI] [PubMed] [Google Scholar]
- 25. Lee HK, Nalcioglu O. Reblurred deconvolution method for chemical shift removal in F‐19 (PFOB) MR imaging. J Magn Reson Imaging. 1992;2:53–61. [DOI] [PubMed] [Google Scholar]
- 26. Meissner M, Reisert M, Hugger T, Hennig J, Von Elverfeldt D, Leupold J. Revealing signal from noisy 19F MR images by chemical shift artifact correction. Magn Reson Med. 2015;73:2225–2233. [DOI] [PubMed] [Google Scholar]
- 27. Lustig M, Donoho D, Pauly JM. Sparse MRI: the application of compressed sensing for rapid MR imaging. Magn Reson Med. 2007;58:1182–1195. [DOI] [PubMed] [Google Scholar]
- 28. Darçot E, Yerly J, Hilbert T, et al. Compressed sensing with signal averaging reduces motion artifacts in fluorine‐19 MRI. In Proceedings of the 25th Annual Meeting of the ISMRM, Honolulu, HI, 2017. [Google Scholar]
- 29. Zhong J, Mills PH, Hitchens TK, Ahrens ET. Accelerated fluorine‐19 MRI cell tracking using compressed sensing. Magn Reson Med. 2013;69:1683–1690. [DOI] [PMC free article] [PubMed] [Google Scholar]
- 30. Kyathanahally SP, Döring A, Kreis R. Deep learning approaches for detection and removal of ghosting artifacts in MR spectroscopy. Magn Reson Med. 2018;80:851–863. [DOI] [PubMed] [Google Scholar]


