

Abstract
Objectives
This paper assesses patient‐ and population‐level trends in TB notifications during rapid expansion of antiretroviral therapy in Eswatini which has an extremely high incidence of both TB and HIV.
Methods
Patient‐ and population‐level predictors and rates of HIV‐associated TB were examined in the Shiselweni region in Eswatini from 2009 to 2016. Annual population‐level denominators obtained from projected census data and prevalence estimates obtained from population‐based surveys were combined with individual‐level TB treatment data. Patient‐ and population‐level predictors of HIV‐associated TB were assessed with multivariate logistic and multivariate negative binomial regression models.
Results
Of 11 328 TB cases, 71.4% were HIV co‐infected and 51.8% were women. TB notifications decreased fivefold between 2009 and 2016, from 1341 to 269 cases per 100 000 person‐years. The decline was sixfold in PLHIV vs. threefold in the HIV‐negative population. Main patient‐level predictors of HIV‐associated TB were recurrent TB treatment (adjusted odds ratio [aOR] 1.40, 95% confidence interval [CI]: 1.19–1.65), negative (aOR 1.31, 1.15–1.49) and missing (aOR 1.30, 1.11–1.53) bacteriological status and diagnosis at secondary healthcare level (aOR 1.18, 1.06–1.33). Compared with 2009, the probability of TB decreased for all years from 2011 (aOR 0.69, 0.58–0.83) to 2016 (aOR 0.54, 0.43–0.69). The most pronounced population‐level predictor of TB was HIV‐positive status (adjusted incidence risk ratio 19.47, 14.89–25.46).
Conclusions
This high HIV‐TB prevalence setting experienced a rapid decline in TB notifications, most pronounced in PLHIV. Achievements in HIV‐TB programming were likely contributing factors.
Keywords: tuberculosis, ART expansion, Swaziland, temporal trends
Abstract
Objectifs
Ce document évalue les tendances des notifications de la tuberculose (TB) à l’échelle des patients et de la population lors de l'expansion rapide du traitement antirétroviral à Eswatini, où l'incidence de la TB et du VIH est extrêmement élevée.
Méthodes
Les prédicteurs et les taux de TB associée au VIH à l’échelle des patients et de la population ont été examinés dans la région de Shiselweni à Eswatini de 2009 à 2016. Les dénominateurs annuels à l’échelle de la population obtenus à partir des données de recensement projetées et des estimations de la prévalence obtenues à partir d'enquêtes de population ont été combinés avec des données de traitement de la TB à l’échelle individuel. Les prédicteurs de la TB associée au VIH à l’échelle du patient et de la population ont été évalués à l'aide de modèles de régression logistique multivariée et binomiale négative multivariée.
Résultats
Sur 11.328 cas de TB, 71,4% étaient coinfectés par le VIH et 51,8% étaient des femmes. Les notifications de TB ont été réduites de 5,0 fois entre 2009 et 2016, passant de 1.341 à 269 cas par 100.000 personnes‐années. Le déclin était de 6,0 fois chez les PVVIH contre 3,0 fois dans la population négative pour le VIH. Les principaux prédicteurs de la TB associée au VIH à l’échelle des patients étaient les traitements antituberculeux récurrents (rapport de cotes ajusté [aOR] 1,40; intervalle de confiance à 95% [IC]: 1,19 à 1,65), un statut bactériologique négatif (aOR: 1,31; 1,15 à 1,49) et manquant (aOR: 1,30; 1,11 à 1,53) et le diagnostic au niveau des soins de santé secondaires (AOR 1,18; 1,06 à 1,33). Par rapport à 2009, la probabilité de contracter la TB a diminué pour toutes les années, de 2011 (aOR: 0,69; 0,58 à 0,83) à 2016 (aOR: 0,5; 0,43 à 0,69). Le prédicteur le plus prononcé de la TB à l’échelle de la population était le statut VIH‐positif (rapport de risque d'incidence ajusté: 19,47; 14,89 à 25,46).
Conclusions
Ce contexte de prévalence élevée de la TB‐VIH a connu un déclin rapide du nombre de notifications de TB, plus prononcé chez les PVVIH. Les réalisations dans la programmation VIH‐TB étaient probablement des facteurs contributifs.
Keywords: tuberculose, expansion de l’ART, Swaziland, tendances temporelles
Introduction
HIV is driving the TB epidemic in high HIV prevalence settings 1, 2, with sub‐Saharan Africa having the highest HIV prevalence and TB incidence globally 3, 4. TB has emerged as the main opportunistic infection in people living with HIV (PLHIV), with HIV co‐infection rates exceeding 50% in many southern African countries 4.
Several patient‐level factors predict HIV‐associated TB including older age, male sex and advanced HIV disease 5. Despite the protective effect of antiretroviral therapy (ART) against active TB disease across all baseline CD4 cell count strata, possibly stronger for lower CD4 count levels 6, 7, PLHIV receiving ART remain at higher risk of TB than the HIV‐negative population 7, 8, 9. At the population‐level, ecological studies suggested a decline in annual TB notifications with expansion of HIV treatment eligibility criteria and increased ART coverage 2, 10, 11, most pronounced in new and smear‐negative TB cases 2, 10, 12. Although modelling studies overall support these findings, the long‐term impact of ART scale‐up on TB reduction remains inconclusive 13, 14, 15. In some settings, the decline in TB occurred before or at the beginning of ART expansion 2, 10, suggesting other factors contributing to TB control 5, 10, 16, 17. For instance: (1) increased TB programme coverage, diagnosis and effective treatment is believed to reduce TB prevalence and mortality; (2) ART expansion is likely to drive the decline in incident TB in PLHIV; and (3) both interventions combined in high HIV‐TB prevalence settings may have a synergistic effect 13. Other factors are level of care and HIV prevalence at district level 5, 18.
Eswatini (former Swaziland) – the country with the highest HIV prevalence (32% in 18‐ to 49‐year‐olds) in the world 19 – experienced significant changes in the TB epidemic. In 2012 it had the highest annual TB incidence (1350/100 000 population) globally and 77% of TB patients were HIV co‐infected 20. Since then, estimated incidence rapidly declined to 398 cases per 100 000 population in 2016 4, coinciding with changes in TB programme interventions 17 and unprecedented ART expansion. This is the first study from Eswatini examining both patient‐ and population‐level predictors and trends of HIV‐associated TB during progressive expansion of HIV‐TB care over a period of 8 years.
Methods
Context
The predominantly rural Shiselweni region in southern Eswatini had a population of approximately 209 000 in 2009 21. The peak of the TB epidemic in Eswatini was during 2009–2010, and in 2009, the Shiselweni region had the highest reported case notification rate (1293/100 000 population) in the country (see Appendix S1, Figures S1‐S2) 22. The Ministry of Health supported by Médecins Sans Frontières (MSF) provided free ambulatory HIV and TB care (diagnosis, treatment initiation and treatment follow‐up) at three secondary health facilities and integrated it into 22 nurse‐led mobile doctor‐supported primary care clinics from 2009 to 2010. A description of changes in TB programing can be found elsewhere 17, 23. In summary, the Stop‐TB strategy was adopted in 2009 and comprised intensified TB screening, introduction of infection control measures and provision of isoniazid preventive therapy (in 2012). TB diagnosis was based on sputum smear‐microscopy, which was increasingly replaced by Xpert MTB/RIF from late 2011. Due to high HIV co‐infection rates, empiric TB therapy was encouraged following World Health Organisation (WHO) recommendations 24. HIV co‐infected TB patients were eligible for ART irrespective of CD4 cell count, and the ART eligibility threshold for non‐TB patients was expanded from 200 to 350 cells/mm3 in 2010 and to 500 cells/mm3 in 2015. One of the three health clusters introduced prompt ART initiation irrespective of immunologic criteria, in January 2013 under the prevention of mother‐to‐child transmission (PMTCT) option B+ approach 25, 26 and in October 2014 for all PLHIV (the WHO treat‐all approach).
Study design, data management and definitions
We analysed patient‐level (retrospective cohort analysis) and population‐level (ecological analysis) temporal trends and predictors of TB notifications in the Shiselweni region from January 2009 to December 2016. A TB notification case was defined as a patient starting treatment for drug‐sensitive or resistant TB. Patient‐level data were routinely abstracted from health facility records and entered into electronic TB treatment databases used for routine programme monitoring. Patients transferred in from another facility or outside the region were removed from analyses. Patients restarting TB therapy after treatment interruption or transitioning from first‐ to second‐line TB drug treatment (e.g. treatment failure) were counted once at the time of starting the first TB treatment course. The number of patients active on ART was obtained from the national electronic ART treatment database.
The electronic TB treatment register was maintained by MSF and the electronic ART database by the Ministry of Health with support for data entry by trained MSF data clerks at regional level. Data quality checks and data cleaning were routinely performed as well as data workshops addressing data completeness and reliability. Although these databases were not formally validated against other databases (e.g. laboratory data), the data obtained from the electronic TB database and from paper TB treatment registers were found to be consistent during data reviews.
Statistics
Cohort analysis
Baseline data were compared using the Pearson's chi‐squared test. Multiple imputation by chained equations was used to handle missing data (see Appendix S2) 27. A multivariate logistic regression model with 10 imputed datasets was used to describe predictors of HIV‐associated TB. Variables for inclusion were determined a priori based on knowledge from previous studies.
Ecological analysis
First, TB notification rates were calculated separately in each imputed dataset and then averaged across the 10 imputed datasets to create one dataset with complete observations to describe crude and standardised annual rates of TB notifications per 100 000 person‐years. Numerators of number of TB cases stratified by sex, age and HIV status were divided by the corresponding mid‐year projected regional population estimates (denominators) of the 2007 Eswatini population and housing census 21, 28. To obtain stratified denominators of PLHIV, sex‐ and age‐stratified population data were multiplied by the corresponding regional HIV prevalence estimates. Because regional stratified HIV prevalence estimates were not available from a single source, we used the 2011 Swaziland HIV Incidence Measurement Survey (SHIMS) estimates 19, 29 for the 20‐ to 49‐year‐olds, the 2006–2007 Demographic and Health Survey (DHS) estimates 28 for the ≤14‐ and ≥50‐year‐olds, and averaged SHIMS and DHS prevalence estimates for the 15‐ to 19‐year‐olds. Finally, the stratified mid‐year numbers of patients active on ART were divided by the corresponding stratified population estimates of PLHIV to obtain sex‐ and age‐stratified ART coverage estimates.
Second, because the outcome was number of TB cases and data showed overdispersion, we built negative binomial regression models to obtain population‐level adjusted incidence risk ratios (aIRR). Model‐1 considered the entire study period adjusted for the population‐level covariates sex, age and HIV status. Model‐2 combined HIV status and ART status into one covariate with three categories (HIV‐negative case, PLHIV on ART, PLHIV without ART), but was restricted to the years from 2009 to 2014 as reliable stratified ART coverage estimates were not available for the time period thereafter.
Finally, we plotted trends in TB notifications and ART coverage between 2008 and 2016. To complement missing information, the national TB programme annual report 22 provided the 2008 regional TB notification estimate, and the first and second Swaziland HIV Incidence Measurement Surveys 19, 29, 30 provided the regional 2011 and regional 2016 ART coverage estimates overall and separately for men and women.
Analyses were performed with Stata/SE 14.1 (College Station, Texas, USA).
Ethics
This analysis was approved by the Eswatini National Health Research Review Board and the University of Cape Town Ethics committee. This research fulfilled the exemption criteria set by the MSF Ethics Review Board (ERB) for posteriori analyses of routinely collected clinical data and thus did not require MSF ERB review. It was conducted with permission from Micaela Serafini (Medical Director, Operational Centre Geneva, MSF).
Results
Of 11 328 TB treatment notifications in Shiselweni, the annual number declined from 2800 to 566 between 2009 and 2016 and in all age groups irrespective of HIV status (Table 1a, Figure 1). From 2009 to 2010, most cases (96.4% and 70.8%) started TB treatment at secondary care facilities and approximately half of them at primary care clinics the years thereafter (see Appendix S3, Figure S5a). The proportion of patients with unknown HIV status decreased from 10.6% in 2009 to 1.4% in 2016 (Figure S5b).
Table 1.
Temporal trends in TB notifications, overall (a) and for HIV‐associated TB cases (b)
| 2009 | 2010 | 2011 | 2012 | 2013 | 2014 | 2015 | 2016 | Total | |
|---|---|---|---|---|---|---|---|---|---|
| (a) | |||||||||
| TB notifications, overall | 2800 | 2333 | 1745 | 1316 | 963 | 914 | 691 | 566 | 11 328 |
| Healthcare level | |||||||||
| Primary | 101 (3.6) | 681 (29.2) | 921 (52.8) | 669 (50.8) | 485 (50.4) | 462 (50.5) | 354 (51.2) | 296 (52.3) | 3969 (35.0) |
| Secondary | 2699 (96.4) | 1652 (70.8) | 824 (47.2) | 647 (49.2) | 478 (49.6) | 452 (49.5) | 337 (48.8) | 270 (47.7) | 7359 (65.0) |
| HIV status | |||||||||
| Negative | 446 (15.9) | 452 (19.4) | 436 (25.0) | 342 (26.0) | 262 (27.2) | 265 (29.0) | 218 (31.5) | 170 (30.0) | 2591 (22.9) |
| Positive | 2056 (73.4) | 1660 (71.2) | 1235 (70.8) | 945 (71.8) | 690 (71.7) | 643 (70.4) | 466 (67.4) | 388 (68.6) | 8083 (71.4) |
| Missing | 298 (10.6) | 221 (9.5) | 74 (4.2) | 29 (2.2) | 11 (1.1) | 6 (0.7) | 7 (1.0) | 8 (1.4) | 654 (5.8) |
| (b) | |||||||||
| HIV‐associated TB notifications | 2056 | 1660 | 1235 | 945 | 690 | 643 | 466 | 388 | 8083 |
| Age, years (IQR) (n missing = 30) | 32 (26–40) | 31 (24–41) | 33 (26–42) | 32.5 (26–42) | 34 (28–43) | 33 (28–40) | 33 (28–41) | 34 (28–40) | 32 (26–41) |
| Sex | |||||||||
| Females | 1130 (55.0) | 915 (55.1) | 645 (52.2) | 474 (50.2) | 323 (46.8) | 300 (46.7) | 222 (47.6) | 175 (45.1) | 4184 (51.8) |
| Males | 926 (45.0) | 745 (44.9) | 590 (47.8) | 471 (49.8) | 367 (53.2) | 343 (53.3) | 244 (52.4) | 213 (54.9) | 3899 (48.2) |
| Male/female ratio | 0.82 | 0.81 | 0.91 | 0.99 | 1.14 | 1.14 | 1.10 | 1.22 | 0.93 |
| TB site | |||||||||
| Pulmonary | 1745 (84.9) | 1459 (87.9) | 1098 (88.9) | 824 (87.2) | 578 (83.8) | 521 (81.0) | 410 (88.0) | 334 (86.1) | 6969 (86.2) |
| Extra‐pulmonary | 303 (14.7) | 194 (11.7) | 134 (10.9) | 119 (12.6) | 106 (15.4) | 120 (18.7) | 55 (11.8) | 53 (13.7) | 1084 (13.4) |
| Missing | 8 (0.4) | 7 (0.4) | 3 (0.2) | 2 (0.2) | 6 (0.9) | 2 (0.3) | 1 (0.2) | 1 (0.3) | 30 (0.4) |
| TB classification | |||||||||
| New case | 1709 (83.1) | 1377 (83.0) | 1076 (87.1) | 861 (91.1) | 626 (90.7) | 577 (89.7) | 407 (87.3) | 347 (89.4) | 6980 (86.4) |
| Recurrent case | 334 (16.2) | 275 (16.6) | 151 (12.2) | 80 (8.5) | 64 (9.3) | 63 (9.8) | 57 (12.2) | 41 (10.6) | 1065 (13.2) |
| Missing | 13 (0.6) | 8 (0.5) | 8 (0.6) | 4 (0.4) | 0 (0.0) | 3 (0.5) | 2 (0.4) | 0 (0.0) | 38 (0.5) |
| TB treatment type | |||||||||
| First line | 2043 (99.4) | 1641 (98.9) | 1201 (97.2) | 890 (94.2) | 650 (94.2) | 601 (93.5) | 420 (90.1) | 358 (92.3) | 7804 (96.5) |
| Second line* | 13 (0.6) | 19 (1.1) | 34 (2.8) | 55 (5.8) | 40 (5.8) | 42 (6.5) | 46 (9.9) | 30 (7.7) | 279 (3.5) |
| Bacteriologic status | |||||||||
| Positive | 720 (35.0) | 475 (28.6) | 385 (31.2) | 449 (47.5) | 413 (59.9) | 407 (63.3) | 368 (79.0) | 317 (81.7) | 3534 (43.7) |
| Negative | 1033 (50.2) | 753 (45.4) | 571 (46.2) | 355 (37.6) | 176 (25.5) | 125 (19.4) | 56 (12.0) | 47 (12.1) | 3116 (38.6) |
| Missing | 303 (14.7) | 432 (26.0) | 279 (22.6) | 141 (14.9) | 101 (14.6) | 111 (17.3) | 42 (9.0) | 24 (6.2) | 1433 (17.7) |
| Time of HIV diagnosis, days | |||||||||
| ≥91 days before TB treatment | 651 (31.7) | 523 (31.5) | 339 (27.4) | 322 (34.1) | 244 (35.4) | 258 (40.1) | 198 (42.5) | 170 (43.8) | 2705 (33.5) |
| 90–1 days before TB treatment | 827 (40.2) | 591 (35.6) | 489 (39.6) | 369 (39.0) | 291 (42.2) | 257 (40.0) | 175 (37.6) | 139 (35.8) | 3138 (38.8) |
| During TB treatment | 535 (26.0) | 462 (27.8) | 336 (27.2) | 207 (21.9) | 115 (16.7) | 100 (15.6) | 60 (12.9) | 59 (15.2) | 1874 (23.2) |
| Missing† | 43 (2.1) | 84 (5.1) | 71 (5.7) | 47 (5.0) | 40 (5.8) | 28 (4.4) | 33 (7.1) | 20 (5.2) | 366 (4.5) |
| Time of ART initiation, days | |||||||||
| ≥91 days before TB treatment | 277 (13.5) | 268 (16.1) | 203 (16.4) | 195 (20.6) | 173 (25.1) | 166 (25.8) | 147 (31.5) | 138 (35.6) | 1567 (19.4) |
| 90–1 days before TB treatment | 236 (11.5) | 160 (9.6) | 167 (13.5) | 124 (13.1) | 119 (17.2) | 100 (15.6) | 60 (12.9) | 63 (16.2) | 1029 (12.7) |
| During TB treatment | 330 (16.1) | 470 (28.3) | 484 (39.2) | 450 (47.6) | 264 (38.3) | 285 (44.3) | 186 (39.9) | 149 (38.4) | 2618 (32.4) |
| Missing | 1213 (59.0) | 762 (45.9) | 381 (30.9) | 176 (18.6) | 134 (19.4) | 92 (14.3) | 73 (15.7) | 38 (9.8) | 2869 (35.5) |
| Time of cotrimoxazole initiation, days | |||||||||
| ≥91 days before TB treatment | 244 (11.9) | 225 (13.6) | 166 (13.4) | 198 (21.0) | 163 (23.6) | 179 (27.8) | 122 (26.2) | 135 (34.8) | 1432 (17.7) |
| 90–1 days before TB treatment | 350 (17.0) | 293 (17.7) | 301 (24.4) | 276 (29.2) | 245 (35.5) | 215 (33.4) | 136 (29.2) | 125 (32.2) | 1941 (24.0) |
| During TB treatment | 1224 (59.5) | 837 (50.4) | 525 (42.5) | 277 (29.3) | 146 (21.2) | 135 (21.0) | 93 (20.0) | 85 (21.9) | 3322 (41.1) |
| Missing | 238 (11.6) | 305 (18.4) | 243 (19.7) | 194 (20.5) | 136 (19.7) | 114 (17.7) | 115 (24.7) | 43 (11.1) | 1388 (17.2) |
ART, antiretroviral therapy; IQR, interquartile range.
Second line TB treatment cases were patients who received a treatment regimen for mono‐resistance, poly‐resistance, multidrug resistance or extensive drug resistance TB.
These patients had a confirmed HIV‐positive status but the date of diagnosis was unknown.
Figure 1.
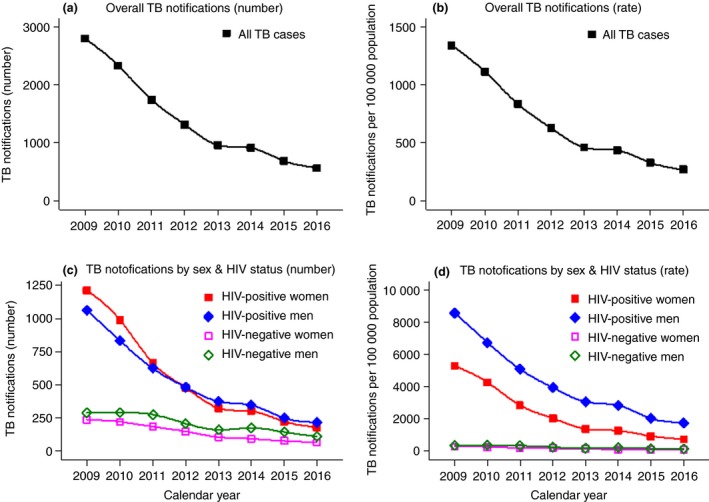
Temporal trends in TB notifications (absolute numbers vs. rates), overall and stratified by sex and HIV status. [Colour figure can be viewed at http://wileyonlinelibrary.com]
Trends in HIV‐associated TB notifications (cohort level)
Of 8083 HIV co‐infected TB cases, the annual number declined from 2056 to 388 between 2009 and 2016 (Table 1b, Figure 1). The median age was 32 (interquartile range [IQR] 26–41) years, 86.2% had pulmonary TB, and 86.4% were new treatment cases without significant variations over time. The male‐to‐female ratio increased from 0.82 to 1.22 between 2008 and 2016, corresponding to 45.0% and 54.9% males, respectively. During the phase‐out of smear‐microscopy testing and phase‐in of Xpert testing in 2012 (see Appendix S3, Figure S6), bacteriologically confirmed TB increased from 35.0% in 2009 to 81.7% in 2016 while proportionally fewer had missing bacteriologic (14.7% vs. 6.2) status, respectively (Figure S5c). In 2009, 0.6% of patients started a second‐line TB drug treatment regimen compared with 7.7% in 2016 (Figure S5d). The proportion of patients diagnosed as HIV‐positive ≥91 days before starting TB treatment increased from 31.7% to 43.8% between 2009 and 2016. Regarding the timing of cotrimoxazole prophylaxis and ART initiation in relation to TB treatment and considering the same time period, the proportion of patients receiving cotrimoxazole prophylaxis ≥91 days before starting TB treatment increased from 11.9% to 34.8%, and the proportion of patients receiving ART before TB treatment increased from 13.5% to 35.6%, respectively (Figure S5e,f). Of note, 59.0% of patients had missing ART status in 2009 vs. 9.8% in 2016.
Patient‐level predictors of HIV‐associated TB
All TB notification data (n = 11 328; 10 imputed datasets) were used in multivariate logistic regression analysis (Table 2). The multiple imputation diagnostic was satisfied (see Appendix S2, Figure S3–S4). The probability of being an HIV‐positive TB treatment case fell in all years from 2011 (adjusted odds ratio [aOR] 0.69, 95% confidence interval [CI]: 0.58–0.83) to 2016 (aOR 0.54, 0.43–0.69) (vs. 2009), in the age groups ≤29 and ≥40 years old (vs. 35–39 years) and in males (aOR 0.65, 0.59–0.72). The probability was higher for secondary healthcare level (aOR 1.18, 1.06–1.33), recurrent TB (aOR 1.40, 1.19–1.65) and negative (aOR 1.31, 1.15–1.49) or missing (aOR 1.30, 1.11–1.53) bacteriologic status. No differences were detected for TB site and treatment regimen.
Table 2.
Baseline characteristics and uni‐ and multivariate associations with HIV among all patients with TB
| Baseline characteristics of TB cases (n = 10 674)† | Predictors of HIV‐associated TB (n = 11 328)§ | ||||||
|---|---|---|---|---|---|---|---|
| HIV‐negative | HIV‐positive | OR | 95% CI | aOR | 95% CI | ||
| Total number (missing = 654)† | 2591 | 8083 | |||||
| Calendar year | |||||||
| 2009 | 446 (17.2) | 2056 (25.4) | <0.001 | 1 | 1 | ||
| 2010 | 452 (17.4) | 1660 (20.5) | 0.82 | (0.70–0.94) | 0.92 | (0.78–1.09) | |
| 2011 | 436 (16.8) | 1235 (15.3) | 0.64 | (0.55–0.74) | 0.69 | (0.58–0.83) | |
| 2012 | 342 (13.2) | 945 (11.7) | 0.62 | (0.52–0.72) | 0.71 | (0.59–0.86) | |
| 2013 | 262 (10.1) | 690 (8.5) | 0.60 | (0.50–0.72) | 0.70 | (0.57–0.86) | |
| 2014 | 265 (10.2) | 643 (8.0) | 0.55 | (0.46–0.66) | 0.53 | (0.43–0.65) | |
| 2015 | 218 (8.4) | 466 (5.8) | 0.49 | (0.40–0.59) | 0.53 | (0.42–0.66) | |
| 2016 | 170 (6.6) | 388 (4.8) | 0.52 | (0.43–0.64) | 0.54 | (0.43–0.69) | |
| Healthcare level | |||||||
| Primary | 1148 (44.3) | 2698 (33.4) | <0.001 | 1 | 1 | ||
| Secondary | 1443 (55.7) | 5385 (66.6) | 1.57 | (1.43–1.71) | 1.18 | (1.06–1.33) | |
| Sex | |||||||
| Females | 1060 (40.9) | 4184 (51.8) | <0.001 | 1 | 1 | ||
| Males | 1531 (59.1) | 3899 (48.2) | 0.65 | (0.60–0.71) | 0.65 | (0.59–0.72) | |
| Age, years (missing = 30) | |||||||
| 0–4 | 260 (3.2) | 481 (4.5) | <0.001 | 0.11 | (0.08–0.14) | 0.08 | (0.06–0.11) |
| 5–9 | 226 (2.8) | 327 (3.1) | 0.20 | (0.14–0.27) | 0.16 | (0.11–0.22) | |
| 10–14 | 213 (2.6) | 305 (2.9) | 0.21 | (0.15–0.28) | 0.17 | (0.12–0.23) | |
| 15–19 | 173 (2.1) | 407 (3.8) | 0.07 | (0.05–0.09) | 0.06 | (0.05–0.08) | |
| 20–24 | 720 (8.9) | 1022 (9.6) | 0.21 | (0.17–0.27) | 0.19 | (0.15–0.24) | |
| 25–29 | 1460 (18.1) | 1701 (16.0) | 0.54 | (0.42–0.69) | 0.49 | (0.38–0.63) | |
| 30–34 | 1538 (19.1) | 1696 (16.0) | 0.86 | (0.66–1.12) | 0.85 | (0.65–1.11) | |
| 35–39 | 1166 (14.5) | 1268 (11.9) | 1 | 1 | |||
| 40–45 | 771 (9.6) | 887 (8.3) | 0.59 | (0.45–0.78) | 0.56 | (0.43–0.75) | |
| 45–49 | 512 (6.4) | 629 (5.9) | 0.39 | (0.30–0.52) | 0.38 | (0.29–0.51) | |
| 50–54 | 385 (4.8) | 517 (4.9) | 0.26 | (0.20–0.35) | 0.26 | (0.20–0.35) | |
| 55–59 | 251 (3.1) | 398 (3.7) | 0.15 | (0.12–0.21) | 0.15 | (0.11–0.21) | |
| ≥60 | 378 (4.7) | 986 (9.3) | 0.06 | (0.04–0.07) | 0.05 | (0.04–0.06) | |
| TB site (missing = 30) | |||||||
| Pulmonary | 2285 (88.4) | 6969 (86.5) | 0.013 | 1 | 1 | ||
| Extra‐pulmonary* | 299 (11.6) | 1084 (13.5) | 1.19 | (1.04–1.36) | 1.06 | (0.91–1.24) | |
| TB classification (missing = 38) | |||||||
| New case | 2345 (90.9) | 6980 (86.8) | <0.001 | 1 | 1 | ||
| Recurrent case | 234 (9.1) | 1065 (13.2) | 1.50 | (1.30–1.74) | 1.40 | (1.19–1.65) | |
| Bacteriologic status | |||||||
| Positive | 1197 (46.2) | 3534 (43.7) | <0.001 | 1 | 1 | ||
| Negative | 840 (32.4) | 3116 (38.6) | 1.25 | (1.13–1.39) | 1.31 | (1.15–1.49) | |
| Missing | 554 (21.4) | 1433 (17.7) | 0.85 | (0.75–0.95) | 1.30 | (1.11–1.53) | |
| TB treatment type | |||||||
| First line | 2516 (97.1) | 7804 (96.5) | 0.168 | 1 | 1 | ||
| Second line‡ | 75 (2.9) | 279 (3.5) | 1.21 | (0.93–1.56) | 1.16 | (0.86–1.56) | |
OR, odds ratio from univariate analysis; aOR, adjusted odds ratio from multivariate analysis; CI, confidence interval.
Patients diagnosed with both pulmonary and extra‐pulmonary TB are counted under extra‐pulmonary TB.
Among all patients (n = 11 328), 654 (5.8%) had missing HIV status and were not included in description of baseline characteristics.
Second line TB treatment cases were patients who received a treatment regimen for mono‐resistance, poly‐resistance, multidrug resistance or extensive drug resistance TB.
Missing values of HIV status, age, TB site and TB classification were imputed into 10 datasets. Thus all observations (n = 11 328) were used in multivariate logistic regression analysis.
Population‐level trends in TB notification
Population‐level adjusted TB notification rates per 100 000 person‐years are presented in Appendix S3, Table S1–S2. The overall TB notification rate decreased fivefold between 2009 and 2016, from 1341 to 269 per 100 000 person‐years (Figure 1a,b). The decline was more pronounced in females (sixfold) than males (4.2‐fold) and more pronounced in PLHIV (sixfold) than in the HIV‐negative population (threefold). The decline was 7.2‐ and 4.9‐fold for HIV‐positive females and males vs. 3.6‐ and 2.7‐fold for HIV‐negative females and males, respectively (Figure 1c,d).
Figure 2a–d shows that TB notifications declined in all age groups and irrespective of HIV status. TB notifications were highest in middle‐aged females, while they also remained high for older males. For the HIV‐negative population, TB notifications steadily increased with age while a U‐shaped pattern was seen for HIV‐positive cases in the early years, with higher notification rates in the younger and older age groups. Although PLHIV sustained higher notification rates for all ages, the age pattern of the combined year 2015–2016 was similar to the HIV‐negative population with notification rates steadily increasing with age.
Figure 2.
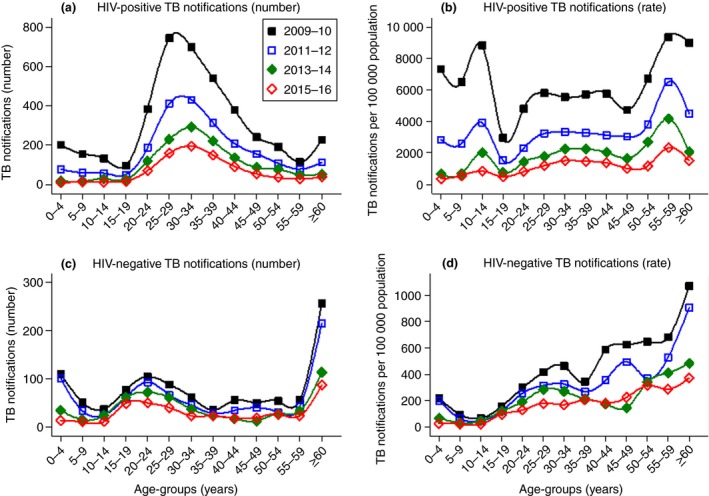
Age‐stratified temporal trends in TB notifications (absolute numbers vs. rates) for HIV‐positive and HIV‐negative cases. [Colour figure can be viewed at http://wileyonlinelibrary.com]
Population‐level predictors of TB
In both models, men had an approximately 1.8‐fold increased risk of TB. Compared with 35‐ to 39‐year‐olds, younger age (≤19 years) decreased the risk of TB while older age (≥55 years) increased it. In Model‐1 (see Appendix S3, Table S3), an HIV‐positive status (irrespective of ART) increased the risk of TB by 19.5 times (adjusted incidence risk ratio [aIRR] 19.47, 95% CI: 14.89–25.46). In Model‐2 (see Appendix S3, Table S4), the risk was 5.3 times higher in PLHIV on ART (aIRR 5.30, 3.94–7.12) and 12.3 times higher in PLHIV not on ART (aIRR 12.26, 9.07–16.56).
In both models, calendar year interacted with HIV/ART status. Comparing 2016 with 2009 in Model‐1, the effect of calendar year on declining TB was higher in PLHIV (aIRR 0.13, 95% CI: 0.10–0.17) than in HIV‐negative people (aIRR 0.32, 0.24–0.44) (Figure 3a). In Model‐2, the year 2016 (vs. 2009) had the most pronounced protective effect for PLHIV not on ART (aIRR 0.15, 0.10–0.20), followed by HIV‐negative people (aIRR 0.27, 0.20–0.37) and by PLHIV on ART (aIRR 0.50, 0.36–0.70), while the effect of calendar year was similar for the years 2010 to 2012 (Figure 3b).
Figure 3.
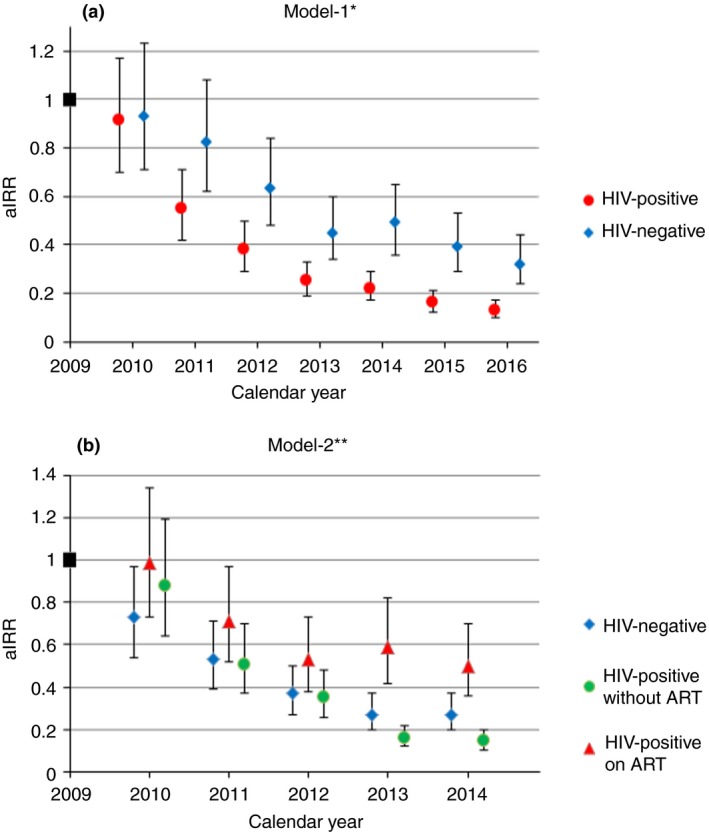
The effect of calendar year on TB notifications in Model‐1 (a) and Model‐2 (b). aIRR, adjusted incidence risk ratio. *Model‐1 considered the entire study period adjusted for the population‐level covariates sex, age and HIV status. **Model‐2 combined HIV status and ART status into one covariate with three categories (HIV‐negative case, PLHIV on ART, PLHIV without ART), but was restricted to the years from 2009 to 2014 as reliable stratified ART coverage estimates were not available for the time period thereafter. [Colour figure can be viewed at http://wileyonlinelibrary.com]
ART coverage trends and declining TB from 2008 to 2016
The TB notification rate was 1078 cases per 100 000 population in 2008 22, and the peak was in 2009 (Figure 4). ART coverage increased from 22.0% (n = 7766) in 2009, to 55.7% (n = 20 139) in 2014 (study data), and to 82.7% in 2016 30. ART coverage was similar for both gender in 2011 (men: 36.7%; women: 35.6%) 19, 29, but point estimates tended to be higher for women in 2016 (men: 79.1%; women: 84.1%) 30. During the first year of TB decline in 2010, ART coverage was between 22.0% and 29.9%. When the pace of TB decline reduced in 2014, ART coverage was between 50.8% and 55.7%.
Figure 4.
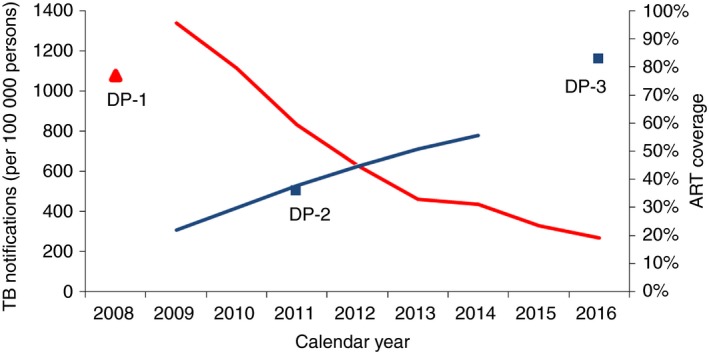
Temporal trends in TB notifications and ART coverage from 2008 to 2016. This graph combines estimates from the study (blue and red lines) and data points obtained from the annual TB report for TB notifications in 2008 [22] and from the Swaziland HIV Incidence Measurement Surveys for ART coverage in 2011 [19,29] and 2016 [30]. Blue line: ART coverage for all age groups combined. Red line: TB notification rates for all age groups combined irrespective of HIV status. DP‐1, data point 1: TB notification per 100 000 population in 2008 [22]. DP‐2, data point 2: ART coverage in ≥18 to 49‐year‐olds in 2011 [19,29]. DP‐3, data point 3: ART coverage in ≥15‐year‐olds in 2016 [30]. [Colour figure can be viewed at http://wileyonlinelibrary.com]
Discussion
We describe patient‐ and population‐level predictors and trends of HIV‐associated TB from a high HIV‐TB prevalence setting in rural Eswatini. The absolute numbers of TB cases as well as the incidence decreased rapidly over a period of 8 years for both sexes and all age groups and was most pronounced in PLHIV, coinciding with an almost fourfold increase in ART coverage, but was also seen in HIV‐uninfected patients.
Findings in context
TB notifications reached unprecedented levels in 2009, with similar trends seen in the other three regions of Eswatini 22. When the trend reversed in 2010, ART coverage was between 22% and 30% vs. 15–20% and 30–40% in peri‐urban and urban high HIV prevalence settings in South Africa 16, 18. When the pace of decline slowed down in 2014, ART coverage was between 51% and 56%. A modelling study suggested that ART programmes are needed to sustain high levels of ART adherence and good immunologic response to avert TB rebound 14. TB rebound was not detected in this setting, with viral load suppression rates in ART patients being ≥84% 26, 31.
Calendar year interacted with HIV and ART status. The protective effect of the most recent calendar year (vs. the baseline year) was most pronounced for PLHIV without ART, followed by HIV‐negative people and PLHIV on ART. First, this was possibly due to different patterns in population‐level trends of median CD4 cell counts. Previous treatment guidelines restricted ART initiation to patients with low CD4 cell counts 32, 33, possibly resulting in a higher population‐level median CD4 count for PLHIV not on ART. An increased risk of TB has been documented for PLHIV with low CD4 cell counts and during the first 4 months after ART initiation (unmasking of subclinical TB) 34, 35. In addition, ART patients may have spent a long time at low CD4 cell counts 34 and the effect of immune dysfunction persists despite treatment 7. In this setting, the overall infectious pool was largely reduced by fewer PLHIV being co‐infected with TB, which is expected to reduce infectious contacts for the HIV‐negative population, explaining the decline in HIV‐negative TB. Second, the temporal decline in TB may be due to the synergistic effect of TB and HIV programmatic achievements 13 possibly affecting the HIV‐negative population and PLHIV differently. For instance, national TB data suggested increased ART initiation and cotrimoxazole prophylaxis and reduced adverse TB treatment outcomes in co‐infected TB patients 23. The introduction of isoniazid preventive therapy for PLHIV in 2012 may also have contributed to a decline in TB cases in PLHIV in later years, although its predicted population‐level impact in hyperendemic settings is likely smaller than in intermediate TB incidence contexts 36, 37. In addition, a recent modelling study concluded that ART expansion and high ART coverage are the most important factor in southern and eastern Africa to decrease TB in the HIV‐positive population and to a lesser extent in the HIV‐negative population, while improvements in TB case detection, TB treatment success and isoniazid preventive therapy play no or only a minor role 38. In fact, the decline in active TB disease coincided with an unprecedented population‐level impact of the HIV programme in the study area. In 2016, 91.3% of PLHIV were aware of their HIV‐positive status, 82.7% of PLHIV accessed ART and 79.1% of PLHIV were virally suppressed 30.
Although PLHIV sustained an increased risk of active TB disease in this study, TB as an entry point into HIV care became less significant in recent years. The number of HIV co‐infected TB cases decreased and proportionally more PLHIV already knew their HIV‐positive status, received cotrimoxazole and were on ART for more than 3 months when starting TB therapy.
This study suggests that national guidelines for the diagnosis and management of TB in HIV co‐infected patients were translated into routine practice. HIV‐associated TB was more likely in bacteriologically negative, extra‐pulmonary and recurrent TB cases. First, patients with advanced HIV disease are more likely to have atypical disease presentation, recurrent TB episodes and bacteriologically negative TB 7, 39, 40, 41. To avoid underdiagnoses and treatment delays for smear‐negative TB cases, clinicians followed diagnostic algorithms designed for resource‐poor, high HIV‐TB prevalence settings, allowing ambulatory empiric therapy based on clinical suspicion 24. Second, the proportion of patients with missing or negative bacteriologic status decreased over time. This was likely due to the replacement of smear‐microscopy with the Xpert MTB/RIF assay, which is a more sensitive tool in detecting TB, specifically among HIV co‐infected patients 42. Yet despite Xpert, empiric therapy continued to play a role (18% in 2016), likely due to extra‐pulmonary TB and programmatic factors, as was also reported from other settings 43, 44, 45. Third, diagnosis in secondary‐level health care was also associated with HIV‐associated TB, probably because sicker patients with HIV co‐infection were more likely to access and health workers to refer complicated cases (e.g. bacteriologically negative TB) to higher healthcare levels.
We noticed sex disparities. Despite an increase in the male‐to‐female ratio to 1.2, it remained significantly lower than the ratio of 1.7 globally 46. In addition, the probability of HIV‐associated TB was reduced in men at patient‐level but increased at population‐level. Sex disparities may be caused by an interplay of sex‐specific differences in HIV burden, access to TB services and biologic factors 47, 48. For instance, while higher HIV prevalence in women 19, 30 likely disproportionally increased their vulnerability to TB disease at population‐level prior ART expansion, women appeared to benefit more from HIV service expansion through earlier initiation of ART, better treatment outcomes and higher ART coverage 30, 49. A similar trend was reported from neighbouring KwaZulu‐Natal (South Africa) where women had a more pronounced decline in HIV/TB related deaths during the rapid roll out of ART 50. Notably, during our entire study period the male‐to‐female ratio remained lower than in low HIV prevalence settings, indicating persistent high risk of TB disease in HIV‐positive women despite high ART coverage.
Finally, the mid‐year ages (35–39 years old) were also predictive of HIV‐associated TB. This all reflects the state of the HIV epidemic, with females and middle‐aged adults having the highest HIV burden 19, 29.
Considerations for the future
HIV‐associated TB and the slow global decline of TB may jeopardise achievement of the ambitious targets of the End TB strategy 46, 51. HIV and TB programmes should continue to target populations at increased risk of TB disease and those with the most unfavourable treatment outcomes (e.g. PLHIV, children 52, 53, 54, 55). Despite this unprecedented success, the estimated TB incidence in Eswatini remained one of the highest in the world in 2016 4. In this context, the impact of further ART expansion on the TB burden remains uncertain, given a slowing of the downward trends in TB notifications at the already high ART coverage achieved. There is the need of continued focus on health system factors. We believe that decentralisation of HIV and TB services were most important to improve timely access to diagnosis and treatment in our setting. Quality of care also likely improved over time as suggested by our data (e.g. increase in bacteriologically confirmed TB cases, improved documentation) as well as TB treatment success rates 56. Although ART will likely remain the corner stone for controlling the TB epidemic in high HIV prevalence settings 38, combining a wide range of recommended strategies and interventions into routine practice appears crucial 51, 57: (i) decreasing the pool of transmittable TB through earlier detection by increased index case tracing and the use of sensitive (e.g. Xpert MTB/RIF Ultra) and point‐of‐care tests (urine lipoarabinomannan assay) 58, 59, 60, 61; (ii) reducing delays between TB detection and treatment by strengthened decentralised and integrated HIV‐TB service 57, 62; (iii) improving TB treatment outcomes with more effective and more tolerable TB treatment regimens; (iv) combining TB and HIV interventions and ART initiation at high CD4 cell counts 34; and (v) provision of extended isoniazid or other TB preventive treatment for PLHIV.
Limitations and strengths
First, this study likely underestimated TB incidence because TB treatment case notifications do not account for undiagnosed TB 63 or for pre‐treatment loss between diagnosis and treatment initiation, which can be as high as 38% 64. For instance, our electronic TB register was not linked to the presumptive TB register and the laboratory database, thus possibly missing Xpert and smear positive TB cases that have never been notified about their disease or being lost administratively before registration as a TB treatment case. Suboptimal completeness and reliability of routine TB surveillance data have also been reported from South Africa 65. On the other hand, the introduction of Xpert may have increased TB detection in culture‐positive cases 66, and some patients receiving empiric treatment may not be real TB cases 67, possibly increasing estimates. Second, the ecological study design cannot assess a possible causal relationship between ART scale‐up and population‐level decline in TB cases. We could also not account for other external factors such as changes in HIV‐TB programming and migration patterns. Specifically we could not adjust for the expansion of isoniazid preventive therapy since 2012 as data were incomplete and inconsistent. Not adjusting for it, however, could result in overestimation of the population‐level effect of ART on TB notifications in PLHIV. Finally, this analysis was restricted to the Shiselweni region of Eswatini as patient‐level data from other regions were not available.
A strength of this study was the use of stratified patient‐level data over 8 years in a predominantly rural setting. Previous studies were conducted in urban settings 5, 16, 18 and used aggregated national level data 2, 10, 17. Few studies have reported from rural settings 12, and some of those using patient‐level data 5, 16, 18 reported from the years before ART expansion beyond the 350 cells/mm3 threshold 16. Finally, we analysed both patient‐ and population‐level trends and predictors of active TB disease and could provide a comprehensive picture of trends in the TB epidemic in this resource‐poor setting.
Conclusions
This rural, high HIV‐TB prevalence setting experienced a rapid decline in TB notifications that was most pronounced in the HIV‐infected population but also saw declines in the HIV‐uninfected population. ART expansion and changes in HIV‐TB programming were likely important contributing factors. However, the TB epidemic is far from over, calling for concerted international efforts to continue ART expansion and to accelerate implementation of improved TB prevention and treatment interventions.
Supporting information
Appendix S1. TB case notifications in the wider context of Eswatini.
Figure S1. Annual absolute number of TB notifications in Eswatini from 1995 to 2016.
Figure S2. Annual TB notification rates (per 100 000 population) in the four regions of Ewatini from 2008 to 2012.
Appendix S2. Multiple imputation diagnostic.
Figure S3. Diagnostic plot for the convergence of the mean of imputed variables.
Figure S4. Diagnostic plots comparing the distributions of the observed, imputed, and completed values.
Appendix S3. Additional results.
Figure S5. Temporal trends in baseline characteristics of patients starting TB treatment in the Shiselweni region, Eswatini.
Figure S6. The phase‐out of TB smear testing (a) and the phase‐in of the Xpert MTB/RIF assay (b) for the diagnosis of TB in the Shiselweni region, Eswatini.
Table S1. Total number of TB notifications overall and stratified by sex and HIV status notification rates (per 100 000 population), and relative and absolute decline from 2009 to 2016.
Table S2. Age‐specific total number of TB notifications, overall and stratified by HIV status, and notification rates (per 100 000 population) from 2009 to 2016.
Table S3. Population‐level adjusted risk of TB notification from 2009 to 2014 (Model‐1*).
Table S4. Population‐level adjusted risk of TB notification from 2009 to 2014, taking ART coverage for sex and age group into account (Model‐2*).
Acknowledgements
We would like to thank all health workers and patients of the Shiselweni region.
References
- 1. Lawn SD, Bekker L‐G, Middelkoop K, Myer L, Wood R. Impact of HIV infection on the epidemiology of tuberculosis in a peri‐urban community in South Africa: the need for age‐specific interventions. Clin Infect Dis. 2006: 42: 1040–1047. [DOI] [PubMed] [Google Scholar]
- 2. Kanyerere H, Harries AD, Tayler‐Smith K, et al. The rise and fall of tuberculosis in Malawi: associations with HIV infection and antiretroviral therapy. Trop Med Int Health. 2016: 21: 101–107. [DOI] [PMC free article] [PubMed] [Google Scholar]
- 3. UNAIDS . UNAIDS data 2017. Joint United Nations Programme on HIV/AIDS (UNAIDS): Geneva, Switzerland; 2017. [Google Scholar]
- 4. WHO . Global Tuberculosis Report. World Health Organization: Geneva, Switzerland, 2017. [Google Scholar]
- 5. Saito S, Mpofu P, Carter EJ, et al. Implementation and operational research: Declining tuberculosis incidence among people receiving HIV care and treatment services in East Africa, 2007–2012. J Acquir Immune Defic Syndr 1999 2016;71:e96–e106. [DOI] [PMC free article] [PubMed] [Google Scholar]
- 6. Suthar AB, Lawn SD, del Amo J, et al. Antiretroviral therapy for prevention of tuberculosis in adults with HIV: a systematic review and meta‐analysis. PLoS Medicine 2012: 9: e1001270. [DOI] [PMC free article] [PubMed] [Google Scholar]
- 7. Corbett EL, Marston B, Churchyard GJ, Cock KMD. Tuberculosis in sub‐Saharan Africa: opportunities, challenges, and change in the era of antiretroviral treatment. The Lancet. 2006: 367: 926–937. [DOI] [PubMed] [Google Scholar]
- 8. Lawn SD, Wood R, De Cock KM, Kranzer K, Lewis JJ, Churchyard GJ. Antiretrovirals and isoniazid preventive therapy in the prevention of HIV‐associated tuberculosis in settings with limited health‐care resources. Lancet Infect Dis. 2010: 10: 489–498. [DOI] [PubMed] [Google Scholar]
- 9. Gupta A, Wood R, Kaplan R, Bekker L‐G, Lawn SD. Tuberculosis incidence rates during 8 years of follow‐up of an antiretroviral treatment cohort in South Africa: comparison with rates in the community. PLoS ONE 2012;7:e34156. [DOI] [PMC free article] [PubMed] [Google Scholar]
- 10. Takarinda KC, Harries AD, Sandy C, Mutasa‐Apollo T, Zishiri C. Declining tuberculosis case notification rates with the scale‐up of antiretroviral therapy in Zimbabwe. Public Health Action. 2016: 6: 164–168. [DOI] [PMC free article] [PubMed] [Google Scholar]
- 11. Nanoo A, Izu A, Ismail NA, et al. Nationwide and regional incidence of microbiologically confirmed pulmonary tuberculosis in South Africa, 2004–12: a time series analysis. Lancet Infect Dis 2015: 15: 1066–1076. [DOI] [PubMed] [Google Scholar]
- 12. Zachariah R, Bemelmans M, Akesson A, et al. Reduced tuberculosis case notification associated with scaling up antiretroviral treatment in rural Malawi. Int J Tuberc Lung Dis. 2011: 15(7): 933–937. [DOI] [PubMed] [Google Scholar]
- 13. Chindelevitch L, Menzies NA, Pretorius C, Stover J, Salomon JA, Cohen T. Evaluating the potential impact of enhancing HIV treatment and tuberculosis control programmes on the burden of tuberculosis. J R Soc Interface 2015: 12: 20150146. [DOI] [PMC free article] [PubMed] [Google Scholar]
- 14. Dodd PJ, Knight GM, Lawn SD, Corbett EL, White RG. Predicting the long‐term impact of antiretroviral therapy scale‐up on population incidence of tuberculosis. PLoS ONE 2013: 8: e75466. [DOI] [PMC free article] [PubMed] [Google Scholar]
- 15. Williams BG, Granich R, De Cock KM, Glaziou P, Sharma A, Dye C. Antiretroviral therapy for tuberculosis control in nine African countries. Proc Natl Acad Sci USA 2010: 107: 19485–9. [DOI] [PMC free article] [PubMed] [Google Scholar]
- 16. Middelkoop K, Bekker L‐G, Myer L, et al. Antiretroviral therapy and TB notification rates in a high HIV prevalence South African community. J Acquir Immune Defic Syndr 1999 2011: 56: 263–269. [DOI] [PMC free article] [PubMed] [Google Scholar]
- 17. Haumba S, Dlamini T, Calnan M, et al. Declining tuberculosis notification trend associated with strengthened TB and expanded HIV care in Swaziland. Public Health Action 2015: 5: 103–105. [DOI] [PMC free article] [PubMed] [Google Scholar]
- 18. Hermans S, Boulle A, Caldwell J, Pienaar D, Wood R. Temporal trends in TB notification rates during ART scale‐up in Cape Town: an ecological analysis. J Int AIDS Soc 2015: 18. [DOI] [PMC free article] [PubMed] [Google Scholar]
- 19. Bicego GT, Nkambule R, Peterson I, et al. Recent patterns in population‐based HIV prevalence in Swaziland. PLoS ONE 2013: 8: e77101. [DOI] [PMC free article] [PubMed] [Google Scholar]
- 20. World Health Organization . Global Tuberculosis Report 2013. World Health Organization: Geneva, Switzerland, 2013. [Google Scholar]
- 21. CSO . Swaziland Population Census. Central Statistical Office (CSO): Mbabane, Swaziland, 2009. [Google Scholar]
- 22. Ministry of Health . TB Program Annual Report 2012. Ministry of Health: Swaziland, Mbabane, 2013. [Google Scholar]
- 23. Mchunu G, van Griensven J, Hinderaker SG, et al. High mortality in tuberculosis patients despite HIV interventions in Swaziland. Public Health Action. 2016: 6: 105–110. [DOI] [PMC free article] [PubMed] [Google Scholar]
- 24. WHO . Improving the diagnosis and treatment of smear‐negative pulmonary and extrapulmonary tuberculosis among adults and adolescents: recommendations for HIV‐prevalent and resource‐constrained settings. World Health Organization: Geneva, Switzerland, 2006. [Google Scholar]
- 25. Parker LA, Jobanputra K, Okello V, et al. Barriers and facilitators to combined ART initiation in pregnant women with HIV: lessons learnt from a PMTCT B+ pilot program in Swaziland. JAIDS. J Acquir Immune Defic Syndr 2015: 69: e24–30. [DOI] [PMC free article] [PubMed] [Google Scholar]
- 26. Etoori D, Kerschberger B, Staderini N, et al. Challenges and successes in the implementation of option B+ to prevent mother‐to‐child transmission of HIV in southern Swaziland. BMC Public Health 2018: 18: 374. [DOI] [PMC free article] [PubMed] [Google Scholar]
- 27. White IR, Royston P, Wood AM. Multiple imputation using chained equations: Issues and guidance for practice. Stat Med. 2011: 30: 377–399. [DOI] [PubMed] [Google Scholar]
- 28. Central Statistical Office . Swaziland Demographic and Health Survey 2006–07. Central Statistical Office: Mbabane, Swaziland, 2007. [Google Scholar]
- 29. Blaizot S, Riche B, Ecochard R. Potential Impact of Multiple Interventions on HIV Incidence in Shiselweni Region (Swaziland): A Modelling Study. Epicentre, Médecins Sans Frontières: Lyon, France, 2016. [Google Scholar]
- 30. Ministry of Health of Eswatini . Swaziland HIV Incidence Measurement Survey 2 (SHIMS2) 2016–2017. Final Report. Ministry of Health of Eswatini: Mbabane, Eswatini; 2019. [Google Scholar]
- 31. Jobanputra K, Parker LA, Azih C, et al. Factors associated with virological failure and suppression after enhanced adherence counselling, in children, adolescents and adults on antiretroviral therapy for HIV in Swaziland. PLoS ONE 2015: 10: e0116144. [DOI] [PMC free article] [PubMed] [Google Scholar]
- 32. World Health Organization , Gilks C, Vitória M. Antiretroviral Therapy for HIV Infection in Adults and Adolescents: Recommendations for a Public Health Approach. World Health Organization: Geneva, Switzerland, 2006. [Google Scholar]
- 33. World Health Organization . Consolidated Guidelines on the Use of Antiretroviral Drugs for Treating and Preventing HIV Infection: Recommendations for a Public Health Approach. World Health Organization: Geneva, Switzerland, 2013. [PubMed] [Google Scholar]
- 34. Lawn SD, Myer L, Edwards D, Bekker L‐G, Wood R. Short‐term and long‐term risk of tuberculosis associated with CD4 cell recovery during antiretroviral therapy in South Africa. AIDS 2009: 23: 1717–1725. [DOI] [PMC free article] [PubMed] [Google Scholar]
- 35. Lawn SD, Wilkinson RJ, Lipman MCI, Wood R. Immune reconstitution and “unmasking” of tuberculosis during antiretroviral therapy. Am J Respir Crit Care Med 2008: 177: 680–685. [DOI] [PMC free article] [PubMed] [Google Scholar]
- 36. Guwatudde D, Debanne SM, Diaz M, King C, Whalen CC. A re‐examination of the potential impact of preventive therapy on the public health problem of tuberculosis in contemporary sub‐Saharan Africa. Prev Med 2004: 39: 1036–1046. [DOI] [PMC free article] [PubMed] [Google Scholar]
- 37. Ragonnet R, Trauer JM, McBryde ES, et al. Is IPT more effective in high‐burden settings? Modelling the effect of tuberculosis incidence on IPT impact. Int J Tuberc Lung Dis 2017: 21: 60–66. [DOI] [PMC free article] [PubMed] [Google Scholar]
- 38. Dye C, Williams BG. Tuberculosis decline in populations affected by HIV: a retrospective study of 12 countries in the WHO African Region. Bull World Health Organ. 2019: 97: 405–414. [DOI] [PMC free article] [PubMed] [Google Scholar]
- 39. Unis G, Ribeiro AW, Esteves LS, et al. Tuberculosis recurrence in a high incidence setting for HIV and tuberculosis in Brazil. BMC Infect Dis 2014: 14. [DOI] [PMC free article] [PubMed] [Google Scholar]
- 40. Houben RMGJ, Glynn JR, Mboma S, et al. The impact of HIV and ART on recurrent tuberculosis in a sub‐Saharan setting. AIDS Lond Engl. 2012: 26: 2233–2239. [DOI] [PubMed] [Google Scholar]
- 41. Moodley Y, Govender K. A systematic review of published literature describing factors associated with tuberculosis recurrence in people living with HIV in Africa. Afr Health Sci. 2015: 15: 1239–1246. [DOI] [PMC free article] [PubMed] [Google Scholar]
- 42. Boehme CC, Nicol MP, Nabeta P, et al. Feasibility, diagnostic accuracy, and effectiveness of decentralised use of the Xpert MTB/RIF test for diagnosis of tuberculosis and multidrug resistance: a multicentre implementation study. Lancet 2011: 377: 1495–1505. [DOI] [PMC free article] [PubMed] [Google Scholar]
- 43. Chawla KS, Kanyama C, Mbewe A, et al. Policy to practice: impact of GeneXpert MTB/RIF implementation on the TB spectrum of care in Lilongwe, Malawi. Trans R Soc Trop Med Hyg 2016: 110: 305–311. [DOI] [PMC free article] [PubMed] [Google Scholar]
- 44. Hanrahan CF, Selibas K, Deery CB, et al. Time to treatment and patient outcomes among TB suspects screened by a single point‐of‐care Xpert MTB/RIF at a primary care clinic in Johannesburg, South Africa. PLoS ONE 2013: 8: e65421. [DOI] [PMC free article] [PubMed] [Google Scholar]
- 45. Peter JG, Theron G, Pooran A, Thomas J, Pascoe M, Dheda K. Comparison of two methods for acquisition of sputum samples for diagnosis of suspected tuberculosis in smear‐negative or sputum‐scarce people: a randomised controlled trial. Lancet Respir Med 2013: 1(6): 471–478. [DOI] [PMC free article] [PubMed] [Google Scholar]
- 46. Floyd K, Glaziou P, Zumla A, Raviglione M. The global tuberculosis epidemic and progress in care, prevention, and research: an overview in year 3 of the End TB era. Lancet Respir Med 2018: 6: 299–314. [DOI] [PubMed] [Google Scholar]
- 47. Neyrolles O, Quintana‐Murci L. Sexual inequality in tuberculosis. PLoS Medicine 2009: 6: 12. [DOI] [PMC free article] [PubMed] [Google Scholar]
- 48. Horton KC, MacPherson P, Houben RMGJ, White RG, Corbett EL. Sex differences in tuberculosis burden and notifications in low‐ and middle‐income countries: a systematic review and meta‐analysis. PLoS Med 2016: 13: e1002119. [DOI] [PMC free article] [PubMed] [Google Scholar]
- 49. Kerschberger B, Schomaker M, Ciglenecki I, et al. Programmatic outcomes and impact of rapid public sector antiretroviral therapy expansion in adults prior to introduction of the WHO treat‐all approach in rural Eswatini. Trop Med Int Health. 2019: 24: 701–714. [DOI] [PMC free article] [PubMed] [Google Scholar]
- 50. Bor J, Rosen S, Chimbindi N, et al. Mass HIV treatment and sex disparities in life expectancy: demographic surveillance in rural South Africa. PLoS Medicine 2015: 12: e1001905. [DOI] [PMC free article] [PubMed] [Google Scholar]
- 51. WHO . The End TB strategy [Internet]. World Health Organization: Geneva, Switzerland, 2015. [Google Scholar]
- 52. Ali SA, Mavundla TR, Fantu R, Awoke T. Outcomes of TB treatment in HIV co‐infected TB patients in Ethiopia: a cross‐sectional analytic study. BMC Infect Dis 2016: 16. [DOI] [PMC free article] [PubMed] [Google Scholar]
- 53. Takarinda KC, Sandy C, Masuka N, et al. Factors associated with mortality among patients on TB treatment in the Southern Region of Zimbabwe, 2013. Tuberc Res Treat 2017: 2017: 6232071. [DOI] [PMC free article] [PubMed] [Google Scholar]
- 54. Babatunde OI, Christiandolus EO, Bismarck EC, Emmanuel OI, Chike AC, Gabriel EI. Five years retrospective cohort analysis of treatment outcomes of TB‐HIV patients at a PEPFAR/DOTS Centre in South Eastern Nigeria. Afr Health Sci 2016: 16: 655–662. [DOI] [PMC free article] [PubMed] [Google Scholar]
- 55. Nglazi MD, Bekker L‐G, Wood R, Kaplan R. The impact of HIV status and antiretroviral treatment on TB treatment outcomes of new tuberculosis patients attending co‐located TB and ART services in South Africa: a retrospective cohort study. BMC Infect Dis 2015: 15: 536. [DOI] [PMC free article] [PubMed] [Google Scholar]
- 56. Kerschberger B, Telnov A, Mafukidze A, Kabore SM. Successful decentralization of TB care but high mortality among HIV co‐infected patients in the rural Shiselweni region, Swaziland. In Barcelona, Spain, 2014.
- 57. Gilbert JA, Long EF, Brooks RP, et al. Integrating community‐based interventions to reverse the convergent TB/HIV epidemics in rural South Africa. PLoS ONE 2015: 10: e0126267. [DOI] [PMC free article] [PubMed] [Google Scholar]
- 58. Dorman SE, Schumacher SG, Alland D, et al. Xpert MTB/RIF Ultra for detection of Mycobacterium tuberculosis and rifampicin resistance: a prospective multicentre diagnostic accuracy study. Lancet Infect Dis 2018: 18: 76–84. [DOI] [PMC free article] [PubMed] [Google Scholar]
- 59. Kendall EA, Schumacher SG, Denkinger CM, Dowdy DW. Estimated clinical impact of the Xpert MTB/RIF Ultra cartridge for diagnosis of pulmonary tuberculosis: A modeling study. PLoS Medicine 2017: 14: e1002472. [DOI] [PMC free article] [PubMed] [Google Scholar]
- 60. Seki M, Kim C‐K, Hayakawa S, Mitarai S. Recent advances in tuberculosis diagnostics in resource‐limited settings. Eur J Clin Microbiol Infect Dis 2018: 37: 1405–1410. [DOI] [PubMed] [Google Scholar]
- 61. WHO . The use of lateral flow urine lipoarabinomannan assay (LF‐LAM) for the diagnosis and screening of active tuberculosis in people living with HIV: policy guidance. World Health Organization: Geneva, Switzerland, 2015. [Google Scholar]
- 62. Kerschberger B, Hilderbrand K, Boulle AM, et al. The effect of complete integration of HIV and TB services on time to initiation of antiretroviral therapy: a before‐after study. PLoS ONE 2012: 7: e46988. [DOI] [PMC free article] [PubMed] [Google Scholar]
- 63. Gupta RK, Lucas SB, Fielding KL, Lawn SD. Prevalence of tuberculosis in post‐mortem studies of HIV‐infected adults and children in resource‐limited settings: a systematic review and meta‐analysis. AIDS Lond Engl 2015: 29: 1987–2002. [DOI] [PMC free article] [PubMed] [Google Scholar]
- 64. MacPherson P, Houben RM, Glynn JR, Corbett EL, Kranzer K. Pre‐treatment loss to follow‐up in tuberculosis patients in low‐ and lower‐middle‐income countries and high‐burden countries: a systematic review and meta‐analysis. Bull World Health Organ 2014: 92: 126–138. [DOI] [PMC free article] [PubMed] [Google Scholar]
- 65. Podewils LJ, Bantubani N, Bristow C, et al. Completeness and reliability of the republic of South Africa national tuberculosis (TB) surveillance system. BMC Public Health 2015: 15: 765. [DOI] [PMC free article] [PubMed] [Google Scholar]
- 66. Steingart KR, Schiller I, Horne DJ, Pai M, Boehme CC, Dendukuri N. Xpert® Mtb/Rif assay for pulmonary tuberculosis and rifampicin resistance in adults. Cochrane Database Syst Rev 2014: (1): 1–166. [DOI] [PMC free article] [PubMed] [Google Scholar]
- 67. Buyego P, Nakiyingi L, Ddungu H, et al. Possible misdiagnosis of HIV associated lymphoma as tuberculosis among patients attending Uganda Cancer Institute. AIDS Res Ther 2017: 14: 13. [DOI] [PMC free article] [PubMed] [Google Scholar]
Associated Data
This section collects any data citations, data availability statements, or supplementary materials included in this article.
Supplementary Materials
Appendix S1. TB case notifications in the wider context of Eswatini.
Figure S1. Annual absolute number of TB notifications in Eswatini from 1995 to 2016.
Figure S2. Annual TB notification rates (per 100 000 population) in the four regions of Ewatini from 2008 to 2012.
Appendix S2. Multiple imputation diagnostic.
Figure S3. Diagnostic plot for the convergence of the mean of imputed variables.
Figure S4. Diagnostic plots comparing the distributions of the observed, imputed, and completed values.
Appendix S3. Additional results.
Figure S5. Temporal trends in baseline characteristics of patients starting TB treatment in the Shiselweni region, Eswatini.
Figure S6. The phase‐out of TB smear testing (a) and the phase‐in of the Xpert MTB/RIF assay (b) for the diagnosis of TB in the Shiselweni region, Eswatini.
Table S1. Total number of TB notifications overall and stratified by sex and HIV status notification rates (per 100 000 population), and relative and absolute decline from 2009 to 2016.
Table S2. Age‐specific total number of TB notifications, overall and stratified by HIV status, and notification rates (per 100 000 population) from 2009 to 2016.
Table S3. Population‐level adjusted risk of TB notification from 2009 to 2014 (Model‐1*).
Table S4. Population‐level adjusted risk of TB notification from 2009 to 2014, taking ART coverage for sex and age group into account (Model‐2*).