

ABSTRACT
Nonalcoholic fatty liver disease (NAFLD) is the most prevalent liver disease worldwide. Obesity is a major risk factor for NAFLD and recently, low skeletal muscle mass emerged as additional risk factor for NAFLD. However, the different contributions of body mass index (BMI) to the risk of NAFLD are not yet well‐known. We therefore studied body composition and muscle function with NAFLD in an elderly population‐based study. Participants of European descent underwent dual‐energy X‐ray absorptiometry (DXA) and hepatic ultrasonography. NAFLD was defined as liver steatosis in absence of secondary causes for steatosis. Skeletal muscle index (SMI) was defined as appendicular lean mass/height2 and (pre)sarcopenia was defined using the European Working Group on Sarcopenia in Older People (EWGSOP) consensus guidelines. All analyses were stratified by sex and BMI (cut point: 25 kg/m2) and adjusted for age, weight, height, homeostasis model assessment of insulin resistance (HOMA‐IR), triglycerides, and android‐fat‐to‐gynoid‐fat ratio (AGR). We included 4609 participants, of whom 1623 had NAFLD (n = 161 normal‐weight and n = 1462 overweight). Presarcopenia and sarcopenia prevalence was low (5.9% and 4.5%, respectively) and both were not associated with NAFLD. SMI was associated with less NAFLD in normal‐weight women (OR, 0.48; 95% CI, 0.29 to 0.80). A similar association for SMI and NAFLD was seen in normal‐weight men, but significance dissipated after adjustment for AGR (OR, 0.63; 95% CI, 0.39 to 1.02). Generally, fat mass was a better predictor for NAFLD than lean mass. In particular, android fat mass was associated with all NAFLD subgroups (OR from 1.77 in overweight men to 8.34 in normal‐weight women, p max = 0.001), whereas substitution of gynoid fat mass for other body components had a significant protective association with NAFLD in every subgroup, but normal‐weight men. Likewise, AGR was the best performing predictor for NAFLD prevalence (OR from 1.97 in normal‐weight men to 4.81 in normal‐weight women, p max < 0.001). In conclusion, both high fat mass and low SMI were associated with normal‐weight NAFLD. However, fat distribution (as assessed by AGR) could best predict NAFLD prevalence. © 2019 The Authors. Journal of Bone and Mineral Research Published by Wiley Periodicals, Inc.
Keywords: STEATOSIS, LEAN MASS, SARCOPENIA, EUROPEAN, BODY COMPOSITION
Introduction
Nonalcoholic fatty liver disease (NAFLD) is the most prevalent chronic liver disease today and it parallels the epidemic of obesity and diabetes mellitus.1, 2 NAFLD constitutes a major public health threat because it leads not only to an increased risk of liver‐specific,3 but also cardiovascular, morbidity and mortality.
Obesity is strongly related to NAFLD.1 That said, certainly not all obese individuals have NAFLD and not every NAFLD patient is obese. In fact, about one in six of the NAFLD patients have a normal body mass index (BMI).4 Therefore, the accuracy of BMI as the all‐encompassing measure of adiposity is debated.5 Presence of excess (visceral) fat mass is a well‐established risk factor for NAFLD, independent of BMI.6, 7 Recently, emerging evidence suggested that low skeletal muscle mass (or presarcopenia) also contributes to the risk of NAFLD.8, 9, 10 Indeed, because skeletal muscle mass is the primary tissue responsible for insulin‐mediated glucose disposal, skeletal muscle plays an important role in glucose homeostasis and insulin resistance, which are key in the pathogenesis of NAFLD.11
However, evidence on the association between skeletal muscle mass and NAFLD predominantly originates from young Asian populations with a high BMI.9, 12 This gives room for thought whether it is a true shortage of muscle mass, or a relative excess of fat mass, or both that is associated with NAFLD. Interestingly, a recent population‐based study found that the two body components, lean body mass and fat mass, both explained the relation between BMI and mortality.13 To the best of our knowledge, there are no studies that have examined the role of both components, independent of each other, in relation to NAFLD. But considering the above, there are arguments to think that both contributions of BMI, ie, (lean) muscle mass and fat mass, are risk factors for NAFLD.
We therefore studied the independent association of the different components of the body with NAFLD, stratified by sex and BMI, in a large elderly European population. We were particularly interested in the association between skeletal muscle mass with (sarcopenia) or without (presarcopenia) loss of muscle function, and NAFLD. In addition, we assessed which body composition parameter could best predict NAFLD prevalence.
Subjects and Methods
Study population
This cross‐sectional analysis included participants from The Rotterdam Study, a large ongoing population‐based cohort of participants aged 45 years or older in the Netherlands. The design and rationale of this population‐based study have been described in detail previously.14 In short, the study commenced in 1989 and comprises three cohorts. Hepatic imaging has been part of the physical workup since 2009. There are no specific eligibility criteria for The Rotterdam Study, except for the minimum age and residential area (ZIP codes). As body composition differs among ethnicities12 and The Rotterdam Study is predominantly of European background, the low number of non‐European participants were excluded to examine a homogenous population. Ethnicity was determined using genome‐wide genotypes into HapMap CEU release 22 (build 36). The genotype data was pruned to end up with variants in linkage equilibrium and the ancestry component for each individual was estimated on the basis of the maximum likelihood using the ADMIXTURE software.14 The Rotterdam Study is approved by the institutional review board of the Erasmus MC University Medical Centre Rotterdam and by the review board of The Netherlands Ministry of Health, Welfare and Sports. Written informed consent was obtained from all participants.
Dual‐energy X‐ray absorptiometry scanning
Body components
Body components were assessed using dual‐energy X‐ray absorptiometry (DXA) scans with iDXA total body fan‐beam densitometer (GE Lunar Corp, Madison, WI, USA). All scans were analyzed using enCORE software, which divides scan results into total lean mass, total fat mass, and bone/organ mass. Total lean mass is the sum of trunk lean mass and appendicular lean mass (ALM; the sum of lean tissue from the arms and legs), and total body fat mass is the sum of android fat mass (localized around the waist), gynoid fat mass (localized around the breasts, hips, and thighs), and fat mass not otherwise specified. The latter includes mainly trunk fat mass and a small proportion of appendicular fat mass, but as this was not further specified, we refer to this remaining component as trunk fat mass. The relative proportion (or fraction) of each component to the body was expressed as percentage of total body weight. For instance, ALM‐fraction was calculated as ALM/total body weight*100.
Skeletal muscle mass
Skeletal muscle mass was estimated by the skeletal muscle index (SMI) using ALM divided by squared body height (kg/m2), to adjust for variation in skeletal size. Low SMI was defined as ≤7.25 kg/m2 in men and ≤5.67 kg/m2 in women, based on cutoff values suggested by the European Working Group on Sarcopenia in Older People (EWGSOP).15
Fat distribution
Fat distribution was assessed using the standardized android‐fat‐to‐gynoid‐fat ratio (AGR).
Presarcopenia and sarcopenia
Grip strength
Grip strength (proxy for overall muscle strength) was examined using a hydraulic hand dynamometer (Fabrication Enterprises Inc., USA). The maximum grip strength was defined as the maximum value (in kg) out of three serial attempts using the nondominant hand. EWGSOP cutoff values for low grip strength were ≤29 kg for BMI ≤24 kg/m2, ≤30 kg for BMI 24.1 to 28 kg/m2, or ≤32 kg for BMI >28 kg/m2 in men; and ≤17 kg for BMI ≤23 kg/m2, ≤17.3 kg for BMI 23.1 to 26 kg/m2, ≤18 kg for BMI 26.1 to 29 kg/m2, or ≤21 kg for BMI >29 kg/m2 in women.15
Gait speed
Gait speed (measure of physical performance)16 was examined using the GAITRite walkway (CIR Systems, Inc., Sparta, NJ, USA), a 5.79‐meter‐long electronic walkway. Again, EWGSOP cutoffs were applied for the definition of low gait speed, ie, for men: <0.65 m/s if height ≤173 cm, or <0.76 m/s if height >173 cm; and for women: <0.65 m/s if height ≤159 cm, or <0.76 m/s if height >159 cm.15
Presarcopenia and sarcopenia
Presarcopenia and sarcopenia were defined according to the EWGSOP consensus guideline.15, 17 Presarcopenia was defined as presence of low SMI, and sarcopenia as low SMI plus either low muscle strength or low physical performance.
Hepatic imaging
Hepatic steatosis
Hepatic steatosis was assessed using abdominal ultrasound (US), which was carried out by a certified and experienced technician (Ultrasonography, Hitachi HI VISION 900). Images were stored digitally. Diagnosis of steatosis was determined dichotomously as presence of a hyperechogenic liver parenchyma.18 Participants with secondary causes for steatosis were excluded from this study, ie, those with (i) excessive alcohol consumption (men >30 g/day and women >20 g/day); (ii) use of steatogenic drugs, ie, amiodarone, systemic corticosteroids, methotrexate, or tamoxifen (extracted from automated pharmacy linkage); and (iii) viral hepatitis, based on hepatitis B surface antigen and anti‐hepatitis C virus, measured by an automatic immunoassay (Roche Diagnostic GmbH, Mannheim, DE). The remainder participants with steatosis were considered to have NAFLD.
NAFLD severity
NAFLD severity was assessed using transient elastography (FibroScan®, EchoSens, Paris, France). Practical implementation of this examination has been described in detail previously.19 Liver stiffness measurements (LSM, in kilopascals [kPa]) were available for a subset of the study population (from January 2011 onward). A single operator obtained 10 serial measurements using either the M or XL‐probe dependent on the thickness of the subcutaneous fat layer. We excluded participants with (i) unreliable measurements (ie, interquartile range/median LSM >0.3 kPa and LSM ≥ 7.1 kPa)20; (ii) failure of assessment; or (iii) presence of an intracardial device. For this study, nonalcoholic steatohepatitis (NASH), or advanced NAFLD, was defined as presence of steatosis and LSM ≥ 8.0 kPa, a proxy for fibrosis.21
Biochemistry and additional covariates
Fasting blood lipids, platelet count, glucose, alanine aminotransferase (ALT), aspartate aminotransferase, and gamma‐glutamyltransferase were measured using automatic enzyme procedures (Roche Diagnostic GmbH, Mannheim, DE). Insulin was determined using an automatic immunoassay (Roche Diagnostic GmbH).
Data on demographics, physical activity, smoking behavior, educational level, and comorbid conditions were obtained during an extensive home interview. Daily energy intake in kilocalories (kcal) and alcohol intake in grams was assessed using a 389‐item semiquantitative food frequency questionnaire.22 We excluded unreliable energy consumption of <500 or >7500 kcal/day. Blood pressure measurements were obtained using two subsequent measurements in upright position. BMI was calculated as weight/height2 (kg/m2) and dichotomized into normal‐weight: <25 kg/m2 and overweight: ≥25 kg/m2.
Insulin resistance was determined using the homeostasis model assessment of insulin resistance (HOMA‐IR = fasting glucose (mmol/dL) times fasting insulin (mU/L) divided by 22.5).23 The metabolic syndrome was diagnosed when three out of five metabolic traits were present: (i) abdominal obesity, ie, waist circumference >102 cm in men and >88 cm in women; (ii) serum triglycerides ≥130 mg/dL or drug treatment for elevated triglycerides; (iii) serum high‐density lipoprotein cholesterol (HDL‐C) <40 mg/dL in men and <50 mg/dL in women or drug treatment for low HDL‐C; (iv) blood pressure ≥130/85 mm Hg or drug treatment for elevated blood pressure; (v) fasting plasma glucose ≥100 mg/dL or drug treatment for elevated blood glucose.24 Hypertension was diagnosed if either systolic (≥140 mm Hg) or diastolic (≥90 mm Hg) blood pressure was increased and/or if the participant was on antihypertensive medication. Diabetes was diagnosed as fasting glucose above 7.0 mmol/L and/or drug treatment for elevated blood glucose.
Statistical analyses
To reduce bias due to missing data, missing values were imputed using multiple imputation (fully conditioned specification). Details on this imputation process can be found in the Supporting Methods. Continuous data were presented as mean ± standard deviation (SD) or median with 25th or 75th percentile (P25 to P75). Categorical data were presented as percentage. The Chi‐square test, one‐way analyses of variance, or the Kruskal‐Wallis test were used to assess differences by strata.
Associations between body composition and NAFLD were examined using logistic regression models stratified by BMI and sex, because of the known sex differences in body composition.25 We examined the association between (i) the different body components, (ii) SMI, and (iii) (pre)sarcopenia with NAFLD. We evaluated weight, height, weight and height, BMI, and body fat fraction as adjustment for body composition using the Akaike Information Criterion (AIC).26 After evaluation, models adjusted for weight and height performed best. Moreover, without weight as factor in the model, all body components were associated with higher prevalence of NAFLD. If body fat fraction was put in the model together with ALM (or SMI), the beta for ALM could reflect two scenarios. First, the beta could reflect an increase in ALM and subsequent increase in total body weight. In this case, total body fat would increase too (as body fat fraction is set and total weight increases). Second, the beta could reflect an increase of ALM at a set weight, while body fat fraction remains the same (weight is set) and bone and organ mass hardly varies. Thus an increase of ALM would then be at the expense of trunk lean mass. The latter scenario reflects the substitution of one component of the body at the expense of another. We performed such a substitution analyses,27, 28 which is often used in nutritional epidemiology to assess the relative replacement of one nutrient by another for a given caloric intake. A similar formula can be applied to assess the relative replacement of one body component with another for a given body weight. For example:
In this example, only total fat mass (%) is not included in this formula and hence, the beta for total lean mass reflects the increase of total lean mass at the expense of total body fat mass (in % body weight).
In addition to weight and height, all analyses were adjusted for age and study cohorts as well. Potential confounding of a nested set of sociodemographic, lifestyle, and metabolic predictor variables (based on the literature2) was tested, taking potential overfitting into account.
Furthermore, to assess which parameter had the best performance for NAFLD (ie, explained more variation of the outcome and thus resulted in a better model fit), we compared SMI, ALM‐fraction, AGR, body fat fraction, (pre)sarcopenia, grip, and speed using the AIC.
To test the robustness of our conclusions we performed three sensitivity analyses. First, we explored ALM‐fraction as alternative proxy for skeletal muscle mass to facilitate comparison with previous reports.9, 10 Second, as gait speed measurements were performed on a separate day at the research facility, this measurement was missing in 32.6% of individuals. In the main analysis, we assumed that if one of both proxies for physical functioning was normal, there would be no sarcopenia. In the sensitivity analysis, we used imputed grip strength and gait speed data to reclassify sarcopenia. Third, we analyzed the association of SMI with NASH to assess whether SMI was also associated with NAFLD severity.
We checked all analyses for potential multicollinearity using the variance inflation factor. In addition we corrected for the inflated type I error that arises due to multiple testing. We applied the adapted method proposed by Sidák,29, 30 using the effective number of tests instead of the actual number of tests (n = 8). This adaptation took into account that the different body components are strongly interrelated and, hence, are not independent from each other. The corrected significance level was P < 0.010. All analyses were performed using R version 3.5.1 (R core team, Vienna, Austria).
Results
Study population
The flowchart of the study is illustrated in Fig. 1. In total, 5967 participants underwent abdominal US. We excluded 253 participants (4.2%) because of unreliable food questionnaires, missing data on DXA scans or outlier values. Second, 887 participants (15.5%) were excluded while having secondary causes for steatosis. Last, 218 participants were excluded because of non‐European background. Hence, the total number of eligible study participants was 4609. Mean age was 69.3 ± 9.2 years, 57.0% was female and mean BMI was 27.5 ± 4.2 kg/m2 (range, 15.0 to 47.2 kg/m2). Both original and imputed data of the total population are depicted in Supporting Table 1.
Figure 1.
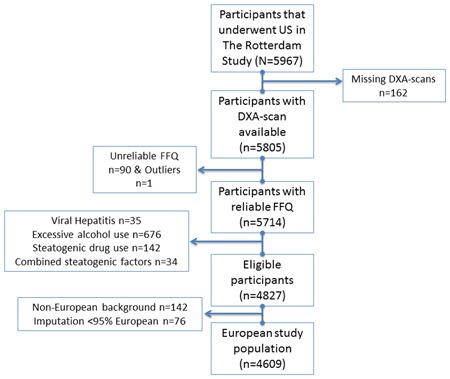
Flowchart of the study. DXA = dual‐energy X‐ray absorptiometry; FFQ = food frequency questionnaire; US = ultrasound. [Color figure can be viewed at wileyonlinelibrary.com].
NAFLD characteristics
The overall prevalence of NAFLD in this study population was 35.2% (n = 1623). Of those, 161 individuals were normal‐weight (10%) and 1462 were overweight (90%). Data on demographics, biochemistry, and comorbidities are given, stratified by BMI, in Supporting Table 2. Differences between NAFLD strata were most pronounced in the overweight group. However, ALT, gamma‐glutamyltransferase, insulin resistance, and triglycerides were significantly different in both NAFLD subgroups.
Body composition and NAFLD
Table 1 depicts the data on body composition stratified by sex and BMI. Fat mass parameters were higher in every NAFLD subgroup, whereas lean mass parameters were lower mostly in the normal‐weight NAFLD subgroups. Interestingly, ALM‐fraction was the only parameter that was lower in every NAFLD subgroup. Also, overall prevalence of presarcopenia and sarcopenia was low (5.9% and 4.5%, respectively) and not associated with NAFLD (Table 1).
Table 1.
Study Characteristics of Participants for Different NAFLD Strata
| Normal weight (n = 1339) | Overweight (n = 3270) | |||||
|---|---|---|---|---|---|---|
| Men (n = 1980) | ||||||
| No NAFLD (n = 432) | NAFLD (n = 67) | p * | No NAFLD (n = 822) | NAFLD (n = 659) | p * | |
| Height (m) | 177.0 (7.1) | 176.8 (7.8) | 0.796 | 176 (7.1) | 176 (6.9) | 0.703 |
| Weight (kg) | 72.9 (7.0) | 74.8 (7.6) | 0.041 | 86.8 (10.1) | 93.2 (12.9) | <0.001 |
| Total fat mass (kg) | 19.1 [16.5, 21.8] | 21.0 [18.6, 24.1] | <0.001 | 26.6 [23.3, 30.5] | 30.9 [26.6, 36.3] | <0.001 |
| Body fat fraction (%) | 26.0 (4.6) | 28.6 (4.3) | <0.001 | 31.4 (4.6) | 34.3 (4.6) | <0.001 |
| Android fat mass (kg) | 1.70 [1.28, 2.08] | 2.01 [1.75, 2.42] | <0.001 | 2.73 [2.21, 3.24] | 3.40 [2.82, 4.08] | <0.001 |
| Trunk/appendicular fat mass (kg) | 14.9 [12.8, 16.8] | 16.2 [14.6, 18.5] | <0.001 | 20.4 [18.0, 23.3] | 23.6 [20.5, 27.7] | <0.001 |
| Gynoid fat mass (kg) | 2.56 [2.19, 2.95] | 2.71 [2.35, 3.08] | 0.028 | 3.38 [2.94, 3.98] | 3.86 [3.22, 4.65] | <0.001 |
| AGR | 0.66 [0.54, 0.76] | 0.76 [0.68, 0.84] | 0.028 | 0.79 [0.69, 0.89] | 0.87 [0.79, 0.97] | <0.001 |
| Total lean mass (kg) | 51.0 [47.4, 54.8] | 49.9 [47.0, 54.5] | 0.371 | 55.7 [51.8, 59.9] | 57.0 [52.9, 61.2] | <0.001 |
| Trunk lean mass (kg) | 27.6 [26.0, 29.6] | 26.9 [25.5, 28.9] | 0.209 | 29.5 [27.6, 31.6] | 30.1 [28.0, 32.4] | 0.001 |
| Appendicular lean mass (kg) | 23.3 [21.1, 25.4] | 23.1 [20.8, 25.2] | 0.998 | 26.0 [24.0, 28.7] | 26.9 [24.7, 29.4] | <0.001 |
| SMI (kg/m2) | 7.43 (0.74) | 7.41 (0.69) | 0.769 | 8.45 (0.80) | 8.70 (0.91) | <0.001 |
| ALM‐fraction (%) | 31.9 [30.3, 33.9] | 31.2 [29.1, 33.2] | 0.015 | 30.5 [28.7, 32.3] | 29.4 [27.7, 31.0] | <0.001 |
| Normal SMI | 58.8 | 58.2 | 0.630 | 94.3 | 94.7 | 0.337 |
| Presarcopenia | 24.5 | 20.9 | 3.0 | 2.0 | ||
| Sarcopenia | 16.7 | 20.9 | 2.7 | 3.3 | ||
| Gait speed (m/s) | 1.26 [1.11, 1.40] | 1.27 [1.13, 1.38] | 0.727 | 1.24 [1.09, 1.35] | 1.23 [1.09, 1.34] | 0.990 |
| Hand grip strength (kg) | 35.4 (8.5) | 33.0 (9.2) | 0.036 | 36.8 (8.9) | 36.7 (9.1) | 0.841 |
| Women (n = 2629) | ||||||
| No NAFLD (n = 746) | NAFLD (n = 94) | p * | No NAFLD (n = 986) | NAFLD (n = 803) | p * | |
| Height (m) | 164.0 (6.6) | 163.4 (6.4) | 0.420 | 162.5 (6.7) | 162.7 (6.4) | 0.435 |
| Weight (kg) | 61.0 (6.6) | 63.1 (5.6) | 0.003 | 75.8 (10.5) | 82.6 (11.7) | <0.001 |
| Total fat mass (kg) | 20.9 [17.7, 23.4] | 23.5 [21.1, 25.0] | <0.001 | 29.9 [26.5, 34.5] | 34.8 [30.3, 40.8] | <0.001 |
| Body fat fraction (%) | 34.1 (4.9) | 37.4 (3.6) | <0.001 | 41.8 (4.4) | 44.3 (4.3) | <0.001 |
| Android fat mass (kg) | 1.48 [1.12, 1.81] | 1.95 [1.70, 2.29] | <0.001 | 2.47 [2.06, 2.99] | 3.20 [2.67, 3.92] | <0.001 |
| Trunk/Appendicular fat mass (kg) | 16.1 [13.7, 17.9] | 17.9 [16.4, 19.0] | <0.001 | 22.7 [20.2, 26.4] | 26.5 [23.1, 30.9] | <0.001 |
| Gynoid fat mass (kg) | 3.33 [2.81, 3.83] | 3.46 [2.97, 3.86] | 0.080 | 4.67 [3.99, 5.48] | 5.16 [4.35, 6.13] | <0.001 |
| AGR | 0.43 [0.35, 0.51] | 0.56 [0.50, 0.65] | 0.080 | 0.53 [0.46, 0.61] | 0.62 [0.55, 0.71] | <0.001 |
| Total lean mass (kg) | 37.3 [34.7, 40.1] | 37.1 [34.4, 38.7] | 0.118 | 40.3 [37.6, 43.7] | 42.3 [39.3, 45.8] | <0.001 |
| Trunk lean mass (kg) | 20.8 [19.4, 22.3] | 20.5 [19.2, 21.8] | 0.135 | 21.9 [20.6, 23.7] | 22.9 [21.3, 24.8] | <0.001 |
| Appendicular lean mass (kg) | 16.5 [15.0, 18.1] | 16.2 [15.2, 17.3] | 0.109 | 18.3 [16.8, 20.2] | 19.3 [17.6, 21.3] | <0.001 |
| SMI (kg/m2) | 6.14 (0.60) | 6.03 (0.45) | 0.088 | 7.01 (0.71) | 7.36 (0.84) | <0.001 |
| ALM‐fraction (%) | 27.7 [25.8, 29.4] | 26.2 [24.7, 27.5] | <0.001 | 25.2 [23.7, 26.6] | 24.2 [22.9, 25.5] | <0.001 |
| Normal SMI | 79.9 | 76.6 | 0.727 | 98.8 | 98.8 | 0.691 |
| Presarcopenia | 12.2 | 14.9 | 0.5 | 0.7 | ||
| Sarcopenia | 7.9 | 8.5 | 0.7 | 0.5 | ||
| Gait speed (m/s) | 1.24 [1.11, 1.36] | 1.21 [1.08, 1.31] | 0.994 | 1.17 [1.03, 1.28] | 1.15 [1.02, 1.27] | 0.570 |
| Hand grip strength (kg) | 21.8 (6.0) | 20.9 (5.1) | 0.176 | 21.77 (5.75) | 21.61 (5.66) | 0.553 |
Pooled data based on 74 imputations is presented as mean (SD), median [P25, P75], or percentage. Data is presented stratified by sex and BMI.
NAFLD = nonalcoholic fatty liver disease; AGR = android‐fat‐to‐gynoid‐fat ratio; SMI = skeletal muscle index; ALM = appendicular lean mass; BMI = body mass index.
Values of p are calculated using analyses of variance, Kruskal‐Wallis, or the chi‐square test.
We observed no clear effect modification, but the association between body components and NAFLD was most pronounced in normal‐weight women (Table 2). Again, fat mass was generally associated with higher NAFLD and lean mass with lower NAFLD prevalence. In both sexes, android fat mass remained associated with NAFLD. In addition, ALM remained independently associated with normal‐weight women (OR, 0.75; 95% CI, 0.62 to 0.91; P = 0.003; Table 2).
Table 2.
Association of Different Parts of Body With NAFLD
| Men | ||||
|---|---|---|---|---|
| Normal‐weight (n = 499) | p | Overweight (n = 1481) | p | |
| Model 1 | ||||
| Total lean mass | 0.87 (0.80–0.96) | 0.003 | 0.93 (0.90–0.96) | <0.001 |
| Appendicular lean mass | 0.80 (0.69–0.93) | 0.003 | 0.91 (0.86–0.96) | 0.001 |
| Trunk lean mass | 0.86 (0.74–1.00) | 0.045 | 0.90 (0.85–0.95) | <0.001 |
| Total body fat | 1.16 (1.06–1.27) | 0.001 | 1.08 (1.05–1.12) | <0.001 |
| Trunk fat mass | 1.22 (1.08–1.37) | 0.001 | 1.11 (1.06–1.17) | <0.001 |
| Gynoid fat mass | 1.46 (0.81–2.63) | 0.203 | 0.97 (0.80–1.17) | 0.720 |
| Android fat mass | 3.49 (1.95–6.22) | <0.001 | 2.49 (2.00–3.11) | <0.001 |
| Model 2 | ||||
| Total lean mass | 0.90 (0.82–0.99) | 0.026 | 0.96 (0.93–1.00) | 0.038 |
| Appendicular lean mass | 0.84 (0.72–0.97) | 0.020 | 0.95 (0.89–1.01) | 0.105 |
| Trunk lean mass | 0.90 (0.77–1.06) | 0.199 | 0.94 (0.89–1.00) | 0.065 |
| Total body fat | 1.13 (1.03–1.24) | 0.011 | 1.04 (1.01–1.08) | 0.022 |
| Trunk fat mass | 1.17 (1.04–1.33) | 0.012 | 1.06 (1.01–1.11) | 0.030 |
| Gynoid fat mass | 1.32 (0.71–2.42) | 0.377 | 0.96 (0.78–1.18) | 0.685 |
| Android fat mass | 2.94 (1.59–5.45) | 0.001 | 1.77 (1.40–2.25) | <0.001 |
| Model 3 | ||||
| Total lean mass | 0.94 (0.85–1.04) | 0.202 | 0.97 (0.94–1.01) | 0.147 |
| Appendicular lean mass | 0.87 (0.74–1.01) | 0.071 | 0.97 (0.91–1.03) | 0.296 |
| Trunk lean mass | 0.99 (0.83–1.17) | 0.867 | 0.96 (0.90–1.02) | 0.169 |
| Total body fat | 1.09 (0.99–1.20) | 0.094 | 1.03 (1.00–1.07) | 0.094 |
| Women | ||||
| Normal‐weight (n = 840) | p | Overweight (n = 1789) | p | |
| Model 1 | ||||
| Total lean mass | 0.79 (0.71–0.87) | <0.001 | 0.97 (0.93–1.01) | 0.098 |
| Appendicular lean mass | 0.68 (0.57–0.81) | <0.001 | 0.95 (0.88–1.02) | 0.146 |
| Trunk lean mass | 0.76 (0.64–0.87) | 0.001 | 0.97 (0.91–1.02) | 0.227 |
| Total body fat | 1.22 (1.10–1.35) | <0.001 | 1.04 (1.00–1.08) | 0.034 |
| Trunk fat mass | 1.30 (1.14–1.49) | <0.001 | 1.06 (1.01–1.12) | 0.020 |
| Gynoid fat mass | 0.73 (0.47–1.12) | 0.150 | 0.63 (0.54–0.73) | <0.001 |
| Android fat mass | 12.5 (6.28–24.9) | <0.001 | 3.40 (2.71–4.27) | <0.001 |
| Model 2 | ||||
| Total lean mass | 0.80 (0.71–0.89) | <0.001 | 0.96 (0.92–1.00) | 0.074 |
| Appendicular lean mass | 0.69 (0.57–0.83) | <0.001 | 0.98 (0.90–1.06) | 0.545 |
| Trunk lean mass | 0.76 (0.64–0.90) | 0.001 | 0.93 (0.88–1.00) | 0.035 |
| Total body fat | 1.20 (1.08–1.33) | 0.001 | 1.05 (1.01–1.10) | 0.020 |
| Trunk fat mass | 1.26 (1.09–1.44) | 0.001 | 1.07 (1.01–1.13) | 0.021 |
| Gynoid fat mass | 1.00 (0.62–1.61) | 0.996 | 0.85 (0.73–1.00) | 0.050 |
| Android fat mass | 8.34 (3.95–17.6) | <0.001 | 2.16 (1.69–2.76) | <0.001 |
| Model 3 | ||||
| Total lean mass | 0.84 (0.75–0.94) | 0.002 | 0.97 (0.93–1.01) | 0.170 |
| Appendicular lean mass | 0.75 (0.62–0.91) | 0.003 | 1.01 (0.94–1.10) | 0.772 |
| Trunk lean mass | 0.82 (0.69–0.98) | 0.029 | 0.93 (0.87–0.99) | 0.025 |
| Total body fat | 1.16 (1.03–1.29) | 0.011 | 1.06 (1.01–1.10) | 0.010 |
Results are given as OR (95% CI) for NAFLD as outcome stratified by sex and BMI. Results in bold reflect significant findings with a P value <0.010. Model 1: adjusted for age, study cohorts, weight, and height. Model 2: in addition: HOMA‐IR, and triglycerides. Model 3: in addition AGR. Additional adjustments for confounding by education level, physical activity, alcohol intake, energy intake, ALT, and smoking resulted in negligible changes in odds ratio (<5%).
NAFLD = nonalcoholic fatty liver disease; OR: odds ratio; CI = confidence interval; BMI: body mass index; AGR = android‐fat‐to‐gynoid‐fat ratio; HOMA‐IR = homeostasis model assessment of insulin resistance.
Supporting Table 3 shows the substitution analyses. Substituting ALM for fat mass was associated with lower prevalence of NAFLD, except when replaced for gynoid fat mass. Indeed, replacing components by gynoid fat mass was associated with lower NAFLD prevalence, whereas the opposite was true for android fat mass.
Comparing the performance of the different body composition parameters for NAFLD, fat mass parameters explained more variation of the outcome (resulted in a better model fit) than lean mass parameters (as indicated by a lower AIC). AGR was the predictor with the overall best model fit (Supporting Table 4). Interestingly, SMI and ALM‐fraction performed equally with regard to the model fit in the analysis for NAFLD.
SMI and NAFLD
Table 3 shows the association between our exposure variable of interest, SMI, and NAFLD. SMI was associated with less NAFLD prevalence in normal‐weight men, but significance dissipated after correction for multiple testing and adjustment for AGR. In normal‐weight women, however, SMI remained associated with less NAFLD after full adjustment (OR, 0.48; 95% CI, 0.29 to 0.80; P = 0.005; Table 3). Using ALM‐fraction (instead of SMI) provided similar conclusions, underscoring the robustness of our results (Supporting Table 5). No independent association was found between SMI and overweight NAFLD. However, SMI was relatively high in this population. The prevalence of low SMI (ie, ≤7.25 kg/m2 or ≤5.67 kg/m2) was only 3% in overweight individuals against 28% in the normal‐weight. Prevalence of (pre)sarcopenic obesity (ie, BMI ≥30 kg/m2) was even lower, in fact, only five out of the 1091 obese individuals had a low SMI. Interestingly, four of them had NAFLD.
Table 3.
SMI and NAFLD
| Men | |||||
|---|---|---|---|---|---|
| Normal‐weight (n = 499) | p | Overweight (n = 1481) | p | ||
| Model 1 | SMI | 0.50 (0.32–0.79) | 0.003 | 0.75 (0.63–0.90) | 0.002 |
| Model 2 | SMI | 0.57 (0.36–0.91) | 0.018 | 0.88 (0.72–1.06) | 0.169 |
| Model 3 | SMI | 0.63 (0.39–1.02) | 0.061 | 0.92 (0.76–1.12) | 0.401 |
| Women | |||||
| Normal‐weight (n = 840) | p | Overweight (n = 1789) | p | ||
| Model 1 | SMI | 0.37 (0.23–0.59) | <0.001 | 0.90 (0.75–1.09) | 0.291 |
| Model 2 | SMI | 0.39 (0.23–0.64) | <0.001 | 0.98 (0.80–1.20) | 0.846 |
| Model 3 | SMI | 0.48 (0.29–0.80) | 0.005 | 1.08 (0.87–1.33) | 0.485 |
Results are given as OR (95% CI) for NAFLD as outcome stratified by sex and BMI. Results in bold reflect significant findings with a P value <0.010. Model 1: adjusted for age, study cohorts, weight and height. Model 2: in addition: HOMA‐IR, and triglycerides. Model 3: in addition: AGR. Additional adjustments for confounding by education level, physical activity, alcohol intake, energy intake, ALT, and smoking resulted in negligible changes in odds ratio (<5%).
SMI = skeletal muscle index; NAFLD = nonalcoholic fatty liver disease; OR = odds ratio; CI = confidence interval; BMI = body mass index; HOMA‐IR: homeostasis model assessment of insulin resistance; AGR = android‐fat‐to‐gynoid‐fat ratio.
The analysis of presarcopenia and sarcopenia is given in Supporting Table 6. In model 1, sarcopenia was associated with NAFLD in men and presarcopenia with NAFLD in women, nonetheless these findings did not hold after further adjustment (Supporting Table 6). In total, 1548 participants (33.6%) had either missing data on grip strength or gait speed. None of the participants had missing data on both variables. Sensitivity analysis using imputed values on grip strength and gait speed resulted in reclassification of 24 participants and yielded similar results to the original data (data not shown).
Of the 1623 individuals with NAFLD, 1126 (69.4%) had data available on LSM. NASH prevalence was low (total population: n = 115, 10.2%; normal‐weight: n = 10, 8.5%; and overweight: n = 105, 10.4%). The small number of cases in the normal‐weight (three in men and seven in women) hampered the possibility to stratify by BMI. Supporting Table 7 shows that SMI was associated with lower NASH prevalence in women, but this was no longer significant after correction for multiple testing (OR, 0.48; 95% CI, 0.25 to 0.92; P = 0.027).
Discussion
In this large Western population‐based study we examined the association between muscle mass, fat mass, fat distribution, and NAFLD, using DXA scans and hepatic imaging, both highly reliable measuring methods. Moreover, this is the first study that examines the sarcopenia definition, as proposed by the EWGSOP consensus, in association with NAFLD. We made several novel observations. First, we showed that incremental skeletal muscle mass was consistently associated with lower NAFLD prevalence and severity in normal‐weight women (using different approaches). This association was independent of metabolic confounders, and importantly, independent of fat distribution. A similar association was seen in normal‐weight men, but significance did not hold after correction for multiple testing. Prevalence of presarcopenia and sarcopenia was low, but most prevalent in normal‐weight NAFLD. However, in multivariable analysis neither sarcopenia nor presarcopenia was associated with NAFLD, most likely because of the relative high SMI in this elderly community dwelling population. Second, high fat mass appeared a better predictor for NAFLD prevalence than low muscle mass. In particular, android fat mass had a significant association with higher NAFLD prevalence in all subgroups, whereas gynoid fat tended to be associated with lower NAFLD prevalence. Likewise, AGR as proxy for fat distribution was the strongest predictor for NAFLD.
Recently, low skeletal muscle mass emerged as potential risk factor for steatosis independent of age and BMI.31, 32, 33, 34, 35 Most of these studies were carried out in Korean populations.31, 32, 33, 35 However, as ethnicity is important in the evaluation of body composition,12 it is difficult to generalize these results to Western populations. Asian individuals carry proportionately higher fat mass for a given BMI than caucasians. To date, only two studies have been performed in Western populations.10, 36 Both studies found that the prevalence of presarcopenia increased with fibrosis severity in NAFLD. But direct comparison to these studies is hampered by the different study populations (abovementioned studies included advanced steatohepatitis patients with cirrhosis prevalence of 33.3% and 15.6% without healthy control group).10, 36 This is in contrast to our study in which we targeted a different study population; ie, an unselected presumably healthy population in which only 10% of the participants with steatosis had coinciding elevated LSM. Furthermore, low skeletal muscle mass alone has been systematically referred to as sarcopenia in these previous reports. However, loss of strength or performance is strictly needed to make the actual diagnosis of sarcopenia.15 A recent small study examined actual sarcopenia univariately with NAFLD and found that sarcopenia was actually associated with lower instead of higher NAFLD prevalence.37 Yet, this finding is in line with our univariate results in which SMI was also associated with higher prevalence of NAFLD. Although the previous study did not perform a multivariable analysis, we found that this association changed after adjustment for weight.
Another commonly used proxy for skeletal muscle mass is ALM‐fraction.9, 10, 31, 32, 33, 34, 35 We chose to use SMI as advised by the EWGSOP consensus guidelines, but we did perform additional analyses on ALM‐fraction, and found that both ALM fraction and SMI were equally good in predicting the prevalence of NAFLD if only adjusted for weight and height. We hypothesize that the explanation lies in the fact that most phenotypes associated with sarcopenia, are typically related to frailty and poor nutritional status (and hence to a low BMI),15 whereas NAFLD is typically related to adiposity and overnutrition (and thus to a high BMI).1 We would therefore like to pose that ALM‐fraction might be more clinically applicable than SMI for the (univariate) assessment of presarcopenia in NAFLD as it already takes into account the confounder weight. In our study, neither presarcopenia nor sarcopenia was independently associated with NAFLD. We believe this is due to the low number of (pre)sarcopenic cases. Indeed, the median SMI was relatively high in our population. As a consequence, (pre)sarcopenia in the obese and overweight was rare (prevalence of 0.4% and 5%, respectively). This could explain the lack of SMI being associated with overweight NAFLD. As for muscle function, grip strength has been analyzed previously in a large Asian cohort that found an inverse association between grip strength (relative to body weight) and NAFLD.38 In our study, incremental grip strength was associated with lower NAFLD prevalence in men only; however, this association did not hold significance after multivariable adjustment.
Interestingly, the association between SMI and NAFLD was more pronounced in women than in men. This is in contrast to previous studies in which associations are generally more pronounced in men. However, there were fewer men than women in this study (n = 1980 versus n = 2629) and, as said before, SMI was relatively high in our community‐dwelling population. Therefore, we cannot fully exclude the possibility that differences in sex‐stratified analyses resulted, in part, from power issues. Nevertheless, there are obvious differences in sex hormones between men and women that could have affected the association between SMI with NAFLD. As our study concerns an elderly population, there is a presumed relative reduced testosterone, a strong anabolic hormone, in men.39 Nonetheless, absolute testosterone in elderly men is generally still higher than in women.40 Also, relative estrogen is decreased in women because of the menopause,39 and fat mass–to–fat free mass ratio is much higher in women than in men.25 Furthermore, apart from the differences in sex hormones, other signaling hormones such as growth hormone could have also affected the relation between body composition and NAFLD.41 In addition, inflammation has been suggested to play a major role in sarcopenia; myokines secreted by skeletal muscle mass, for instance, antagonize the pro‐inflammatory and metabolic effects of adipocytes from fat tissue.34, 42 This could explain the hypothesized synergistic effect of low skeletal muscle mass and adiposity together. Moreover, it is known that visceral fat, in particular, impairs adipocyte function and adipocytokine secretion, which can lead to an increase in pro‐inflammatory cytokines such as interleukin‐6 and tumor necrosis factor‐alpha.43 This could explain the attenuating effect of AGR between body components with NAFLD, which is particularly interesting because AGR was much higher in men than in women.
A major strength of our study is the use of a large population‐based cohort with access to a great number of reliably measured traits. Additionally, body composition was determined by the gold standard (DXA scan) and we used the recommended EWGSOP definition to determine the presence of presarcopenia and sarcopenia.15 Moreover, we included only individuals with a European background to exclude bias due to racial differences in body composition. And last, we performed several sensitivity analyses to test the robustness of our conclusions. Nonetheless, several limitations need mentioning. First, the cross‐sectional design of this study makes it impossible to draw conclusions on the cause‐effect relation between body composition and NAFLD. Second, the gold standard for diagnosis of NAFLD is liver biopsy rather than US. However, performing an invasive liver biopsy in presumed healthy individuals is unethical. Moreover, US is a widely used screening tool that yields high sensitivity and specificity for moderate and severe steatosis.44 Third, missing data on gait speed was substantial (32.6%). Yet, grip strength, as indicator for muscle strength, was present in almost all participants (>99%). Moreover, sensitivity analyses using imputed data on gait speed showed similar results to the main non‐imputed analysis, suggesting no under or overestimation of sarcopenia. Fourth, we had no information on possible fat infiltration in the muscle, which could have affected the quality of muscle mass. Previous studies have suggested that, in older women particularly, there is quite a proportion of fat within the quadriceps muscle, this infiltration was related to gait speed.45 However, in our study was gait speed not associated with NAFLD, neither in men nor in women.
In summary, skeletal muscle mass as assessed by multiple proxies was consistently associated with NAFLD in normal‐weight women. However, fat mass was a better predictor for NAFLD probability in both sexes. In particular, android‐fat‐to‐gynoid‐fat ratio was strongly associated with NAFLD. This is in line with android fat being associated with higher odds and gynoid fat being associated with lower odds for NAFLD. These findings, if confirmed by others, add to the rationale of resistance training to replace fat mass by lean mass (regardless of of simultaneous weight loss) as an easily accessible, inexpensive, and targeted approach for individuals with NAFLD.46
Disclosures
The authors declare no competing financial, professional, or personal interests.
Supporting information
Additional Supporting Information may be found in the online version of this article.
Acknowledgments
The Rotterdam Study is supported by the Erasmus MC University Medical Centre and Erasmus University Rotterdam, the Netherlands Organization for Scientific Research (NWO), the Netherlands Organization for Health Research and Development (ZonMw), the Research Institute for Diseases in the Elderly (RIDE), the Ministry of Education, Culture and Science, the Ministry of Health, Welfare and Sports, the European Commission (DG XII) and by the Municipality of Rotterdam. FR, JS, and KT are supported by the Netherlands Scientific Organization (NWO) and ZonMW Project number: NWO/ZONMW‐VIDI‐016 to 136‐367. We thank the Rotterdam Study participants and staff; in particular, the collaborating general practitioners and pharmacists. The authors are also deeply grateful to Mrs. van Wijngaarden (nurse ultrasonographist) for performing the abdominal ultrasonography and liver stiffness measurements.
Authors’ roles: LA, KT, JS, FR, and SDM: study concept and design; LA and KT: acquisition of data; LA and NE: statistical analysis; LA, KT, NE, JS, FR, and SDM: analysis and interpretation of data; LA: drafting of the manuscript; LA: finalizing the article; KT, FR, and SDM: critical revision of the manuscript for important intellectual content; RK: technical support; AI, HM, OF, FR, and SDM: study supervision; HJ: obtained funding; KT, NE, JS, RK, AI, HM, OF, FR, and SDM: approval of the final article.
References
References
- 1. Rinella ME. Nonalcoholic fatty liver disease: a systematic review. JAMA. 2015;313(22):2263–73. [DOI] [PubMed] [Google Scholar]
- 2. Koehler EM, Schouten JN, Hansen BE, et al. Prevalence and risk factors of non‐alcoholic fatty liver disease in the elderly: results from the Rotterdam study. J Hepatol. 2012;57(6):1305–11. [DOI] [PubMed] [Google Scholar]
- 3. Pais R, Barritt AS, 4th , Calmus Y, et al. NAFLD and liver transplantation: current burden and expected challenges. J Hepatol. 2016;65(6):1245–57. [DOI] [PMC free article] [PubMed] [Google Scholar]
- 4. Younossi ZM, Stepanova M, Negro F, et al. Nonalcoholic fatty liver disease in lean individuals in the United States. Medicine (Baltimore). 2012;91(6):319–27. [DOI] [PubMed] [Google Scholar]
- 5. Prentice AM, Jebb SA. Beyond body mass index. Obes Rev. 2001;2(3):141–7. [DOI] [PubMed] [Google Scholar]
- 6. Pang Q, Zhang JY, Song SD, et al. Central obesity and nonalcoholic fatty liver disease risk after adjusting for body mass index. World J Gastroenterol. 2015;21(5):1650–62. [DOI] [PMC free article] [PubMed] [Google Scholar]
- 7. Ko YH, Wong TC, Hsu YY, Kuo KL, Yang SH. The correlation between body fat, visceral fat, and nonalcoholic fatty liver disease. Metab Syndr Relat Disord. 2017;15(6):304–11. [DOI] [PubMed] [Google Scholar]
- 8. Wijarnpreecha K, Panjawatanan P, Thongprayoon C, Jaruvongvanich V, Ungprasert P. Sarcopenia and risk of nonalcoholic fatty liver disease: a meta‐analysis. Saudi J Gastroenterol. 2018;24(1):12–7. [DOI] [PMC free article] [PubMed] [Google Scholar]
- 9. Koo BK, Kim D, Joo SK, et al. Sarcopenia is an independent risk factor for non‐alcoholic steatohepatitis and significant fibrosis. J Hepatol. 2017;66(1):123–31. [DOI] [PubMed] [Google Scholar]
- 10. Petta S, Ciminnisi S, Di Marco V, et al. Sarcopenia is associated with severe liver fibrosis in patients with non‐alcoholic fatty liver disease. Aliment Pharmacol Ther. 2017;45(4):510–8. [DOI] [PubMed] [Google Scholar]
- 11. Bugianesi E, Gastaldelli A, Vanni E, et al. Insulin resistance in non‐diabetic patients with non‐alcoholic fatty liver disease: sites and mechanisms. Diabetologia. 2005;48(4):634–42. [DOI] [PubMed] [Google Scholar]
- 12. Agrawal S, Duseja AK. Non‐alcoholic fatty liver disease: east versus west. J Clin Exp Hepatol. 2012;2(2):122–34. [DOI] [PMC free article] [PubMed] [Google Scholar]
- 13. Lee DH, Keum N, Hu FB, et al. Predicted lean body mass, fat mass, and all cause and cause specific mortality in men: prospective US cohort study. BMJ. 2018;362:k2575. [DOI] [PMC free article] [PubMed] [Google Scholar]
- 14. Ikram MA, Brusselle GGO, Murad SD, et al. The Rotterdam Study: 2018 update on objectives, design and main results. Eur J Epidemiol. 2017;32(9):807–50. [DOI] [PMC free article] [PubMed] [Google Scholar]
- 15. Cruz‐Jentoft AJ, Baeyens JP, Bauer JM, et al. Sarcopenia: European consensus on definition and diagnosis: Report of the European Working Group on Sarcopenia in Older People. Age Ageing. 2010;39(4):412–23. [DOI] [PMC free article] [PubMed] [Google Scholar]
- 16. Verlinden VJ, van der Geest JN, Hoogendam YY, Hofman A, Breteler MM, Ikram MA. Gait patterns in a community‐dwelling population aged 50 years and older. Gait Posture. 2013;37(4):500–5. [DOI] [PubMed] [Google Scholar]
- 17. Trajanoska K, Schoufour JD, Darweesh SK, et al. Sarcopenia and its clinical correlates in the general population: The Rotterdam Study. J Bone Miner Res. 2018;33(7):1209–18. [DOI] [PubMed] [Google Scholar]
- 18. Hamaguchi M, Kojima T, Itoh Y, et al. The severity of ultrasonographic findings in nonalcoholic fatty liver disease reflects the metabolic syndrome and visceral fat accumulation. Am J Gastroenterol. 2007;102(12):2708–15. [DOI] [PubMed] [Google Scholar]
- 19. Koehler EM, Plompen EP, Schouten JN, et al. Presence of diabetes mellitus and steatosis is associated with liver stiffness in a general population: The Rotterdam study. Hepatology. 2016;63(1):138–47. [DOI] [PubMed] [Google Scholar]
- 20. Boursier J, Zarski JP, de Ledinghen V, et al. Determination of reliability criteria for liver stiffness evaluation by transient elastography. Hepatology. 2013;57(3):1182–91. [DOI] [PubMed] [Google Scholar]
- 21. Petta S, Maida M, Macaluso FS, et al. The severity of steatosis influences liver stiffness measurement in patients with nonalcoholic fatty liver disease. Hepatology. 2015;62(4):1101–10. [DOI] [PubMed] [Google Scholar]
- 22. Goldbohm RA, van den Brandt PA, Brants HA, et al. Validation of a dietary questionnaire used in a large‐scale prospective cohort study on diet and cancer. Eur J Clin Nutr. 1994;48(4):253–65. [PubMed] [Google Scholar]
- 23. Matthews DR, Hosker JP, Rudenski AS, Naylor BA, Treacher DF, Turner RC. Homeostasis model assessment: insulin resistance and beta‐cell function from fasting plasma glucose and insulin concentrations in man. Diabetologia. 1985;28(7):412–9. [DOI] [PubMed] [Google Scholar]
- 24. Alberti KG, Eckel RH, Grundy SM, et al. Harmonizing the metabolic syndrome: a joint interim statement of the International Diabetes Federation Task Force on Epidemiology and Prevention; National Heart, Lung, and Blood Institute; American Heart Association; World Heart Federation; International Atherosclerosis Society; and International Association for the Study of Obesity. Circulation. 2009;120(16):1640–5. [DOI] [PubMed] [Google Scholar]
- 25. Lafortuna CL, Maffiuletti NA, Agosti F, Sartorio A. Gender variations of body composition, muscle strength and power output in morbid obesity. Int J Obes (Lond). 2005;29(7):833–41. [DOI] [PubMed] [Google Scholar]
- 26. Sakamoto Y, Ishiguro M, Kitagawa G Akaike information criterion statistics. Dordrecht, Netherlands: D. Reidel Publishing, 1986. [Google Scholar]
- 27. Hu FB, Stampfer MJ, Rimm E, et al. Dietary fat and coronary heart disease: a comparison of approaches for adjusting for total energy intake and modeling repeated dietary measurements. Am J Epidemiol. 1999;149(6):531–40. [DOI] [PubMed] [Google Scholar]
- 28. Willett W Nutritional epidemiology. New York: Oxford University Press, 2013.. [Google Scholar]
- 29. Šidák Z. Rectangular confidence regions for the means of multivariate normal distributions. J Am Stat Assoc. 1967;62(318):626–33. [Google Scholar]
- 30. Galwey NW. A new measure of the effective number of tests, a practical tool for comparing families of non‐independent significance tests. Genet Epidemiol. 2009;33(7):559–68. [DOI] [PubMed] [Google Scholar]
- 31. Hong HC, Hwang SY, Choi HY, et al. Relationship between sarcopenia and nonalcoholic fatty liver disease: the Korean Sarcopenic Obesity Study. Hepatology. 2014;59(5):1772–8. [DOI] [PubMed] [Google Scholar]
- 32. Lee YH, Jung KS, Kim SU, et al. Sarcopaenia is associated with NAFLD independently of obesity and insulin resistance: Nationwide surveys (KNHANES 2008‐2011). J Hepatol. 2015;63(2):486–93. [DOI] [PubMed] [Google Scholar]
- 33. Kim HY, Kim CW, Park CH, et al. Low skeletal muscle mass is associated with non‐alcoholic fatty liver disease in Korean adults: the Fifth Korea National Health and Nutrition Examination Survey. Hepatobiliary Pancreat Dis Int. 2016;15(1):39–47. [DOI] [PubMed] [Google Scholar]
- 34. Moon JS, Yoon JS, Won KC, Lee HW. The role of skeletal muscle in development of nonalcoholic Fatty liver disease. Diabetes Metab J. 2013;37(4):278–85. [DOI] [PMC free article] [PubMed] [Google Scholar]
- 35. Kim G, Lee S‐E, Lee Y‐B, et al. Relationship between relative skeletal muscle mass and nonalcoholic fatty liver disease: a 7‐year longitudinal study. Hepatology. 2018;68(5):1755–68. [DOI] [PubMed] [Google Scholar]
- 36. Issa D, Alkhouri N, Tsien C, et al. Presence of sarcopenia (muscle wasting) in patients with nonalcoholic steatohepatitis. Hepatology. 2014;60(1):428–9. [DOI] [PMC free article] [PubMed] [Google Scholar]
- 37. Zhai Y, Xiao Q, Miao J. The relationship between NAFLD and sarcopenia in elderly patients. Can J Gastroenterol Hepatol. 2018;2018:5016091–4. [DOI] [PMC free article] [PubMed] [Google Scholar]
- 38. Meng G, Wu H, Fang L, et al. Relationship between grip strength and newly diagnosed nonalcoholic fatty liver disease in a large‐scale adult population. Sci Rep. 2016;6:33255. [DOI] [PMC free article] [PubMed] [Google Scholar]
- 39. Sakuma K, Yamaguchi A. Sarcopenia and age‐related endocrine function. Int J Endocrinol. 2012;2012:10–10. [DOI] [PMC free article] [PubMed] [Google Scholar]
- 40. Maggio M, Lauretani F, Ceda GP. Sex hormones and sarcopenia in older persons. Curr Opin Clin Nutr Metab Care. 2013;16(1):3–13. [DOI] [PubMed] [Google Scholar]
- 41. Fan Y, Menon RK, Cohen P, et al. Liver‐specific deletion of the growth hormone receptor reveals essential role of growth hormone signaling in hepatic lipid metabolism. J Biol Chem. 2009;284(30):19937–44. [DOI] [PMC free article] [PubMed] [Google Scholar]
- 42. Walsh K. Adipokines, myokines and cardiovascular disease. Circ J. 2009;73(1):13–8. [DOI] [PubMed] [Google Scholar]
- 43. Schaffler A, Scholmerich J, Buchler C. Mechanisms of disease: adipocytokines and visceral adipose tissue—emerging role in nonalcoholic fatty liver disease. Nat Clin Pract Gastroenterol Hepatol. 2005;2(6):273–80. [DOI] [PubMed] [Google Scholar]
- 44. Dasarathy S, Dasarathy J, Khiyami A, Joseph R, Lopez R, McCullough AJ. Validity of real time ultrasound in the diagnosis of hepatic steatosis: a prospective study. J Hepatol. 2009;51(6):1061–7. [DOI] [PMC free article] [PubMed] [Google Scholar]
- 45. Visser M, Kritchevsky SB, Goodpaster BH, et al. Leg muscle mass and composition in relation to lower extremity performance in men and women aged 70 to 79: the health, aging and body composition study. J Am Geriatr Soc. 2002;50(5):897–904. [DOI] [PubMed] [Google Scholar]
- 46. Hallsworth K, Fattakhova G, Hollingsworth KG, et al. Resistance exercise reduces liver fat and its mediators in non‐alcoholic fatty liver disease independent of weight loss. Gut. 2011;60(9):1278–83. [DOI] [PMC free article] [PubMed] [Google Scholar]
Associated Data
This section collects any data citations, data availability statements, or supplementary materials included in this article.
Supplementary Materials
Additional Supporting Information may be found in the online version of this article.