

Abstract
Purpose
Vascular remodeling is a significant pathological feature of various pulmonary diseases, which may be assessed by quantitative computed tomography (CT) imaging. The purpose of this study was therefore to develop and validate an automatic method for quantifying pulmonary vascular morphology in CT images.
Methods
The proposed method consists of pulmonary vessel extraction and quantification. For extracting pulmonary vessels, a graph‐cuts‐based method is proposed which considers appearance (CT intensity) and shape (vesselness from a Hessian‐based filter) features, and incorporates distance to the airways into the cost function to prevent false detection of airway walls. For quantifying the extracted pulmonary vessels, a radius histogram is generated by counting the occurrence of vessel radii, calculated from a distance transform‐based method. Subsequently, two biomarkers, slope α and intercept β, are calculated by linear regression on the radius histogram. A public data set from the VESSEL12 challenge was used to independently evaluate the vessel extraction. The quantitative analysis method was validated using images of a three‐dimensional (3D) printed vessel phantom, scanned by a clinical CT scanner and a micro‐CT scanner (to obtain a gold standard). To confirm the association between imaging biomarkers and pulmonary function, 77 scleroderma patients were investigated with the proposed method.
Results
In the independent evaluation with the public data set, our vessel segmentation method obtained an area under the receiver operating characteristic (ROC) curve of 0.976. The median radius difference between clinical and micro‐CT scans of a 3D printed vessel phantom was 0.062 ± 0.020 mm, with interquartile range of 0.199 ± 0.050 mm. In the studied patient group, a significant correlation between diffusion capacity for carbon monoxide and the biomarkers, α (R = −0.27, P = 0.018) and β (R = 0.321, P = 0.004), was obtained.
Conclusion
In conclusion, the proposed method was validated independently using a public data set resulting in an area under the ROC curve of 0.976 and using a 3D printed vessel phantom data set, showing a vessel sizing error of 0.062 mm (0.16 in‐plane pixel units). The correlation between imaging biomarkers and diffusion capacity in a clinical data set confirmed an association between lung structure and function. This quantification of pulmonary vascular morphology may be helpful in understanding the pathophysiology of pulmonary vascular diseases.
Keywords: CT, lung vessel, quantitative analysis
1. Introduction
Pulmonary vascular remodeling is a significant characteristic of pulmonary diseases, such as chronic obstructive pulmonary disease, interstitial lung disease (ILD), and pulmonary hypertension (PH).1, 2, 3, 4, 5, 6, 7, 8 Systemic sclerosis (SSc, also called scleroderma) is an autoimmune connective tissue disease affecting several organs, and its pulmonary involvement can cause ILD or PH, which may involve pulmonary vascular alterations.9, 10 Pulmonary vascular alterations have been described as narrowing and pruning of distal vessels, which increases vascular resistance and cause hypertension.11, 12, 13 The dilation of proximal vessels is also an essential morphological feature, as increasing pulmonary vascular resistance affects proximal vessels.14 Investigation of changes in pulmonary vascular morphology, such as pruning of small vessels or dilation of large vessels, may provide assessments of pulmonary vascular remodeling.
Some studies based on the analysis of computed tomography (CT) images have shown promising results for quantifying pulmonary vascular remodeling in pulmonary diseases, using different approaches. Matsuoka et al.6, 11 introduced a CT measurement by quantifying the two‐dimensional (2D) cross‐sectional area of small pulmonary vessels for assessing vessel pruning of COPD. Estepar et al.13, 15 extended the pruning measurement into three‐dimensional (3D) by quantifying the ratio between the volume of small vessels and all the vessels, and applied these measurements within each lobe. Rahaghi et al.14, 16 introduced the concepts of imaging biomarkers, the ratio of small vessel volume to total vessel volume and ratio of proximal vessels to all vessels, for quantifying pruning of distal vessels and dilation of proximal vessels, respectively. Rather than assessing vascular morphology based on vessel size, Helmberger et al.17 calculated tortuosity as well as the 3D fractal dimension of segmented pulmonary vessels for characterizing vascular remodeling of patients with pulmonary hypertension.
In the pulmonary vessel quantification methods mentioned above, accurate pulmonary vessel segmentation is an important step. A few approaches have been proposed for extracting pulmonary vessels, and a challenge called VESSEL12 with a public data set and independent evaluation has been organized for comparing vessels extraction methods, among which Hessian‐based methods have shown a good performance.18, 19, 20 Tube‐like structures can be enhanced by Hessian‐based methods, such as the Frangi filter21 and the Sato filter,22 where the eigenvalues of the Hessian matrix describe cylindrical properties. However, the response of Hessian‐based filters is low at vessels’ edges and bifurcations.23 The “strain energy" filter19 can partly overcome this problem of low responses at vessels’ bifurcations by analyzing the shape‐tuned strain energy density, where the Hessian matrix was considered as a stress tensor, and three tensor invariants from orthogonal tensor decomposition were used to formulate distinctive functions for shape discrimination, brightness contrast, and strength. Finally, the multiscale scheme was adopted to optimally enhance vessels with different size. According to the VESSEL12 challenge,20 simply using a threshold or local thresholds24 on the vesselness map (which is the vessel likelihood map enhanced with Hessian‐based methods) cannot extract binary vessels accurately. In our previous work,25 a graph‐cuts‐based method was proposed for extracting lung vessels by combining the appearance (CT intensity) and shape (vesselness) features into a single cost function, and achieved a competitive performance, which was the best result among the submitted methods of VESSEL12 that produce binary vessels. Nevertheless, the separation between airway wall and vessels was still inaccurate, which could also affect the quantification of pulmonary vascular morphology, due to the similar CT intensities of airway walls and vessels.
Validating pulmonary vessel quantification methods is a challenging task, as manually annotating the ground truth in patient images is extremely time consuming and it is hard to determine the quality and robustness of the annotated data quantitatively. As a possible alternative to validate the quantification methods, anthropomorphic phantoms containing known distributions of vessels can be considered. These phantoms can be created using 3D printing, a technique with applications in different imaging modalities, including CT, for imaging and dosimetry purposes.26, 27, 28, 29, 30, 31 In this work, a 3D printed phantom with vessel‐like structures designed in a similar way to the lung was used to validate the proposed method for quantifying vessel morphology. A sufficiently high‐resolution micro‐CT scan of the lung phantom was acquired and used as the ground truth for the vessel distribution.
In this study, we present an automatic and quantitative approach to assess pulmonary vascular morphology alternations, based on an adjusted graph‐cuts vessel segmentation and a novel histogram‐based quantitative analysis. The automatic method consists of two steps: pulmonary vessel extraction and pulmonary vessel quantification. For pulmonary vessel extraction, we extended our previous graph‐cuts‐based method25 by incorporating the distance map to airways into the cost function, for separating airway walls from vessels. For pulmonary vessel quantification, a method is proposed by quantifying the radius histogram of pulmonary vessels, where all pulmonary vessels are included in the analysis, instead of only a specific part. The accuracy and robustness of the automatic method were validated with three data sets: (a) a public data set of the VESSEL12 challenge to test the accuracy of the vessel segmentation, (b) a data set of a 3D printed vessel phantom to evaluate the accuracy of vessel sizing and robustness to protocol settings of the CT scanner, and (c) finally, a data set of SSc patients to confirm the correlation between pulmonary vessel morphology and pulmonary function.
2. Materials and methods
2.A. Pulmonary vessel extraction
The segmentation task can be treated as a labeling problem , where is the set of voxels from an image and .32 A voxel is labeled as object or background according to its own properties and the connections with its neighbors. In the labeling problem of graph‐cuts, the general energy function formulates the connection weights of voxel nodes, object (source) node and background (sink) node, as described in Eq. (1). The energy function can be optimized by finding the max‐flow/min‐cut.33, 34 To extract pulmonary vessels, we developed a graph‐cuts‐based method by combining appearance features, shape features, and the distance map to airway [as shown in Fig. 1(a)]. The energy function of the proposed method is specified by formulating the data term and neighbor term , with a weight γ:
| (1) |
where means that q is a neighbor voxel of p. The data term consists of three parts:
| (2) |
The appearance term is calculated based on the CT intensity; the shape term is calculated based on the vesselness of the strain energy filter;19 and the distance‐to‐airway (DTA) term is determined by the distance map to the airways. These three terms are then balanced with weights w and , where w is a global balance between appearance and shape terms, and is the weight for airway wall elimination.
Figure 1.
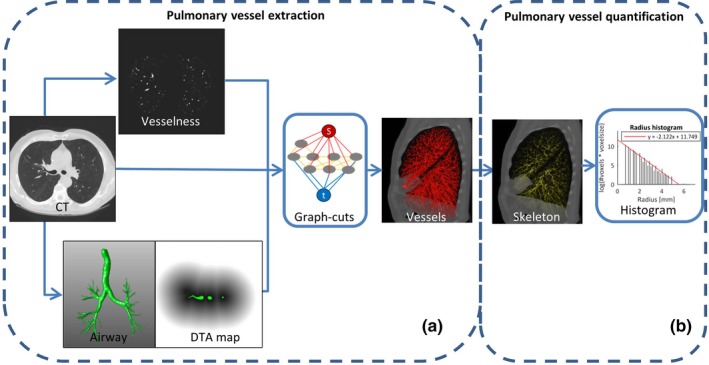
An overview of our proposed method which contains two main steps: pulmonary vessel extraction and pulmonary vessel quantification. To extract pulmonary vessels, the vesselness, computed tomography (CT) intensity, and distance map to airways were incorporated into the graph‐cuts cost function, as shown in (a). The vessel skeletons and radii are calculated based on the segmented vessels, and the radius histogram is counted and quantified with the proposed method, as illustrated in (b). [Color figure can be viewed at http://www.wileyonlinelibrary.com]
Since voxels with a high CT intensity or vesselness obtain a high vessel likelihood, sigmoid functions are employed for both the appearance term and the shape term. The appearance term and the shape term are formulated as follows:
| (3) |
where and represent the CT intensity and vesselness of voxel p, respectively; , , and are the parameters of the corresponding sigmoid function. The determination of the parameters in these sigmoid functions is described in Section 2.D.1.
The DTA map is employed in order to eliminate false detection of airway walls. Therefore, the lumen of the airway of each chest CT scan is detected by a region‐growing method where a seed point was searched in the trachea and an optimal threshold was selected by iteratively growing before the leakage of airway volume.35 Then, a Euclidean distance transform is applied for generating the distance map. The thickness of airway walls is approximately 2 mm,24, 36 thus, the response range of the DTA term was set to [0, 3] mm. For determining the response to airway walls, a Gaussian function is adopted as the kernel that centers on μ and scales with σ, as follows:
| (4) |
The neighbor term from Eq.(1) is the cost for cutting a neighborhood edge (p,q) on the basis of their similarity and γ is a positive coefficient for controlling the smoothness of detected objects. It is calculated based on the similarity in CT intensity of two neighborhood voxels , and corrected by the spatial distance between them:
| (5) |
where represents the spatial distance between voxels p and q. In other words, if two neighboring voxels (p,q) have similar CT intensities and are within a short distance but are labeled differently, the cost of the n‐edge (p,q) will be high.
2.B. Pulmonary vessel quantification
Based on the segmented pulmonary vessels, the centerlines of vessel trees are extracted using a skeletonization method.37 This method successively erodes the border voxels for locating the vessel centerline where a refinement step was adapted for eliminating the side branches; the distance between boundary voxels and central voxel are calculated and the minimum distance is used to estimate the corresponding radius. This estimated radius is subsequently assigned to that central voxel, producing a 3D skeleton map with radius value embedded in the centerline voxels, as illustrated in Fig. 1(b).
The number of voxels in the vessel skeleton with a specific radius on the vessel skeleton are counted as . The vessel radius frequency is normalized for voxel size () to make the histogram comparable across CT scans, that is, instead of simply using the counted number, the accumulated length was estimated with the number of voxels and their size. In order to obtain a linear relation between frequency and radius, a logarithmic transformation is applied to the normalized frequency in the histogram. Afterward, a “radius histogram" is generated for pulmonary vessels of each CT scan, in which the bin’s index represents the vessel radius, , and its height characterizes the logarithm of the normalized frequency of occurrence, .
| (6) |
For quantifying the pulmonary vessel morphology, the “robustfit" method (in MATLAB R2016a Mathworks, Natick, MA38) was applied to solve the linear regression in Eq. (6). For each patient, two biomarkers, α and β, are calculated, which correspond to the slope and intercept of the linear regression, respectively [Fig. 1(b)]. The slope parameter α quantifies the occurrence of vessels with small radius relative to those with large radius, which may indicate pruning of small vessels and/or dilation of larger vessels. The intercept parameter β is an extrapolation of the radius histogram to radius 0, which may relate to the pulmonary vascular tree’s capacity. As capillary vessels have a radius around 5 μm, that is, 0.005 mm, an extrapolation to radius 0.005 mm may estimate the total number of pulmonary capillaries, therefore, the intercept to radius 0 mm is closely related to the pulmonary vascular capacity.
2.C. Implementation and parameter settings
The graph‐cuts based vessel segmentation method was implemented in Matlab and its cost function was optimized with a mixed C++ code.39 This proposed vessel segmentation method was made publicly available by the authors.40 The strain energy filter for vessel enhancement is also open source and can be found via ITKTools.41 The quantitative method for analyzing the pulmonary vascular morphology benefited from the DtfSkeletonization module of MeVisLab and the robust linear regression method in MATLAB. The entire processing pipeline was completed in MeVisLab 2.7.1 (VC12‐64), on a personal computer configured with 24 GB of memory, a 2.67 GHz CPU (Intel Xeon W3520) and a 64‐bit Windows 7 operating system.
The parameters used in the segmentation method were optimized on the VESSEL12 training set. The appearance and shape features were normalized to ranges of [0, 1], before incorporation in the cost function. The strain energy filter’s parameters were set according to the literature.19, 25 Before construction of the graph, a very low threshold of 0.0009 was used on the vesselness map to exclude voxels that almost certainly belong to the background. This resulted in a relatively small sparse graph structure, which was constructed with the remaining voxel nodes, object and background nodes, and allowed processing of high‐resolution CT scans.
The balance parameter w between appearance and shape terms was set to 0.6,25 and the parameter of the distance to airway term was set to 0.4, optimized with a grid search approach on the training data set. Because the response region of the distance to airway term was limited to a local region around the airways, the parameter was not set as a global balance, in comparison to the global balance parameter w. The parameters of the sigmoid function in the appearance term and shape term were automatically estimated with the following algorithm. The mean value of the appearance feature was picked as the initial threshold to initially separate the background and object. The appearance feature inside the object region was fitted with a Gaussian distribution, by calculating the mean μ and standard deviation std. Then, the parameters of the sigmoid function were estimated by fitting a Gaussian distribution, such that Sigmoid(β) = Gaussian(β) = 0.5 and Sigmoid(μ) = 0.95. The parameters used in the cost function for the shape term were calculated in a similar way.
A distance transform‐based method (“DtfSkeletonization” method of MeVislab) was used to performed the skeletonization on the binary vessels extracted by the graph‐cuts‐based method.37 The binary segmentation was successively eroded while preserving the topology of the original structure. The vessel centerlines were localized and the radius was recorded at the corresponding voxels on the skeleton. A vessel radius can obtain a value from only a limited number of possible distances, due to the limited and constant voxel size. To capture all these unique radii in the histogram, the bin size was set to as small as 0.001. To calculate the imaging biomarkers α and β, a linear regression was applied to the radius histogram. In the regression analysis, the first non‐empty bin was excluded as this might be influenced by the noise of small branches in vessel skeleton extraction or affected by the voxel size in estimating the size of small vessels.
2.D. Data sets used for validation
2.D.1. Data set of VESSEL12
The proposed pulmonary vessel segmentation method was validated on the VESSEL12 challenge data set,20 which contains three CT scans in a training set and 20 CT scans in a testing set. These anonymous scans were collected from three hospitals: the University Medical Center Utrecht (Utrecht, The Netherlands), the University Clinic of Navarra (Pamplona, Spain), and the Radboud University Nijmegen Medical Centre (Nijmegen, The Netherlands). In the 20 testing CT scans, points of interest were annotated individually by three trained medical students with four possible labels: vessel, lung parenchyma, airway wall, or lesion.20 Only the points on which all three annotators agreed were included in the ground truth. In the three training CT scans, the annotations were labeled in a similar way, however, there were only two label categories (vessel and non‐vessel). Furthermore, the lung masks for each of these scans were provided by the VESSEL12 challenge organizers.
For the three CT training scans, we performed lung vessel segmentation and the corresponding evaluation results can be found in the Appendix. For the 20 CT scans in the testing data set, the binary pulmonary vessels, which were extracted using the graph‐cuts‐based method, were uploaded to the VESSEL12 challenge website and independent evaluation results were calculated by the organizers. The probabilistic submissions were scaled to probabilistic maps with a range of [0, 255], then multilevel thresholds were used to generate a receiver operating characteristic (ROC) curve, details of which are presented in the online supplementary. For binary submissions, “probabilistic maps" were generated by applying a distance transform and scaling the results to [0,255], subsequently, the ROC curve was calculated based on the probabilistic maps. The area under the ROC curve (Az) was used as the main score for validation.
2.D.2. Data set of vessel phantom
To validate the proposed method for quantifying vessel morphology, a 3D printed phantom, representing vessel‐like structures with similar sizes as in the lung was used. This phantom was designed based on the work by Weibel et al. who performed a microscopic study of lungs from human cadavers.42, 43 An algorithm was developed in MATLAB (Mathworks, Natick, MA) to generate a model of a vessel tree structure, with decreasing length and diameter for the vessels, modeled as cylinders, in each vessel generation iteration.44, 45 The model was constrained to an elliptically shaped frame (150 × 103 × 26 mm), as it was intended for manufacturing a small phantom for image quality in CT.44, 45 The vessel tree started growing at the center of one of the sides of the ellipse [Fig. 2(a)]. At each vessel segment ending, there could be a bifurcation or an elongation. The bifurcation chance increased after each elongation step. The direction of the two generated branches after a bifurcation was randomly taken but limited within , with regard to the parent vessel direction. The lung model was printed using a ProJet HD 3000 3D printer with multi jet modeling (MJM) technique in ultrahigh definition mode, selecting Visijet EX200 as material. This mode enables to print very thin layers (32 μm) of material. The total number of generated vessel segments was in the order of 20000 being the biggest 10 mm diameter and the smallest in the order of 0.2 mm.45 To estimate the accuracy of the 3D printing process, three of the biggest vessels in the phantom (by design, 4.25, 3.35, and 2.65 mm radius) were measured with a Vernier caliper (0.05 mm accuracy) in three different positions along each vessel, and the locations of these selected vessels are demonstrated in the Fig. A3 of the online supplementary.
Figure 2.
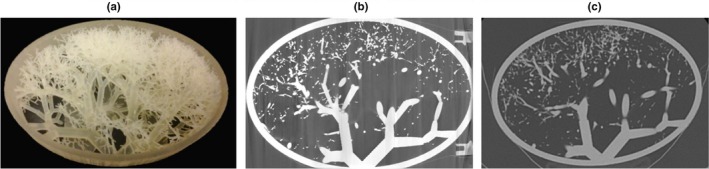
Three‐dimensional (3D) printed vessel phantom (a), together with one slice of the micro‐computed tomography (CT) scans (b) and one slice of a clinical CT scan (c). [Color figure can be viewed at http://www.wileyonlinelibrary.com]
The 3D printed vessel phantom was imaged with a clinical CT scanner (Aquilion ONE, Toshiba Medical Systems, Otawara, Japan) with the following acquisition parameters: 0.5 × 64 mm collimation, 120 kV, pitch 0.828, 0.5 s rotation time, FOV of 195.1 mm, and various tube currents (10, 20, 50, 100 mA). Images were reconstructed with 0.5 mm slice thickness and interval, selecting FC30 as convolution kernel with two reconstruction methods, filtered back projection (FBP) and AIDR3D standard. The voxel dimensions were 0.38 × 0.38 × 0.5 mm. In total, eight CT scans were available to be analyzed (4 dose levels, 2 reconstruction methods). The CT scans of the 3D printed phantom can be accessed by contacting the corresponding author of the original paper.52 To obtain the ground truth of the 3D printed vessel phantom, the phantom was scanned with a Zeiss Xradia 520 Versa micro‐CT scanner, selecting 80 kV, 7 W, and a 0.4 X objective and no additional filtration. The total scanning time was 36 h and vertical stitching was applied to obtain the image volumes (1894 × 1903 px by 2922 images). The voxel size was 52 × 52 × 52 μm and the micro‐CT images, in TIFF format, were 8‐bits depth. The images were reformatted and rotated in MeVisLab, in order to obtain the same cross‐sections as in the CT scans.
2.D.3. Data set of SSc patients
Patients with SSc were selected from the biobank of the Leiden Combined Care in SSc (77 patients; 67 women and 10 men; mean age ± STD, 49.9 ± 14.2 yr). The images were obtained with a thorax protocol and the patients took pulmonary function tests (PFT).46 All patients were scanned with the same CT scanner (Aquilion 64, Toshiba Medical Systems, Otawara, Japan), during full inspiration and without contrast medium. The CT protocol settings were: tube current 140 mA without modulation; tube voltage 120 kV; rotation time = 0.4 s; collimation = 640.5 mm; images were reconstructed with 0.5 mm slices.9 There were 512 × 512 pixels in each slice of CT images and the in‐plane pixel dimension was 0.64 × 0.64 mm on average. The local Medical Ethical Committee approved the protocol. A written informed consent was obtained from each patient prior to enrollment. The fibrosis scorings of these patients were established by two experts (a radiologist, L.K. and a rheumatologist, A.S.) on the basis of CT scans and blinded to the clinical information.47 PFTs were tested including total lung capacity (TLC), forced vital capacity (FVC), forced expiratory volume in 1 s , and single‐breath diffusion capacity for carbon monoxide corrected for hemoglobin concentration (DLCOc), and the PFT results were expressed as a percentage of the predicted (%predicted) value.48, 49 No fibrosis were observed in the CT scans of the selected patients, however their gas transfer (DLCOc %predicted) was impaired. Thus, we hypothesized that pulmonary vascular changes could partly explain the impaired gas transfer.
3. Results
The proposed graph‐cuts‐based method obtained an Az of 0.976, which is a competitive performance among 31 submitted methods and the best result among binary submissions of VESSEL12, where the average (range) in Az of all and binary submissions were 0.888 (0.561, 0.986) and 0.83 (0.671, 0.976), respectively. The evaluation results of the best probabilistic submission and three binary submissions with top ranking performance are shown in Table 1: the best probabilistic method was a logistic regression classifier that enhances lung vessels, based on a stacked multiscale strategy learned features (FL); the binary submissions (LT) of van Dongen et al.24 who extracted vessels with local thresholds on Frangi filter’s vesselness and excluded airway walls by dilating the airway segmentation; the binary submissions (AS) of our previous method which segmented vessels with a graph‐cuts‐based method by combining only appearance and shape features into the cost function; the binary submissions (ASD) of the newly proposed method which detected vessels with a graph‐cuts based techniques by incorporating appearance and shape features and distance to airway. The evaluation results of all submissions are also available online on the VESSEL12 website.51
Table 1.
Area under the receiver operating characteristic (ROC) curve (Az) score of three binary submissions to the VESSEL12 challenge across all categories (categories 1: principal, 2: small vessels, 3: medium vessels, 4: large vessels, 5: vessel/airway wall, 6: vessel/dense lesion, 7: vessel/mucus‐filled bronchi, 8: vessel‐in‐lesion/lesion, 9: vessel/nodules). The probabilistic submission using stacked multiscale feature learning (FL50), the binary submission using local threshold on Frangi’s vesselness (LT24), the graph‐cuts based method combining the appearance and shape feature (AS25), and the method proposed in this work incorporating appearance, shape and distance to airway (ASD).
| Categories | 1 | 2 | 3 | 4 | 5 | 6 | 7 | 8 | 9 |
|---|---|---|---|---|---|---|---|---|---|
| FL | 0.986 | 0.977 | 0.986 | 0.994 | 0.944 | 0.667 | 0.595 | 0.654 | 0.439 |
| LT | 0.932 | 0.885 | 0.954 | 0.955 | 0.912 | 0.688 | 0.404 | 0.649 | 0.517 |
| AS | 0.973 | 0.952 | 0.973 | 0.992 | 0.861 | 0.485 | 0.297 | 0.658 | 0.255 |
| ASD | 0.976 | 0.958 | 0.977 | 0.993 | 0.930 | 0.484 | 0.305 | 0.661 | 0.254 |
The vessels in the eight CT scans of the phantom were segmented with the proposed graph‐cuts‐based method. The supporting oval frame surrounding the 3D printed vessels in the phantom was removed using a cylinder mask. As there were no airways designed in this phantom, the distance map to the airway was set to zero. The vessels in the micro‐CT scan were extracted using a threshold, which was determined by density histogram analysis [Fig. 3(a)]. The distribution of the voxel density in the micro‐CT scan had two peaks, the peak with lower density value corresponds to the background (air) and the peak with higher density value corresponds to the vessels. Thus, the density value with minimum frequency between these two peaks was selected as threshold to extract vessels from the micro‐CT scan. The threshold T = 156 was used to segment vessels in this study. The 3D and 2D view of the extracted vessels are illustrated in Figs. 3(b) and 3(c). For testing the robustness of this ground truth vessel extraction, we selected a range of thresholds (156 ± 4) to extract vessels (see Appendix).
Figure 3.
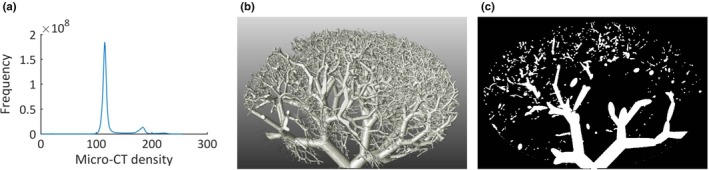
Histogram and extracted vessels of the vessel phantom in the micro‐computed tomography (CT) scan, (a) the histogram of the micro‐CT scan of three‐dimensional (3D) printed vessel phantom, (b) 3D view of the extracted vessels in the micro‐CT scan, (c) two‐dimensional (2D) view of the extracted vessels. [Color figure can be viewed at http://www.wileyonlinelibrary.com]
Based on the extracted vessels in the micro‐CT scan and the eight CT scans, the corresponding vessel size was calculated with the DtfSkeletonization module of MeVisLab, where the estimated radius was recorded at the vessel centerlines. The micro‐CT scan was registered to the eight CT scans of the phantom using Elastix registration,53 separately, of which the rigid registration (Euler transform) with B‐spline interpolation was used for mapping the micro‐CT scan and CT scans, and the parameters were optimized with an adaptive stochastic optimizer. The skeletons in the micro‐CT scan were extended into a “radius tube" by assigning the voxels on each cross section with the radius that was recorded on its centerline, in order to overcome the mismatching between skeletons of micro‐CT scan and clinical CT scans. With the transformation parameters, the radius tube obtained in micro‐CT scan was transferred to each CT scan. For each CT scan, we obtained a mapping vector with two columns: one contained the radius value of vessels in the clinical CT scan and the other contained the radius value of the corresponding vessels in the micro‐CT scan, where all vessels (radius range from 0.1 to 5 mm) were analyzed. The median (M) and interquartile range (IQR) of radius differences (radius of CT ‐ radius of micro‐CT) were on average of 0.062 mm (0.16 in‐plane pixel units) and 0.199 mm (0.52 in‐plane pixel units), with an STD of 0.02 mm and 0.05 mm, respectively, which shows high robustness. The mean and STD of errors in percentage [%] (100 ×(radius of CT − radius of micro‐CT)/(radius of micro‐CT)) were calculated for vessels with a radius larger than 0.5 mm and 1 mm, respectively. The mean ± STD of errors in percentage for vessels with a radius > 0.5 mm was on average 3.2 ± 26.7%, and for vessels with a radius > 1 mm was on average −7.4 ± 20.4%. Details of % error are included in Table AII of the online supplementary, for comparing different CT scans with the micro‐CT scan. The correlations (R) between radius in CT and micro‐CT scans were calculated with Pearson’s correlation. The correlations are presented in Table 2. The correlations were all statistically significant and the average correlation was 0.909 (P < 0.001). Furthermore, linear regression was applied to the radii from the clinical CT scans and those from the micro‐CT scan. All regression analysis results are shown in Table 2, with an average slope and intercept of 1.018 and −0.058, respectively. The 2D histograms and linear regressions between radius of CT scans and micro‐CT scan are shown in Fig. 4. With regard to the 3D printing accuracy, the caliper measurements for the radii of the biggest vessels in the phantom, were 4.26, 3.36, and 2.66 mm, respectively, which are compatible with the expected values from the design file. Estimated by micro‐CT, the radii of the biggest vessels were 4.07, 3.23, and 2.56 mm, respectively, which demonstrated on average an underestimation of 0.13 mm and a relative error of 3%. In CT scans, the radii of these vessels are 4.07, 3.24, and 2.58 mm, respectively, which is presented on average an underestimation of 0.12 mm and a relative error of 3%, and details of vessel sizing in each CT scan are presented in Table AIII of the online supplementary.
Table 2.
Results of comparing radius analysis between computed tomography (CT) scans and micro‐CT scan, and results of quantifying vessel morphology of vessel phantom. The median (M), interquartile range (IQR) of the difference in radius, the correlation (R) between the two radius measurements, with the slope and intercept of the regression line are presented.
| CT setting | Comparison with micro‐CT scan | Biomarkers | ||||
|---|---|---|---|---|---|---|
| M (IQR) (mm) | R (P‐value) | Slope | Intercept | α | β | |
| 10 mA, FBP | 0.028 (0.281) | 0.869 (< 0.001) | 0.980 | 0.040 | −1.780 | 7.035 |
| 20 mA, FBP | 0.031 (0.275) | 0.874 (< 0.001) | 0.986 | 0.031 | −1.780 | 7.034 |
| 50 mA, FBP | 0.073 (0.172) | 0.922 (< 0.001) | 1.029 | −0.088 | −1.817 | 7.062 |
| 100 mA, FBP | 0.072 (0.179) | 0.921 (< 0.001) | 1.031 | −0.091 | −1.795 | 7.058 |
| 10 mA, AIDR3D | 0.074 (0.168) | 0.921 (< 0.001) | 1.030 | −0.090 | −1.709 | 6.918 |
| 20 mA, AIDR3D | 0.073 (0.169) | 0.920 (< 0.001) | 1.027 | −0.087 | −1.783 | 7.011 |
| 50 mA, AIDR3D | 0.073 (0.170) | 0.921 (< 0.001) | 1.029 | −0.088 | −1.817 | 7.062 |
| 100 mA, AIDR3D | 0.072 (0.179) | 0.920 (< 0.001) | 1.032 | −0.092 | −1.795 | 7.058 |
| Average | 0.062 (0.199) | 0.909 | 1.018 | −0.058 | −1.785 | 7.030 |
| STD | 0.020 (0.050) | N.A. | 0.022 | 0.058 | 0.034 | 0.049 |
Figure 4.
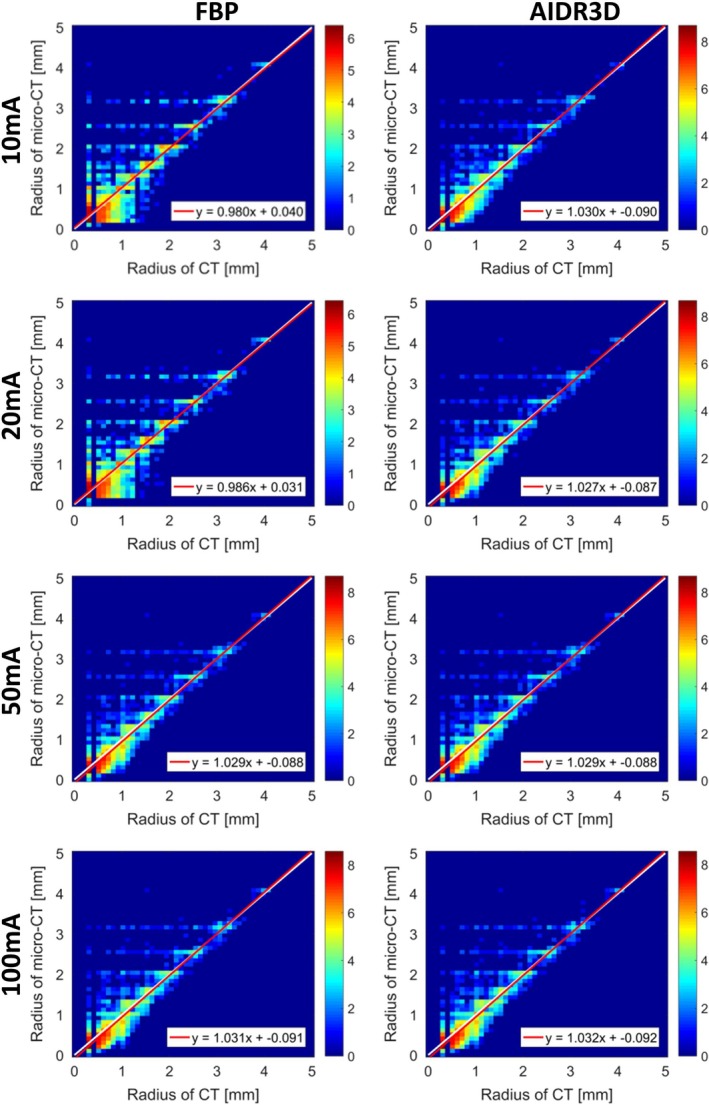
Comparison between the vessel radius estimated from the micro‐computed tomography (CT) scan and those from the clinical CT scans, for a range of dose levels and two reconstruction algorithms (FBP and AIDR3D). In each sub‐figure, the x‐axis contains the radii from the clinical CT and y‐axis contains the radii from the micro‐CT scan; the color scale implies the logarithm transformed frequency of the joint histogram; the white line is the identity line and the red line is the line of linear regression. [Color figure can be viewed at http://www.wileyonlinelibrary.com]
The vascular morphology in the clinical CT scans of the phantom was studied with the proposed radius histogram analysis method, based on the extracted vessels. For each CT scan, two imaging biomarkers (α and β) were obtained for quantifying the vascular morphology of the phantom, where the intercept β estimates the number of small vessels and the slope α quantifies the relative contribution between small and large vessels. The results of the biomarkers are presented in Table 2. The STD (average) of biomarker α is 0.034 (−1.785), and the STD (average) of biomarker β is 0.049 (7.03) which implies that the proposed method is robust against CT scanner settings, in particular variation in dose (mAs) and for two reconstruction methods (FBP and AIDR 3D). The vascular morphology was investigated in the micro‐CT scan with the proposed method, based on the vessels extracted with a threshold of 156. The imaging biomarkers α and β were −1.803 and 7.265, respectively. The average of difference in α and β between micro‐CT scan and clinical CT scans was −0.019 and 0.235, respectively.
With regard to the patient images from the Leiden Combined Care biobank, the lung masks were detected with a multi‐atlas segmentation method and pulmonary vascular morphology was investigated with the proposed method. The imaging biomarkers (α, β) were collected for all these patients. The average ± STD of α and β are (−1.49 ± 0.2) and (9.58 ± 0.61), respectively. The correlations between imaging biomarkers and DLCOc %predicted were studied with Spearman’s rho correlation. In the studied patient group, the imaging biomarkers, α (R = −0.27, P = 0.018) and β (R = 0.321, P = 0.004), were significantly correlated with DLCOc %predicted (with average ± STD, 70.4 ± 16.7). The scatter plots of DLCOc %predicted vs α, β, and the ROC curve of β (AUC = 0.651, P = 0.034) and α (AUC = 0.614, P = 0.112) are shown in Fig. A4 of the online supplementary, where patients were grouped into normal or abnormal gas transfer, based on the DLCOc %predicted value.61 The processing results of two patients in this SSc patient group, who were quantified with the proposed method, are illustrated in Fig. 5.
Figure 5.
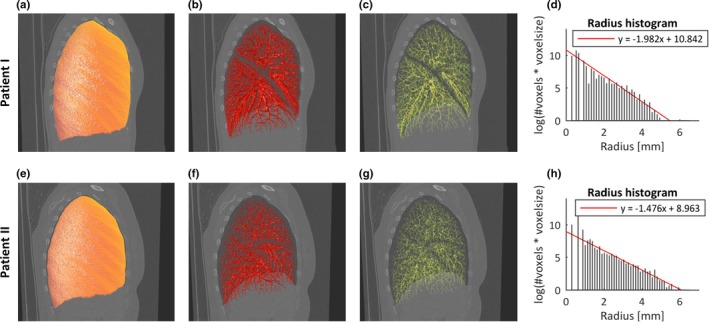
The pulmonary vascular morphology of two patients in systemic sclerosis (SSc) were quantified with the proposed method, and the DLCOc %predicted of patient I and II were 101.5% and 44.6%, respectively. (a, e) the detected lung mask; (b, f) the extracted pulmonary vessels; (c, g) the pulmonary vessel skeleton; (d, h) the radius histogram. [Color figure can be viewed at http://www.wileyonlinelibrary.com]
4. Discussion
In this work, we proposed an automatic method which consisted of two processing steps: a graph‐cuts based pulmonary vessel extraction and a radius histogram‐based pulmonary vessel quantification, for investigating pulmonary vascular morphology in CT images. The accuracy of the graph‐cuts based vessel segmentation method was validated with a public data set, and a competitive result was obtained among other submissions. The robustness of the pulmonary vessel quantification method was validated with a 3D printed vessel phantom data set, demonstrating a robust measurement by comparing CT and micro‐CT scans. The pulmonary vascular morphology in each CT scan was quantified into two biomarkers, α and β. The association between pulmonary vascular morphology and gas transfer was investigated with a data set of 77 patients with SSc. The biomarkers, α and β, were significantly correlated with DLCOc % predicted, suggesting that the impaired gas transfer is associated with the remodeling of pulmonary vascular morphology.
Extracting pulmonary vessels accurately is an essential processing step for quantifying pulmonary vascular morphology. In this work, a graph‐cuts‐based method was used for vessel segmentation, by including voxel’s appearance, shape features and distance to airways into a cost function. For a fair comparison with other binary methods for extracting pulmonary vessels, the public data set of VESSEL12 was used to validate the accuracy of the graph‐cuts‐based method. In comparison with methods using simply threshold or local‐threshold on vesselness, the proposed vessel segmentation method performed well according to the independent validation of VESSEL12. This might be due to the fact that the graph‐cuts‐based method considers multiple features for each voxel and assigns voxel’s label incorporating its neighboring information. The Hessian‐based filter may involve uncertainties in enhancing vessels, as computing the second derivative of voxel intensity of the Gaussian‐filtered image is based on the assumption that the pixel intensity across a vessel could be represented well by a Gaussian distribution, while this is not entirely true as mentioned by O’Dell et al.28 For separating the airway walls and vessels, the distance map was integrated into the graph‐cuts cost function. In the method proposed by van Dongen et al.,24 the airway walls were excluded by dilating the airway with a spherical element with a specific size, which might remove partially vessels touching airway walls. Our method obtained slightly better performance in separating the airway walls, as illustrated in Table 1, category 5. Our method performed worse, in contrast, in distinguishing vessels from dense lesions or nodules, categories 6 and 9, which may be due to the fact that intensity of lesions and nodules are similar to vessels. These are however not expected in patients with SSc. The probabilistic submission of FL50 achieved the best results among all submitted methods. As shown in VESSEL12,20 the probabilistic submissions performed slightly better. However, a fair comparison between binary and probabilistic method is difficult to make, because the binary methods are first converted to distance maps and used as a surrogate for “probabilistic maps" for ROC calculations. Therefore, the area under ROC curve of the probabilistic methods would be smaller if these maps were treated in the same way as binary method, that is, if the maps were first thresholded and distance transformed.
The quantitative analysis of the extracted pulmonary vessels was performed on the radius histogram, where the vessel radii were calculated by a distance transform‐based method. The accuracy of vessels sizing and the robustness of vessel morphology quantification were validated using a data set of a 3D printed vessel phantom, which was scanned with a micro‐CT scanner and a clinical CT scanner. The geometry model of the phantom was not used as a gold standard or ground truth for comparison, because the accuracy of the 3D printing process (which depends on the printer, technique, and selected material) can introduce differences between the model and the actual final printed object. Establishing robust methods to determine the accuracy and reproducibility of 3D printing, in particular for phantoms is still under investigation.45 The characteristics and limitations of the material used in the lung phantom compared to human vessels were discussed elsewhere.45 The use of 3D printing has grown in the past years in different areas in medicine, such as biocompatible prosthesis development, surgery planification with models based on patient images and educational purposes.54 One of its applications is the development of affordable customized test objects or phantoms that can be used in image quality assessment in different medical imaging modalities.27, 55 O’Dell et al. validated the accuracy of sizing vessels using a 3D printed vascular phantom made of acrylonitrile butadiene styrene plastic. The vessel sizes (with diameters ranging from 1.2 to 7 mm) were evaluated by manual measurements at 64 branches.28 Between manually measured and estimated radii, the linear regression analysis gave a slope of 1.056, and the difference was 0.074 mm (0.087 in‐plane pixel units).28 Due to the complexity of our 3D printed vessel phantom, however, the vessel sizes were hardly manually measurable, except for the biggest vessel branches.
For our study, a micro‐CT scan with sufficiently high resolution was used for calculating the ground truth of vessel sizes. Thus, we validated the accuracy of sizing vessels by comparing clinical CT scans with micro‐CT scan, and evaluated the vessel size in all vessel trees by matching the clinical and micro‐CT scans. The differences of vessel radii calculated from clinical CT scans and micro‐CT scan were very small (median of radius difference is on average of 0.062 mm, that is, 0.16 in‐plane pixel units); therefore, these radii were highly correlated; and the regression analysis between radius from clinical CT scans and micro‐CT scan obtained average slope approximated to 1 (1.018) and average intercept approximated to 0 (−0.058), implying that the radii detected in CT scans and in micro‐CT scan are almost equal. Compared to the vessel sizing study,28 which showed a slope of 1.056 in linear regression analysis and STD in difference of 0.074 mm (0.087 in‐plane pixel units), the proposed method obtained a slightly worse result in difference analysis of vessel radius but a comparable result in regression analysis. As shown in Fig. 4, there are a few outliers which are estimated in CT as 0.3 mm but micro‐CT as 3 mm. This might be due to the fact that side branches with a small radius, generated by skeletonization method in CT, were mapped to main branches with large radii in micro‐CT. The percentage rate of outliers (with radius in micro‐CT lager 0.5 mm than that in CT) is approximately 2.8%. The histogram plots of Fig. 4 are based on a voxel‐based assessment rather than a branch‐based assessment, a large (long) vessel, which may have many centerline voxels, will have more weight than small vessels with less centerline voxels. The number of branches is increasing exponentially with a decreasing radius.60 If a histogram plot is on a branch‐based assessment, the vessels with small radius will have more weight in statistics comparing to vessels with large radius. A voxel‐based strategy may partly balance the influence of large and small vessels. As presented in Table 2, the IQR of radius differences is smaller by increasing the dose (mA) for reconstruction kernel FBP, while it is much more stable for the kernel AIDR3D, which implies the kernel AIDR3D performed well for reconstructing images, with low mA settings.
Aspects of the vascular morphology of the extracted vessels was characterized by two biomarkers, α and β. The biomarker α, which is the slope of the radius histogram, reflects the related contributions between small vessels and large vessels, quantifying small vessels pruning and large vessel dilation. The intercept β, which was calculated by extrapolation to radius 0, estimates the vascular tree capacity, without actually detecting pulmonary capillaries. The pruning of small vessels will increase the resistance of blood flow in pulmonary vessels, the dilation of large vessels will happen after then. In some diseases, like pulmonary hypertension, the radius of very large vessels will also increase. The combination of these two effects would create a S‐shaped or flattened curve, these would influence the power for representing these effects of α and β. The robustness of the automatic quantification method was validated with CT scans acquired with various settings, while the variation in biomarkers was quite small. The average difference in α between micro‐CT scan and clinical CT scans is 0.025 by and 1.4% by , while that in β is 0.235 and 3.2%, respectively, that is, comparing clinical CT scans to micro‐CT scan, the biomarker about relative contribution between small vessels and large vessels were similar, in comparison with the biomarker of vessel tree capacity, which might be due to the fact that the micro‐CT performed better in detecting small vessels. The relation between gas transfer and biomarkers was validated with a data set of 77 SSc patients. The α and β showed significant correlations with DLCOc % predicted, which implied that the vascular remodeling (pruning/dilation and vascular tree capacity) is associated with impaired gas transfer. The AUC of β was significantly larger than 0.5 but not large, which implied that the pulmonary vascular morphology is associated with gas transfer but could not determine it, as there are many other factors that could influence gas transfer, such as cardiac function, thoracic stiffness, pulmonary airways, etc. Vascular remodeling as assessed in HRCT may precede changes in gas transfer and may therefore be important in the clinical evaluation and treatment decisions of SSc patients. Although the correlations between imaging biomarkers and gas transfer were moderate, these were comparable results in the relevant study that investigates the relation between pulmonary function and vascular morphology.13
There are some limitations in this work. The vessel extraction method was validated with the public data set of VESSEL12, of which the annotation were labeled by three observers, which might obtain errors in human interpretation. The lung vessel segmentation method did not work well for separating vessels and lung nodules, as the latter are mostly attached to vessel trees and have a high intensity, eliminating the response of nodules by considering the shape properties may be helpful for separating vessels and nodules, however, detecting/extracting lung nodules is not the goal of this study. The distance transform‐based method for sizing vessel radius may result in uncertainties or underestimations, a refinement operation for optimizing the centerline and radius would improve the radius estimation. The 3D printed vessel phantom used in this study contained a wide range of vessel radii and lengths. A future development in using this type of phantoms to test algorithms could be to control the number of vessels that are generated per diameter or length, during the design process. In this way, a robust ground truth based on the model could be compared. One of the limitations for the phantom is that the attenuation of the material used to print the vessels is slightly higher compared to human vessels.44, 45 Nonetheless, when comparing the relative contrast between the lung phantom vessels and the background (air) with values measured in vessels and parenchyma in patients, the difference is relatively small (around 10%). This limitation could be overcome in the future if other materials become available that could be printed with the required resolution and a lower attenuation. Nonetheless, these differences in attenuation do not influence the results in the present study, as the imaging biomarkers α and β are similar between micro‐CT scan and clinical CT scans acquired in different attenuation with average difference rate in 1.4% and 3.2%, respectively. The CT scans of both phantom and patients have a slice thickness of 0.5 mm; therefore, investigating the effect of various slice thicknesses to the proposed method will help extend its applications to other lung diseases and acquisition protocols. The performance of eliminating the airway walls was only validated with the VESSEL12 data, however, this data set was not mainly designed for this type of validation. Manually annotating a data set of airway walls and making it publicly available will be helpful for validating this type of techniques. In this work, the automatic quantification method was applied on both lungs together. Applying the quantification method on separate lungs or lung lobes may allow more localized assessments of vascular remodeling. In the future, we will investigate deep‐learning techniques in pulmonary analysis, as these techniques generally perform well in medical images analysis. We did not separate the arteries and veins for specific analysis. Developing a deep‐learning‐based method for separating arteries and veins is also a challenging but interesting topic for our future work,56, 57, 58 as pulmonary vascular diseases may affect arteries and veins differently. The airway wall thickness was assumed to be 2 mm in this study, while adjusting the thickness assumption with the airway size accordingly may improve the elimination of airway walls. Deep learning‐based methods performed well in measuring airway lumen and walls.59 Excluding airway walls from vessel extractions may benefit from this type of techniques. For validating the association between biomarkers and gas transfer, only the SSc patient group was involved without a control group. Quantifying the vascular morphology of healthy people may improve the detection of lung vasculopathy in SSc patients. However, even without these specific analyses or a control group, we already found a significant association between vascular morphology and gas transfer.
5. Conclusions
In conclusion, an automatic method has been proposed for quantifying pulmonary vascular morphology in CT images. The accuracy of vessel segmentation has been evaluated independently with the public data set of VESSEL12, and the robustness of the quantification method has been validated with the image data set of a 3D printed vessel phantom. The imaging biomarkers for quantifying pulmonary vessel morphology in CT images are correlated with gas transfer in the studied SSc patients.
Conflicts of interest
The authors have no relevant conflict of interest to disclose.
Supporting information
Data S1. Appendix
Acknowledgments
We acknowledge the VESSEL12 challenge organizers for the data collection and the independent evaluation. Z. Zhai is supported by China Scholarship Council scholarship number 201406120046. The 3D printed lung phantom was developed inside the project CLUES funded by the Dutch Technology Foundation STW with grant number 13592. The initial design of the vessel model and phantom was carried out by J. M. den Harder. J. Geleijns intermediated between the Leiden University Medical Center and the Naturalis Biodiversity Center (Leiden, The Netherlands), which granted access to their micro‐CT. In particular, we acknowledge Dr. Arjen Speksnijder (head of laboratories at the Naturalis Biodiversity Center) and Dirk van der Marel, for the acquisition and reconstruction of the micro‐CT scan.
References
- 1. Barberà JA, Riverola A, Roca J, et al. Pulmonary vascular abnormalities and ventilation‐perfusion relationships in mild chronic obstructive pulmonary disease. Am J Respir Crit Care Med. 1994;149:423–429. [DOI] [PubMed] [Google Scholar]
- 2. Pauwels RA, Buist AS, Calverley PM, Jenkins CR, Hurd SS. Global strategy for the diagnosis, management, and prevention of chronic obstructive pulmonary disease. Am J Respir Crit Care Med. 2001;163:1256–1276. [DOI] [PubMed] [Google Scholar]
- 3. Delcroix M, Noordegraaf M, Fadel E, et al. Vascular and right ventricular remodelling in chronic thromboembolic pulmonary hypertension. Eur Respir J. 2013;41:224–232. [DOI] [PubMed] [Google Scholar]
- 4. Quarck R, Wynants M, Ronisz A, et al. Characterization of proximal pulmonary arterial cells from chronic thromboembolic pulmonary hypertension patients. Respir Res. 2012;13:27. [DOI] [PMC free article] [PubMed] [Google Scholar]
- 5. Yoshimura K, Suzuki Y, Uto T, et al. Morphological changes in small pulmonary vessels are associated with severe acute exacerbation in chronic obstructive pulmonary disease. Int J Chron Obstruct Pulmon Dis. 2016;11:1435–1445. [DOI] [PMC free article] [PubMed] [Google Scholar]
- 6. Matsuoka S, Washko GR, Yamashiro T, et al. Pulmonary hypertension and computed tomography measurement of small pulmonary vessels in severe emphysema. Am J Respir Crit Care Med. 2010;181:218–225. [DOI] [PMC free article] [PubMed] [Google Scholar]
- 7. Galiè N, Humbert M, Vachiery JL, et al. 2015 ESC/ERS Guidelines for the diagnosis and treatment of pulmonary hypertension. Eur Heart J. 2016;37:67–119. [DOI] [PubMed] [Google Scholar]
- 8. Coste F, Dournes G, Dromer C, et al. CT evaluation of small pulmonary vessels area in patients with COPD with severe pulmonary hypertension. Thorax. 2016;71:830–837. [DOI] [PubMed] [Google Scholar]
- 9. Ninaber MK, Stolk J, Smit J, et al. Lung structure and function relation in systemic sclerosis: Application of lung densitometry. Eur J Radiol. 2015;84:975–979. [DOI] [PubMed] [Google Scholar]
- 10. Zhai Z, Staring M, Ninaber MK, et al. Pulmonary vascular morphology associated with gas exchange in systemic sclerosis without lung fibrosis. J Thorac Imaging. 2019. [Epub ahead of print]. 10.1097/RTI.0000000000000395 [DOI] [PubMed] [Google Scholar]
- 11. Matsuoka S, Washko GR, Dransfield MT, et al. Quantitative CT measurement of cross‐sectional area of small pulmonary vessel in COPD. Acad Radiol. 2010;17:93–99. [DOI] [PMC free article] [PubMed] [Google Scholar]
- 12. Kubo K, Ge RL, Koizumi T, et al. Pulmonary artery remodeling modifies pulmonary hypertension during exercise in severe emphysema. Respir Physiol. 2000;120:71–79. [DOI] [PubMed] [Google Scholar]
- 13. Estépar RSJ, Kinney GL, Black‐Shinn JL, et al. Computed tomographic measures of pulmonary vascular morphology in smokers and their clinical implications. Am J Respir Crit Care Med. 2013;188:231–239. [DOI] [PMC free article] [PubMed] [Google Scholar]
- 14. Rahaghi FN, Ross JC, Agarwal M, et al. Pulmonary vascular morphology as an imaging biomarker in chronic thromboembolic pulmonary hypertension. Pulm Circ. 2016;6:70–81. [DOI] [PMC free article] [PubMed] [Google Scholar]
- 15. Estépar RSJ, Ross JC, Russian K, Schultz T, Washko GR, Kindlmann GL. Computational vascular morphometry for the assessment of pulmonary vascular disease based on scale‐space particles. in 2012 9th IEEE International Symposium on Biomedical Imaging (ISBI)pages 1479–1482, IEEE, 2012. [DOI] [PMC free article] [PubMed]
- 16. Rahaghi FN, Come CE, Ross JC, et al. Morphologic response of the pulmonary vasculature to endoscopic lung volume reduction. Chron Obstruct Pulm Dis. 2015;2:214–222. [DOI] [PMC free article] [PubMed] [Google Scholar]
- 17. Helmberger M, Pienn M, Urschler M, et al. Quantification of tortuosity and fractal dimension of the lung vessels in pulmonary hypertension patients. PLoS ONE. 2014;9:e87515. [DOI] [PMC free article] [PubMed] [Google Scholar]
- 18. van Rikxoort EM, van Ginneken B. Automated segmentation of pulmonary structures in thoracic computed tomography scans: a review. Phys Med Biol. 2013;58:R187–R220. [DOI] [PubMed] [Google Scholar]
- 19. Xiao C, Staring M, Shamonin D, Reiber JH, Stolk J, Stoel BC. A strain energy filter for 3D vessel enhancement with application to pulmonary CT images. Med Image Anal. 2011;15:112–124. [DOI] [PubMed] [Google Scholar]
- 20. Rudyanto RD, Kerkstra S, Van Rikxoort EM, et al. Comparing algorithms for automated vessel segmentation in computed tomography scans of the lung: the VESSEL12 study. Med Image Anal. 2014;18:1217–1232. [DOI] [PMC free article] [PubMed] [Google Scholar]
- 21. Frangi AF, Niessen WJ, Vincken KL, Viergever MA. Multiscale vessel enhancement filtering. in International Conference on Medical Image Computing and Computer‐Assisted Intervention, pages 130–137, Springer, 1998. [Google Scholar]
- 22. Sato Y, Nakajima S, Shiraga N, et al. Three‐dimensional multi‐scale line filter for segmentation and visualization of curvilinear structures in medical images. Med Image Anal. 1998;2:143–168. [DOI] [PubMed] [Google Scholar]
- 23. Jerman T, Pernuš F, Likar B, Ž Špiclin. Beyond Frangi: an improved multiscale vesselness filter. in Medical Imaging 2015: Image Processing volume 9413, page 94132A, International Society for Optics and Photonics, 2015:94132A.
- 24. van Dongen E, van Ginneken B. Automatic segmentation of pulmonary vasculature in thoracic CT scans with local thresholding and airway wall removal. in 2010 IEEE International Symposium on Biomedical Imaging: From Nano to Macro, pages 668–671, IEEE; 2010.
- 25. Zhai Z, Staring M, Stoel BC, Lung vessel segmentation in CT images using graph‐cuts. In Medical Imaging 2016: Image Processing volume 9784, page 97842K, International Society for Optics and Photonics, 2016.
- 26. DeWerd LA, Kissick M. The Phantoms of Medical and Health Physics. Berlin: Springer; 2014. [Google Scholar]
- 27. Filippou V, Tsoumpas C. Recent advances on the development of phantoms using 3D printing for imaging with CT, MRI, PET, SPECT, and ultrasound. Med Phys. 2018;45:e740–e760. [DOI] [PMC free article] [PubMed] [Google Scholar]
- 28. O’dell WG, Gormaley AK, Prida DA. Validation of the Gatortail method for accurate sizing of pulmonary vessels from 3D medical images. Med Phys. 2017;44:6314–6328. [DOI] [PubMed] [Google Scholar]
- 29. Mitsouras D, Lee TC, Liacouras P, et al. Three‐dimensional printing of MRI‐visible phantoms and MR image‐guided therapy simulation. Magn Reson Med. 2017;77:613–622. [DOI] [PMC free article] [PubMed] [Google Scholar]
- 30. Shen S, Wang H, Xue Y, et al. Freeform fabrication of tissue‐simulating phantom for potential use of surgical planning in conjoined twins separation surgery. Sci Rep. 2017;7:11048. [DOI] [PMC free article] [PubMed] [Google Scholar]
- 31. Toepker M, Euller G, Unger E, et al. Stenosis quantification of coronary arteries in coronary vessel phantoms with second‐generation dual‐source CT: influence of measurement parameters and limitations. Am J Roentgenol. 2013;201:W227–W234. [DOI] [PubMed] [Google Scholar]
- 32. Salah MB, Mitiche A, Ayed IB. Multiregion image segmentation by parametric kernel graph cuts. IEEE Trans Image Process. 2011;20:545–557. [DOI] [PubMed] [Google Scholar]
- 33. Boykov Y, Veksler O, Zabih R. Fast approximate energy minimization via graph cuts. IEEE Trans Pattern Anal Mach Intell. 2001;23:1222–1239. [Google Scholar]
- 34. Boykov Y, Kolmogorov V. An experimental comparison of min‐cut/max‐flow algorithms for energy minimization in vision. IEEE Trans Pattern Anal Mach Intell. 2004;26:1124–1137. [DOI] [PubMed] [Google Scholar]
- 35. van Ginneken B, Baggerman W, van Rikxoort EM. Robust segmentation and anatomical labeling of the airway tree from thoracic CT scans, in International Conference on Medical Image Computing and Computer‐Assisted Intervention, pages 219–226, Springer, 2008. [DOI] [PubMed]
- 36. Pompe E, Van Rikxoort EM, Mets OM, et al. Follow‐up of CT‐derived airway wall thickness: correcting for changes in inspiration level improves reliability. Eur J Radiol. 2016;85:2008–2013. [DOI] [PubMed] [Google Scholar]
- 37. Selle D, Preim B, Schenk A, Peitgen H‐O. Analysis of vasculature for liver surgical planning. IEEE Trans Med Imaging. 21:1344–1357 [DOI] [PubMed] [Google Scholar]
- 38. Dumouchel W, O’Brien F. Integrating a robust option into a multiple regression computing environment In:Computing and Graphics in Statistics. New York: Springer‐Verlag; 1992:41–48. [Google Scholar]
- 39. The Weizmann Institute of Science . Faculty of Mathematics and Computer Science Computer Vision Lab. http://www.wisdom.weizmann.ac.il/~bagon/matlab_code/GCmex1.9.tar.gz. Accessed June 6, 2019.
- 40. GitHub . Chushan89 (Zhiwei Zhai). https://github.com/chushan89/Lung-Vessel-Segmentation-Using-Graphcuts. Accessed June 6, 2019.
- 41. GitHub . ITKTools. https://github.com/ITKTools/ITKTools. Accessed June 24, 2019.
- 42. Weibel ER, Gomez DM. Architecture of the human lung: use of quantitative methods establishes fundamental relations between size and number of lung structures. Science. 1962;137:577–585. [DOI] [PubMed] [Google Scholar]
- 43. Weibel ER. What makes a good lung. Swiss Med Wkly. 2009;139:375–386. [DOI] [PubMed] [Google Scholar]
- 44. Joemai RMS, Geleijns J. Assessment of structural similarity in CT using filtered backprojection and iterative reconstruction: a phantom study with 3D printed lung vessels. Br J Radiol. 2017;90:20160519. [DOI] [PMC free article] [PubMed] [Google Scholar]
- 45. Hernandez‐Giron I, den Harder JM, Streekstra GJ, Geleijns J, Veldkamp WJH. Development of a 3D printed anthropomorphic lung phantom for image quality assessment in CT. Physica Med. 2019;57:47–57. [DOI] [PubMed] [Google Scholar]
- 46. Meijs J, Schouffoer AA, Marsan NA, et al. Therapeutic and diagnostic outcomes of a standardised, comprehensive care pathway for patients with systemic sclerosis. RMD Open. 2016;2:e000159. [DOI] [PMC free article] [PubMed] [Google Scholar]
- 47. Goh NSL, Desai SR, Veeraraghavan S, et al. Interstitial lung disease in systemic sclerosis: a simple staging system. Am J Respir Crit Care Med. 2008;177:1248–1254. [DOI] [PubMed] [Google Scholar]
- 48. Miller MR, Hankinson JATS, Brusasco V, et al. Standardisation of spirometry. Eur Respir J. 2005;26:319–338. [DOI] [PubMed] [Google Scholar]
- 49. Graham BL, Brusasco V, Burgos F, et al. 2017 ERS/ATS standards for single‐breath carbon monoxide uptake in the lung. Eur Respir J. 2017;49:1600016. [DOI] [PubMed] [Google Scholar]
- 50. Kiros R, Popuri K, Low M, Cobzas D, Jagersand M. Automatic Lung Vessel Segmentation via Stacked Multiscale Feature Learning, http://www.cs.toronto.edu/r~kiros/papers/vessel12.pdf
- 51. GrandChallenge . VESSEL12. https://vessel12.grand-challenge.org/Results/. Accessed June 24, 2019.
- 52. Clinical Image Quality Assessment . CLUES. http://clues-iq.blogspot.com/p/main-page.html. Accessed June 24, 2019.
- 53. Klein S, Staring M, Murphy K, Viergever MA, Pluim JP. Elastix: a toolbox for intensity‐based medical image registration. IEEE Trans Med Imaging. 2010;29:196–205. [DOI] [PubMed] [Google Scholar]
- 54. AAPM Special Interest Group in 3D printing (https://www.rsna.org/3D-Printing-SIG/).
- 55. Solomon J, Samei E. Quantum noise properties of CT images with anatomical textured backgrounds across reconstruction algorithms: FBP and SAFIRE. Med Phys. 2014;41:091908-1–091908-12. [DOI] [PubMed] [Google Scholar]
- 56. Nardelli P, Jimenez‐Carretero D, Bermejo‐Pelaez D, et al. Pulmonary Artery‐Vein classification in CT images using deep learning. IEEE Trans Med Imaging. 2018;37:2428–2440. [DOI] [PMC free article] [PubMed] [Google Scholar]
- 57. Payer C, Pienn M, Bálint Z, et al. Automated integer programming based separation of arteries and veins from thoracic CT images. Med Image Anal. 2016;34:109–122. [DOI] [PubMed] [Google Scholar]
- 58. Charbonnier J‐P, Brink M, Ciompi F, Scholten ET, Schaefer‐Prokop CM, Van Rikxoort EM, et al. Automatic pulmonary Artery‐Vein separation and classification in computed tomography using tree partitioning and peripheral vessel matching. IEEE Trans Med Imaging. 2016;35:882–892. [DOI] [PubMed] [Google Scholar]
- 59. Nardelli P, Lanng MB, M⊘ller CB, et al. Accurate measurement of airway morphology on chest CT images In: Image Analysis for Moving Organ, Breast, and Thoracic Images. Berlin: Springer; 2018:335–347, [DOI] [PMC free article] [PubMed] [Google Scholar]
- 60. O’dell WG, Govindarajan ST, Salgia A, et al. Traversing and labeling interconnected vascular tree structures from 3D medical images. in Medical Imaging 2016: Image Processing Vol. 9034, pages 90343C, International Society for Optics and Photonics; 2014.
- 61. Cotes JE, Chinn DJ, Quanjer PH, Roca J, Roca JC, et al. Standardization of the measurement of transfer factor (diffusing capacity). Eur Respir J. 1993;16:41–52. [DOI] [PubMed] [Google Scholar]
Associated Data
This section collects any data citations, data availability statements, or supplementary materials included in this article.
Supplementary Materials
Data S1. Appendix