

Abstract
The evolution of multicellularity set the stage for sustained increases in organismal complexity1–5. However, a fundamental aspect of this transition remains largely unknown: how do simple clusters of cells evolve increased size when confronted by forces capable of breaking intracellular bonds? Here we show that multicellular snowflake yeast clusters6–8 fracture due to crowding-induced mechanical stress. Over seven weeks (~291 generations) of daily selection for large size, snowflake clusters evolve to increase their radius 1.7-fold by reducing the accumulation of internal stress. During this period, cells within the clusters evolve to be more elongated, concomitant with a decrease in the cellular volume fraction of the clusters. The associated increase in free space reduces the internal stress caused by cellular growth, thus delaying fracture and increasing cluster size. This work demonstrates how readily natural selection finds simple, physical solutions to spatial constraints that limit the evolution of group size—a fundamental step in the evolution of multicellularity.
The first step in the transition to multicellularity—prior to the origin of cellular division of labour, genetically regulated development and complex multicellular forms—was the evolution of simple multicellular clusters1–5. Long before simple clusters of cells can evolve traits characteristic of complex multicellularity, they must contend with physical forces—both internal and external—that are capable of breaking cell-cell bonds and thus limit cluster size. This physical challenge is critical for several reasons. First, large size is a likely prerequisite to the evolution of complex multicellularity2,3. Second, these forces act on long length scales that were probably irrelevant to a single-cell ancestor, and are thus evolutionarily novel. Finally, it is unclear how simple multicellular clusters that do not yet possess genetically regulated developmental systems can evolve novel multicellular morphology.
Direct experimental investigation of the early steps in the transition to multicellularity has been challenging, largely because these transitions occurred long ago, and the evolutionary path to multicellularity has been obscured by extinction in most extant lineages9,10. Recently, however, this constraint has been circumvented through experimental evolution of novel multicellular organisms6–8,11, genetic reconstruction of early events12 and experiments comparing extant multicellular taxa with their unicellular relatives13,14.
To examine the biophysical basis of the evolution of increased size in a nascent multicellular organism, we employed the tractable ‘snowflake’ yeast model system6–8. Multicellular snowflake clusters evolved from the unicellular baker’s yeast Saccharomyces cerevisiae under daily selection for rapid settling speed in liquid media6. The resulting snowflake growth form is the consequence of a single mutation in the ACE2 gene7. This mutation prevents cell separation after budding division, and hence causes the growth of fractal-like groups of cells (Fig. 1a). Snowflake yeast readily adapt to selection for large size, settling 28% more rapidly8 by increasing their average radius at fracture by a factor of 1.7 ± 0.4 (Fig. 1b–d) after eight weeks of selection (~330 generations). Although individual cells are larger in week-8 clusters than in their week-1 counterparts—their major axis is, on average, ~23% larger—this change is insufficient to explain the observed increase in cluster size. For the present study, we utilize genotypes isolated from evolving populations after 1, 4, 6 and 8 weeks of selection, as first reported in Ratcliff et al.6. Cluster radius is calculated from the in-plane cluster area, A, by computing an effective radius
Fig. 1|. Snowflake yeast evolve larger size.
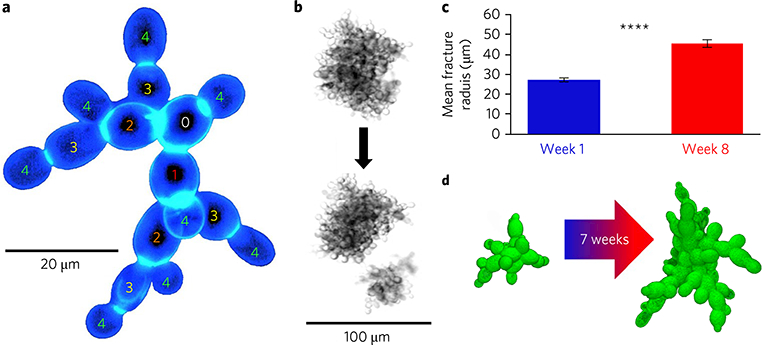
a, Snowflake yeast form fractal-like branched clusters, imaged via fluorescence microscopy. The numbers indicate the relative generational age of cells in this cluster. b, Bright-field images of snowflake yeast fracturing into two independently viable clusters. c,Over seven weeks (~291 generations) of selection for large size, snowflake yeast clusters increase their average maximum radius by a factor of 1.7. d,Three-dimensional confocal images show that week-8 snowflake yeast (right) contain a greater number of larger, more elongate cells than week-1 (left). The error bars in c denote one standard error of the mean; ****P<0.0001.
Snowflake yeast clusters grow by the budding of existing cells, and reproduce by fracturing into two or more independently viable clusters (Fig. 1b). Fracturing limits cluster size, so elucidating the evolution of larger size in snowflake yeast requires first understanding the fracture process. Unfortunately, clusters at the point of spontaneous fracture are too large and dense for light to penetrate, so directly imaging all cells during fracture with optical microscopy is impossible. We circumvented this limitation by using a combined atomic force-bright-field microscope (AFM Workshop LS-AFM) to image and compress individual clusters. Cluster sizes were measured via bright-field microscopy before compression by an AFM cantilever at a rate of ~7.5 μm (~1 cell diameter) every 42 s, during which the applied force was recorded. Precise force-displacement curves were collected for clusters of week-1 (newly multicellular) and week-8 genotypes. Fracture events are readily discernible in these curves by a sudden reduction in applied force of 20% or more (Fig. 2a), allowing for measurements of the applied force and energy input at fracture for a wide range of cluster sizes. Note, the energy input is the work done by the cantilever, calculated by estimating the integral of the force-displacement curve from zero displacement up to the point of fracture.
Fig. 2|. Snowflake yeast fracture due to growth-induced mechanical stress.
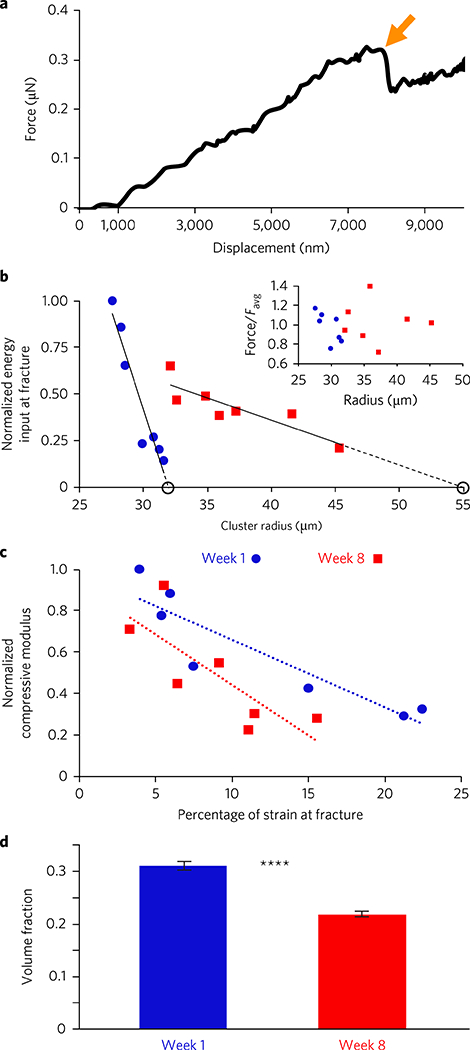
a, Sample AFM force–displacement scan of an individual cluster. The sharp reduction in force (arrow) is indicative of a fracturing event. b, Normalized energy input versus cluster radius for week 1 (blue) and week 8 (red) clusters, with linear extrapolations to the point of zero energy input marked—these extrapolated sizes correspond to expected spontaneous fracture sizes, and are in agreement with independent measurements thereof. Energy input normalized by the maximum measured value. The inset shows force at fracture, normalized by the average. c, Normalized compressive modulus versus percentage of strain at fracture for week-1 (blue) and week-8 (red) clusters. Compressive modulus normalized by the maximum measured value. d, Mean experimentally measured volume fraction for week-1 (blue) and week-8 (red) clusters. Error bars indicate standard error of the mean; ****P< 0.0001.
The applied force at fracture remained relatively constant across both genotypes and all cluster sizes (Fig. 2b, week 1 versus week 8 t = −0.55, P = 0.60, two-tailed t-test). This differs from the behaviour of normal bulk materials, wherein the applied force at fracture—and the number of bonds that must fail to cause fracture—scales with sample size. With snowflake yeast, however, the fractal-like branching structure dictates that breaking a single bond is sufficient to fracture a cluster. These intercellular bonds fail when the force required to further strain them exceeds their ultimate strength6. Thus, the constant force at fracture suggests that bond strength does not vary significantly with cluster size or genotype, in agreement with independent confocal measurements of bond size (Supplementary Fig. 3a).
These mechanical measurements also show that as cluster size increases, energy input at the point of fracture decreases approximately linearly for both week-1 and week-8 clusters, but with different slopes (F3,13 = 29.2, P<0.0001, main effect of cluster radius in an analysis of covariance with normalized energy input at fracture as the response variable and yeast strain as the cofactor, overall r2=0.9. The interaction with the cofactor was highly significant, P<0.0001, indicating that two strains have different regression slopes). This behaviour deviates from that of normal bulk materials, in which the energy input required for fracture increases with size. Strikingly, these linear trends extrapolate to cross zero energy input at cluster sizes that are within one standard deviation of mean spontaneous fracture sizes (Supplementary Fig. 5a). As a decrease in energy input at fracture is often a sign of residual stress in a material15, this suggests that strain accumulation during growth plays a dominant role in determining fracture size (the comparison between snowflake yeast and bulk materials is further explored in the Supplementary Information). We thus sought to investigate whether fracture occurs due to the local accumulation of internal mechanical stress.
By directly observing the fracture process with bright-field microscopy, we found that the propagule—the smaller of two pieces post-fracture—has a mean radius 61% and 62% of the cluster radius prior to fracture, for week 1 and week 8, respectively (Supplementary Fig. 2a). This indicates that fracture events tend to occur deep in the cluster interior. Since we cannot directly observe these events, we instead confined clusters between glass plates with a separation of ~15 μm, and focused on cells that were not in contact with the glass plates. In doing so, we could directly observe stress relaxation associated with intercellular bond failure (see, for example, Supplementary Fig. 2d). Finally, we measured the compressive modulus of clusters of both genotypes. Previous studies demonstrated that the elastic modulus of individual yeast cells is relatively constant with respect to cell size16; if individual snowflake yeast cells behave similarly, the compressive modulus may be expected to increase if interior volume fraction increases17,18. It is important to note that the distribution of cells within clusters is very heterogeneous7,19; cells in the cluster interior are much more crowded than those at the periphery (Fig. 1b,d). We find that week-1 and week-8 snowflake yeast genotypes follow similar trend lines relating compressive modulus to percentage of strain at fracture (Fig. 2c)—where percentage of strain is the distance the cluster is compressed divided by the cluster diameter—indicating that clusters closer to fracture are stiffer. Although indirect, these measurements are all consistent with fracture occurring due to the accumulation of internal stress from cellular growth.
To directly test whether fracture causes clusters to release accumulated stress, we utilize a microscopy-strain-gauge test, common in materials science15. Specifically, we measure the volume of the cluster before fracture, and the combined volume of the cluster (the larger piece post-fracture) and its propagule after fracture. If cells experience little or no mechanical stress, the total volume should remain constant or increase after fracture. However, if clusters experience repulsive mechanical stress due to cellular crowding, then ‘branches’ of cells may be mechanically straightened, and the total volume should decrease after fracture as these branches are allowed to relax. Analysis of fracture events reveals that the total volume of the cluster and propagule—measured using the effective radius defined above—decreases to 94% for both genotypes (P = 0.010 and P = 0.005, for the comparison to the null hypothesis that total volume after fracture is 100%, for week 1 and week 8, respectively, two-tailed t-tests). This decrease in total volume after fracture is consistent with the presence of internal stresses from cellular crowding.
Having established that cluster size is limited by fractureinducing internal stress, we next investigated whether the large cluster-forming week-8 genotype had evolved mechanisms to ameliorate internal stress. While this could be achieved in a myriad of ways, the simplest include raising the fracture threshold or reducing the cell-cell interactions that generate stress. While the former is not observed (Supplementary Fig. 3a), the latter may well result from the measured decrease in volume fraction; that is, the total volume of cells in a cluster divided by the total volume of the cluster itself (Fig. 2d). We find that from week 1 to week 8, the volume fraction of clusters decreases substantially, from 0.32 ± 0.04 to 0.22 ± 0.03 (t = 8.3, P = 6 × 10⁻¹⁰, two-tailed t-test). Decreasing volume fraction may decrease the number of contacts between cells, reducing the amount of internal stress, as previously observed in collections of grains18 and unicellular yeast17. Thus, by reducing the number of cell-cell interactions in week-8 clusters, decreasing volume fraction may also reduce the rate of internal stress accumulation.
How have week-8 clusters evolved a lower volume fraction? A simple cell-level change appears to be largely responsible. Although all S. cerevisiae cells are ellipsoidal20, week-8 cells possess, on average, an 8% larger major-minor aspect ratio than week-1 cells (Fig. 3a; t =−26, P = 3×10−136). Particle shape has been shown to affect numerous systems from randomly packed colloids to biofilms21,22; here we examine the role of cellular aspect ratio on packing within the fractal pole-budding geometry of snowflake yeast. As previous exhaustive experiments7 have validated that the fractal-like snowflake yeast growth form holds for week-1 and week-8 clusters of any size, the role of cell shape becomes a question of geometry. Diploid snowflake yeast grow through axial budding, producing daughter cells on the pole opposite their own mother6,7. Thus, for cells of equal volume, the distal pole of those with higher aspect ratios is further from their parent; this results in less cellular crowding and hence a decrease in volume fraction. Additionally, because the minimum cell-cell spacing is set by the relatively invariant diameter of the circular intracellular chitin bond (Supplementary Fig. 3b), as aspect ratio increases, the amount of deformation of minimally separated cells decreases— this may also contribute to the reduced rate of internal stress accumulation in week 8 clusters.
Fig. 3|. Snowflake yeast evolve to mitigate mechanical stresses by increasing volume fraction.
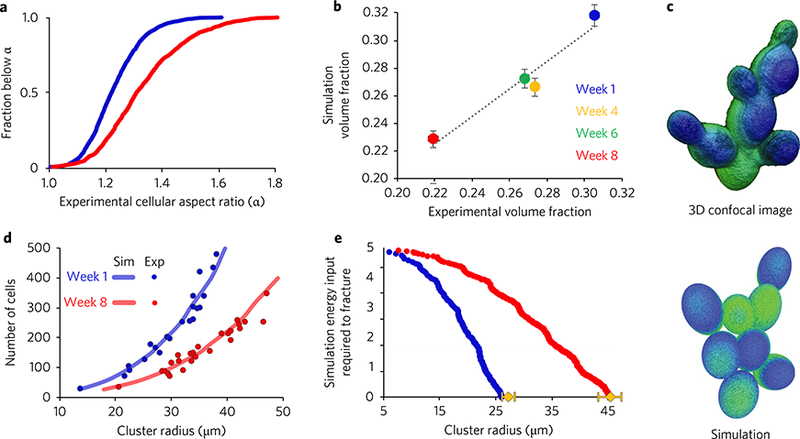
a, Experimentally measured fraction of cells with aspect ratio below α for week-1 (blue) and week-8 (red) genotypes. b, Volume fraction from experiment versus volume fraction from simulation. Week-4 (yellow circle) and week-6 (green circle) samples are included as well. Linear fit slope = 0.998, r2 = 0.94; error bars indicate standard error. c, Visual comparison of a confocal image of a snowflake (top) and a simulation-generated snowflake (bottom). d, The simulation (continuous lines, averaged over 100 unique trials) accurately predicts the number of cells in a cluster observed in experiments (circles, each symbol is a measurement from a different cluster) as a function of radius for both genotypes. e, Simulated energy input required to fracture versus cluster radius. The critical energy threshold was selected using the experimental value for week-8 spontaneous fracture size. Yellow diamonds show the experimentally measured spontaneous fracture size; error bars indicate standard error.
To formally investigate the effect of cell shape on volume fraction, we created a geometric model of the snowflake yeast growth form. Beginning from a single cell, new cells are added generationby-generation; daughter cells are placed at a stochastic location with a polar angle of 45° ± 10% with respect to the distal pole of the parent cell (Supplementary Fig. 8a). Each generation, all cells in the cluster attempt to double. Cells, but not budding sites, may overlap; if a forbidden location is selected, no daughter cell is created and the parent cell does not attempt to reproduce again until the next generation (Supplementary Fig. 8b). All cells have the same volume, and aspect ratio is randomly seeded from the experimentally measured distributions. Although this model lacks dynamics, simply changing the aspect ratio distribution in the simulation recapitulates the change in volume fraction observed experimentally—the slope of the best linear fit between experimental and simulated volume fractions is 0.998, with r2 = 0.94 (Fig. 3b). To better validate our approach, we also measured the distribution of aspect ratios and global volume fractions for genotypes from week 4 and week 6 (Supplementary Fig. 6); it is interesting that the difference between week 8 and week 6 is much greater than that between week 6 and week 4, but a constant rate of change is not expected as evolution is highly stochastic and nonlinear23,24.
This simple model also exhibits remarkable agreement with experiment across several additional properties of snowflake yeast clusters. It reproduces clusters of cells that are structurally similar to snowflake yeast (Fig. 3c), and in addition to volume fraction, correctly predicts the number of cells as a function of radius (Fig. 3d, N = 100 for simulations of week 1 and week 8, N = 21 for week-1 experiments, N = 26 for week-8 experiments). Furthermore, we measured the square of the linear overlap between neighbouring cells, essentially the sum of their radii minus their centre-to-centre separation (Supplementary Fig. 8b). Linear overlap squared is a proxy for elastic energy storage from internal stress, as cells that overlap in the simulation would have displaced each other in a real cluster, and under a harmonic model the energetic cost is proportional to the displacement squared. For clusters created from the week-1 and week-8 aspect ratio distributions, the mean cumulative squared overlap at fracture sizes predicted by the linear extrapolation of the AFM data differs by only 6.5%, with standard error of the means of 2.2% and 2.1% for week 1 and week 8, respectively (week-1 versus week-8 cluster radius at fracture-inducing overlap squared, P = 4.9×10−63, two-tailed t-test). Thus, subtracting the cumulative squared overlap in the simulations from this threshold value (which gives the energy input required to fracture) produces a plot in which relative trends are consistent with the AFM experiments (Figs. 2b and 3e), and gives estimates of the spontaneous fracture size within error bars of experimentally measured values (Supplementary Fig. 5a).
Finally, we investigated packing on a single parent cell; only the original cell adds daughters, but it does so until all available space is occupied. Intriguingly, week-8 parent cells can accommodate an average of only ~5% more daughter cells than week-1 parent cells. However, the total squared overlap of the week-8 daughter cells is ~31% smaller than that of week-1 daughter cells. This indicates that as aspect ratio increases, the amount of internal stress in a cluster decreases, even if the number of cells increases slightly.
By changing only the aspect ratio distributions from which new cells are seeded, our minimal model captures the observed phenotypic properties of evolving snowflake yeast. Despite the presence of numerous layers of biological complexity, these independent tests of our geometric model suggest that it captures critical aspects of snowflake yeast structure. While future experiments capable of directly probing the effect of cell shape on packing are necessary to prove causation, results from the current experiments and simulations offer compelling evidence that cellular elongation plays a significant role in delaying snowflake fracture by decreasing the rate of internal stress accumulation (a more detailed discussion of the evidence for this claim is included in the Supplementary Information).
Multicellularity has evolved in at least 25 independent lineages across a remarkable range of ecologies4,9. Despite this diversity, there is general agreement that, at least initially, these lineages were under strong selection for increased size, due to ecological stresses such as predation25,26, toxin exposure27 or for improved extracellular cooperation11,28. Our work shows how a simple multicellular entity can overcome fundamental physical constraints on size, converging on a solution reminiscent of work on non-living ellipsoidal packings21.
Snowflake yeast are an example of fixed-geometry multicellularity; cells have little ability to move within the organism after they are formed. This type of multicellularity has evolved numerous times (for example, land plants, red, brown and green algae, and fungi), and is one in which simple clusters of cells have relatively few ways in which they can generate novel multicellular morphology. While we observed a change in cell shape, one could imagine that, within the context of a specific multicellular geometry, novel multicellular traits could also be generated through changes in the strength of cellular attachment, budding angle or cell age-specific growth rates. Multicellular development, a key trait in the origin of complex multicellularity, may readily evolve in nascent multicellular lineages when these traits are plastically expressed in a locationspecific manner.
While no single model system can represent the diversity of routes to multicellularity, our work nonetheless highlights the central (and probably conserved) role that evolving novel materials properties play during this major evolutionary transition. Further, it demonstrates the physical basis of multicellular adaptation, showing how simple cell-level changes can guide the emergence of novel collective-level traits. The connections between evolution and mechanical fracture, biological fitness and volume fraction serve as another demonstration of the intertwined nature of biology and physics29.
Methods
Methods, including statements of data availability and any associated accession codes and references, are available at https://doi.org/10.1038/s41567-017-0002-y.
Methods
Snowflake yeast genotypes and growth.
Genotypes used in this study were isolated from the evolution experiment conducted in Ratcliff et al., 20126 after 7, 28, 42 and 60 days of evolution. These genotypes are referred to throughout this manuscript as week 1-, week-4, week-6 and week-8 genotypes, as they were isolated from an evolving population at these time points. During evolution, daily size selection was performed by selecting for fast settling in liquid media.
Daily selection and all measurements described in this paper were performed on clusters grown for approximately 24 h in Yeast Peptone Dextrose medium (10 g l−1 yeast extract, 20 g l−1 peptone and 20 g l−1 dextrose) at 30°C and 250 rpm in a Symphony Incubating Orbital Shaker Model 3500I. All experiments were performed on clusters from stationary phase (24 h) culture to ensure consistency (except those requiring imaging during cluster growth).
To determine the aspect ratios of single cells, the aforementioned genotypes were reverted to unicellularity using the lithium acetate/polyethylene glycol/singlestranded carrier DNA method as described in Ratcliff et al. 20158. Unicellular reversion was accomplished by replacing a single non-functional copy of ace2 (a mutation that arose during settling selection) with a functional, ancestral copy.
These revertants are thus genetically identical to their snowflake counterparts, with the exception that they are capable of normal mother-daughter cellular separation after mitosis, allowing us to make precise measurements of cellular morphology that would have been far more difficult within three-dimensional snowflake clusters (statistics: week 1, N = 2,128; week 4, N = 2,198; week 6, N = 2,219; week 8, N = 1,961).
Chitin bond intensity.
Intercellular chitin bonds were stained with calcoflour (Fluorescent Brightner 28 from MP Biomedicals, LLC) using the following procedure. Clusters from a steady-state culture were rinsed of media and diluted 1:10 with deionized water. Then calcoflour was added at a 1:100 dilution from a stock solution of 1 mg ml−1 calcoflour/water, and this mixture was incubated in the dark at room temperature for at least 5 min. Lastly, the clusters were again rinsed with deionized water to remove any excess calcoflour (rinsing was performed using centrifugation to pellet the clusters and subsequent removal of the supernatant).
To measure bond intensity, confocal z-stack images consisting of nine images at a separation of 0.925 μm were collected on a Nikon A1R confocal. Using the image processing software Fiji, each slice was converted to 16-bit greyscale, so that each pixel had an intensity value between 0 and 65,535. Then the images were combined using the Sum Slices command; after summation, none of the pixels reached saturation. Finally, the intensity of the bond was taken to be the total of all summed pixels constituting the image of the chitin bond.
Measurement of cluster sizes, growth, and propagule ejection.
As snowflake yeast clusters are similarly compact (the number of cells in a cluster increases as r2.80 and r2.72 for week-1 and week-8 genotypes, respectively; Fig. 3d), and large clusters are relatively isotropic, a spherical approximation is a valid measure of cluster size (mean width-to-height ratios of 1.0 ± 0.1 for week-1 and week-8 clusters, N = 10 for each, reported with standard error, P = 0.45 and P = 0.63, for week-1 and week-8, respectively, for two-tailed t-test comparisons to the null hypothesis that the mean cluster aspect ratio is 1.00).
Cluster size when spontaneous fracture occurs (referred to throughout as spontaneous fracture size) and growth rate were obtained via time-series video captured on a Nikon A1R confocal microscope, operating in bright-field mode. Images of unconfined clusters growing in nutrient-rich media were captured every few minutes.
From analysis of individual fracture events, spontaneous fracture size and size of the resulting propagules were obtained. Twenty and sixteen fracture events were analysed for week-1 and week-8 genotypes, respectively. To observe fracture at the cellular level (impossible in large clusters due to light scattering), small clusters were confined to a chamber whose height was on the order of 3 cell diameters (~15 μm).
The distributions of cluster sizes in a population were also measured via flow cytometry. A population of snowflake yeast clusters was grown for 24 h in 10 ml of YPD liquid media and then analysed on the FL2 channel (580/50 nm) of a Sysmex Cyflow Cube 6 flow cytometer. The samples analysed contained 16,042 and 22,618 week-1 and week-8 clusters, respectively.
AFM compression.
The AFM measurements reported in the main text above were performed on an AFM Workshop Life Sciences model (LS-AFM) atomic force microscope by placing a dilute suspension of snowflake yeast clusters between a glass slide and a small piece of VWR plastic wrap (catalogue item number 46610–056) and compressing individual clusters with an AppNano AFM probe (SPM Probe model ACLA: L = 225 μm, W = 40 μm, k = 36–90 N m−1). To ensure that our results were not impacted by the presence of the plastic wrap, the experiments were repeated in an aqueous environment using the LS-AFM Dunk ‘n’ Scan attachment.
For these experiments, Tipless AppNano cantilevers (part no. FORTA-TL: L = 225 μm, W = 27 μm, k = 0.6–3.7 N m−1) were used to reduce extraneous interactions with a tip. On a glass surface, clusters readily slide out from beneath the cantilever during compression. To prevent this, clusters were confined in-plane by 54 and 90 μm square Pelco TEM grid cells.
Volume fraction.
To measure volume fraction, snowflake yeast clusters were stained with CellTracker Blue vacuole stain (ThermoFisher Scientific catalogue no. C2110). Approximately 12 μl of a dilute sample of stained snowflake yeast clusters suspended in water was placed beneath an 18 μm square coverslip on a glass slide. Images of individual clusters were taken and their in-plane area was measured. From this area, radius was calculated as , where r is radius and A is area; volumes were calculated using this radius and a spherical approximation.
Gradual evaporation of the water caused surface tension to pull the coverslip closer to the slide, compressing the snowflake clusters to a monolayer of cells. Cells were then counted via maxima identification in Fiji. Finally, volume fraction was calculated by multiplying the number of cells by the mean volume of a cell (see below for details) and then dividing by the volume of the cluster.
Calculations.
Cluster radius , where A is the in-plane area measured via microscopy.
Energy input at fracture =,where f is the applied force at fracture and d is the displacement of the cantilever. As the f-d curves are essentially linear, this is a valid approximation of the total energy input.
Compressive modulus =
Cell volume , where width (W) and length (L) are mean values across the population—single-cell properties determined from genotypes reverted to unicellularity as described above in the section entitled Snowflake yeast genotypes and growth.
Volume fraction = (Ncell*Vcell) / Vcluster, where Ncell is the number of cells, Vcell is cell volume (see Cell volume calculation) and Vcluster is the volume of the cluster approximated from the cluster radius (see Cluster radius (r) calculation).
All P values from t-tests are two-tailed.
Simulation.
Snowflake yeast are modelled as prolate spheroids in a geometric Python program. The program has a number of controllable parameters including size, allowed overlap, angle of attachment and aspect ratio.
In general, the program constructs a model of a snowflake yeast cluster one generation at a time starting with an initial ‘basal’ parent cell. Each generation, every cell in the cluster is given the opportunity to attempt reproduction. A parent cell can spawn a daughter cell only if the centre-to-centre distance between the prospective daughter cell and its neighbours is less than a specified amount, which we call the overlap parameter. For the experiments reported here, the overlap parameter was set to 50% of the cell’s in-plane radius. This value was chosen as it approximates the minimum spacing set by the size of the chitin bonds. However, changing the overlap parameter does not qualitatively change the phenomena reported, it simply changes the magnitude of the effect.
The location on a parent cell at which a daughter is spawned is determined via the following protocol. Each cell, except the basal cell, has an 80% chance of spawning its first daughter at the distal pole (that is, directly opposite its own point of attachment) and a 20% chance of spawning a cell at a specified ‘angle of attachment’ (Supplementary Fig. 6). Subsequent daughters are spawned at a random location at this specified angle of attachment. Additionally, the model incorporates stochastic random variance (up to 10%) in the angles at which daughters are spawned. This helps to create clusters that realistically imitate the stochasticity of their biological counterparts. For the results reported here, the angle of attachment was set to 45°, which is similar to what is observed experimentally (42.4° with standard deviation of 10°, N = 20 for both week 1 and week 8). Again, varying the angle of attachment (between 22.5 and 60°) changed only the magnitude of the results, not the qualitative trends.
To quickly determine the degree to which two cells overlap, we utilize a mathematical procedure to fill each ellipsoidal cell with five spheres that mimic the shape and extension of the cell. These spheres are concentric with the ellipsoid’s centre, foci and midpoints between the centre and the foci, and their radii are equal to that of the circular cross-section of the ellipsoid at their location. To measure overlap, the centre-to-centre distance, d, is compared with the sum of the radii of each pair of intercellular spheres, r1 + r2.
From the overlap between two cells, the effective elastic energy, Ueff, was calculated using both harmonic:
and Hertzian models:
Supplementary Material
Acknowledgements
This work was supported by NASA Exobiology grant no. NNX15AR33G to W.C.R., NSF grant no. IOS-1656549 to W.C.R. and P.J.Y., and a Packard Foundation Fellowship for W.C.R. We would like to thank J. Weitz and D. Yanni for helpful comments.
Footnotes
Author contributions
S.J., W.C.R. and P.J.Y. planned this research. S.J., J.T.P. and C.G.B. performed all experiments. S.J. and C.G.B. analysed the AFM and microscopy data. E.C.G. wrote the geometric simulation; E.C.G., S.J. and P.J.Y. analysed the simulation data. S.J. and P.J.Y. wrote the first draft of the paper; all authors contributed to revision.
Competing interests
The authors declare no competing financial interests.
Additional information
Supplementary information is available for this paper at https://doi.org/10.1038/s41567–017-0002-y.
Reprints and permissions information is available at www.nature.com/reprints.
Publisher’s note: Springer Nature remains neutral with regard to jurisdictional claims in published maps and institutional affiliations.
Data availability.
The data that support the plots within this paper and other findings of this study are available from the corresponding author upon request.
References
- 1.Buchanan M Simple yet successful. Nat. Phys 13, 720 (2017). [Google Scholar]
- 2.Transtrum MK et al. Perspective: sloppiness and emergent theories in physics, biology, and beyond. J. Chem. Phys 143, 010901 (2015). [DOI] [PubMed] [Google Scholar]
- 3.Mattingly HH, Transtrum MK, Abbott MC & Machta BB Rational ignorance: simpler models learn more information from finite data. Preprint at https://arxiv.org/abs/1705.01166 (2017). [DOI] [PMC free article] [PubMed]
- 4.Szathmary E & Smith JM The major evolutionary transitions. Nature 374, 227–232 (1995). [DOI] [PubMed] [Google Scholar]
- 5.Kirk DL A twelve-step program for evolving multicellularity and a division of labor. Bioessays 27, 299–310 (2005). [DOI] [PubMed] [Google Scholar]
- 6.Willensdorfer M Organism size promotes the evolution of specialized cells in multicellular digital organisms. J. Evol. Biol 21, 104–110 (2008). [DOI] [PMC free article] [PubMed] [Google Scholar]
- 7.Bonner JT The origins of multicellularity. Integr. Biol 1,27–36 (1998). [Google Scholar]
- 8.Fairclough SR, Dayel MJ & King N Multicellular development in a choanoflagellate. Curr. Biol 20, R875–R876 (2010). [DOI] [PMC free article] [PubMed] [Google Scholar]
- 9.Ratcliff WC, Denison RF, Borrello M & Travisano M Experimental evolution of multicellularity. Proc. Natl Acad. Sci. USA 109, 1595–1600 (2012). [DOI] [PMC free article] [PubMed] [Google Scholar]
- 10.Ratcliff WC, Fankhauser JD, Rogers DW, Greig D & Travisano M Origins of multicellular evolvability in snowflake yeast. Nat. Commun 6, 6102 (2015). [DOI] [PMC free article] [PubMed] [Google Scholar]
- 11.Ratcliff WC, Pentz JT & Travisano M Tempo and mode of multicellular adaptation in experimentally evolved Saccharomyces cerevisiae. Evolution 67, 1573–1581 (2013). [DOI] [PubMed] [Google Scholar]
- 12.Grosberg RK & Strathmann RR The evolution of multicellularity: A minor major transition? Annu. Rev. Ecol. Evol. Syst 38, 621–654 (2007). [Google Scholar]
- 13.Herron MD, Hackett JD, Aylward FO & Michod RE Triassic origin and early radiation of multicellular volvocine algae. Proc. Natl Acad. Sci. USA 106, 3254–3258 (2009). [DOI] [PMC free article] [PubMed] [Google Scholar]
- 14.Koschwanez JH, Foster KR & Murray AW Improved use of a public good selects for the evolution of undifferentiated multicellularity. eLife 2, e00367 (2013). [DOI] [PMC free article] [PubMed] [Google Scholar]
- 15.Hanschen ER et al. The Gonium pectorale genome demonstrates co-option of cell cycle regulation during the evolution of multicellularity. Nat. Commun 7, 11370 (2016). [DOI] [PMC free article] [PubMed] [Google Scholar]
- 16.Kirkegaard JB, Bouillant A, Marron AO, Leptos KC & Goldstein RE Aerotaxis in the closest relatives of animals. eLife 5, e18109 (2016). [DOI] [PMC free article] [PubMed] [Google Scholar]
- 17.Anderson DP et al. Evolution of an ancient protein function involved in organized multicellularity in animals. eLife 5, e10147 (2016). [DOI] [PMC free article] [PubMed] [Google Scholar]
- 18.Withers P Ja B & Bhadeshia HKDH Residual stress part 1 - measurement techniques. Mater. Sci. Technol 17, 355–365 (2001). [Google Scholar]
- 19.Ahmad MR, Nakajima M, Kojima S, Homma M & Fukuda T The effects of cell sizes, environmental conditions, and growth phases on the strength of individual W303 yeast cells inside ESEM. IEEE Trans. Nanobiosci 7, 185–193 (2008). [DOI] [PubMed] [Google Scholar]
- 20.Delarue M et al. Self-driven Jjamming in growing microbial populations. Nat. Phys 12, 762–766 (2016). [DOI] [PMC free article] [PubMed] [Google Scholar]
- 21.O’Hern CS, Silbert LE, Liu AJ & Nagel SR Jamming at zero temperature and zero applied stress: the epitome of disorder. Phys. Rev. E 68, 011306 (2003). [DOI] [PubMed] [Google Scholar]
- 22.Libby E, Ratcliff W, Travisano M & Kerr B Geometry shapes evolution of early multicellularity. PLoS Comput. Biol 10, e1003803 (2014). [DOI] [PMC free article] [PubMed] [Google Scholar]
- 23.Sheu YJ, Barral Y & Snyder M Polarized growth controls cell shape and bipolar bud site selection in Saccharomyces cerevisiae. Mol. Cell. Biol 20, 5235–5247 (2000). [DOI] [PMC free article] [PubMed] [Google Scholar]
- 24.Donev A et al. Improving the density of jammed disordered packings using ellipsoids. Science 303, 990–993 (2004). [DOI] [PubMed] [Google Scholar]
- 25.Smith WP et al. Cell morphology drives spatial patterning in microbial communities. Proc. Natl Acad. Sci. USA 114, E280–E286 (2017). [DOI] [PMC free article] [PubMed] [Google Scholar]
- 26.Lenski RE & Travisano M Dynamics of adaptation and diversification: a 10,000-generation experiment with bacterial populations. Proc. Natl Acad. Sci. USA 91, 6808–6814 (1994). [DOI] [PMC free article] [PubMed] [Google Scholar]
- 27.Gerrish PJ & Lenski RE The fate of competing beneficial mutations in an asexual population. Genetica 102–103, 127–144 (1998). [PubMed] [Google Scholar]
- 28.Kessin RH, Gundersen GG, Zaydfudim V & Grimson M How cellular slime molds evade nematodes. Proc. Natl Acad. Sci. USA 93, 4857–4861 (1996). [DOI] [PMC free article] [PubMed] [Google Scholar]
- 29.Boraas ME, Seale DB & Boxhorn JE Phagotrophy by a flagellate selects for colonial prey: A possible origin of multicellularity. Evol. Ecol 12, 153–164 (1998). [Google Scholar]
- 30.Smukalla S et al. FLO1 is a variable green beard gene that drives biofilm-like cooperation in budding yeast. Cell 135, 726–737 (2008). [DOI] [PMC free article] [PubMed] [Google Scholar]
- 31.Pfeiffer T & Bonhoeffer S An evolutionary scenario for the transition to undifferentiated multicellularity. Proc. Natl Acad. Sci. USA 100, 1095–1098 (2003). [DOI] [PMC free article] [PubMed] [Google Scholar]
- 32.Ornes S Core concept: how nonequilibrium thermodynamics speaks to the mystery of life. Proc. Natl Acad. Sci. USA 114, 423–424 (2017). [DOI] [PMC free article] [PubMed] [Google Scholar]
Associated Data
This section collects any data citations, data availability statements, or supplementary materials included in this article.