Abstract
Synthesized thiolate boronic acid was found to complex with both a polysaccharide (dextran) and a monosaccharide (glucose) with similar affinities but displayed more affinity with dextran than with glucose when capped as a ligand on silver nanoparticle. Coupling on multiple sites of dextran, the silver particles were aggregated. The aggregated particles displayed a decrease of absorbance at 397 nm and an increase at 640 nm. Luminescence intensity displayed an upward deviation increase with the concentration of dextran. The luminescence spectral change was ascribed to surface-enhanced fluorescence by the enhanced field from the aggregated metallic particles.
Keywords: Silver nanoparticle, Thiolate boronic acid, Dextran, Glucose, Aggregation, Surface-enhanced fluorescence (SEF), Complexation, Absorbance spectroscopy
The accurate detection of carbohydrates is of interest for improving long-term health care [1–10] Numerous efforts have been made using spectroscopic methods such as absorbance and luminescence to investigate carbohydrate binding to labeled organic compounds [11–13] or superstructures [14]. Boronic acid derivatives are attractive because of their high affinity with diolcontaining compounds to convert to boronate esters [15–18], and the conversions are generally accompanied with obvious luminescence spectral changes [19–26]. The boronic acids also display different affinities with various carbohydrates, allowing for selective detection. It should be interesting to anchor boronic acids to a superstructure to develop a highly sensitive approach for the selective detection of carbohydrates.
Metallic nanoparticles have been widely investigated for use in nanoscale devices which bind biological materials [27–30]. Organic monolayer-protected metallic nanoparticles are particularly attractive for their chemical stability and quantitative control of multiple functionalization [31–37]. N-(2-mercaptopropionyl)glycine (abbreviated as tiopronin)-coated silver particles have been reported to display a good stability and solubility in water [36,37]. They were prepared and underwent a ligand exchange by thiolate boronic acids. The boronic acids capped on metallic cores were coupled with polysaccharides (dextran 3000) and monosaccharides (glucose).
The silver particles were reported to cause surface-enhanced fluorescence (SEF)1, [38–40] which was attributed to an enhanced field near the silver surface. The enhanced field should be overlapped when two silver particles were coupled, and the fluorophores localized in the overlapped field were expected to exhibit a stronger luminescence spectroscopy [41]. When this principle was used to develop a novel method for selective detection of polysaccharide/monosaccharide, the monosaccharide was expected to couple with only one particle (without an aggregation), while the polysaccharide would resulted in multisite coupling (with an aggregation). The boronic acid derivatives, which worked as fluorophores to conjugate on aggregated particles, could display a stronger SEF feature for the polysaccharide. In other words, the boronic acid capped on the silver nanoparticle had a higher detective sensitivity for the polysaccharide. This method may help to facilitate the study of complex macromolecular structures such as glycoproteins, which have a substantial polysaccharide component.
Experimental procedures
Chemicals
All reagents (Aldrich), spectroscopic-grade solvents (Fisher, Aldrich), and deuterated solvents (Aldrich) were used as received. Dextran 3000 was commercially available from Molecular Probes. Organic reactions were monitored by thin-layer chromatography on 0.25-mm Merck silica gel plates, while Baxter silica gel 60 Å (230–400 mesh ASTM) was used for flash column chromatography.
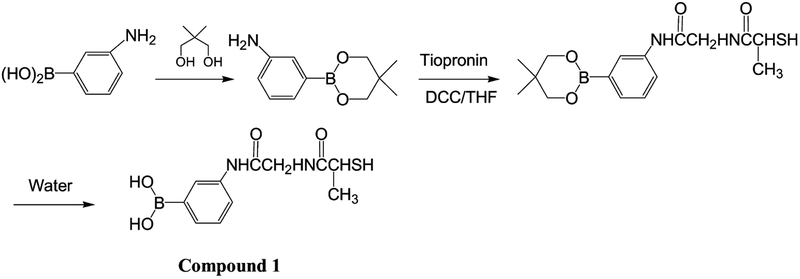
N-{[3-(dihydroxylborinan-2-yl)-phenylcarbamoyl]-methyl}−2-mercapto-propionamide was synthesized through the routine described in Scheme 1 [42,43]. A mixture of 3-amino-phenyl-bronic acid (1.4 g, 10 mmol) and 2,2-dimethyl-propane-diol (1.0 g, 10 mmol) in 50 mL anhydrous THF was refluxed for 12 h using molecular sieves to remove water. Evaporating the solvent under vacuum, the residue was chromographed on silica using CH2Cl2/methanol (v/v = 10/1) to collect 1.3 g 3-(5,5-dimethyl-[1,3,2]dioxaborinan-2-yl)-phenylamine. The yield was 32%. 1H NMR (CD3OD): 7.61 (d, 2H), 7.40 (s, 1H), 7.31 (s, 1H), 3.52 (s, 4H), 1.35 (s, 6H) ppm; 13C NMR (CD3OD): 143.2, 130.5, 130.1, 121.6, 115.3, 114.6, 66.7, 33.8, 20.4 ppm. 3-(5,5-dimethyl-[1,3,2]dioxaborinan-2-yl)-phenylamine (0.41 g, 2 mmol) was condensed with tiopronin (0.33 g, 2 mmol) in 20 mL anhydrous THF using 1,3-dicyclohexylcarbodiimide (DCC, 0.45 g, 2.1 mmol) as the condensation reagent at room temperature for 12 h. Removing insoluble solids by filtration, the solvent was removed by rotator evaporation. The residue was purified by chromography on silica with CH2Cl2/methanol (v/v = 10/1). It was then hydrolyzed in water for 2 h. Removing water under vacuum, the residue was chromographed on silica using CH2Cl2/methanol (v/v = 10/1). The yield was 40%. 1H NMR (D2O): 7.65 (d, 2H), 7.33 (s, 1H), 7.23 (s, 1H), 3.85 (m, 1H), 3.63 (s, 2H), 1.73 (d, 3H) ppm; 13C NMR (D2O): 159.1, 148.3, 141.1, 130.5, 129.1, 122.9, 118.6, 118.1, 43.2, 32.9, 22.7 ppm. HRMS: calculated for: C11H15BN2O4S: 282.0846; found: 282.0830.
Scheme 1.
Synthesis routine of thiolate boronic acid.
Tiopronin-coated and mixed monolayer silver nanoparticles
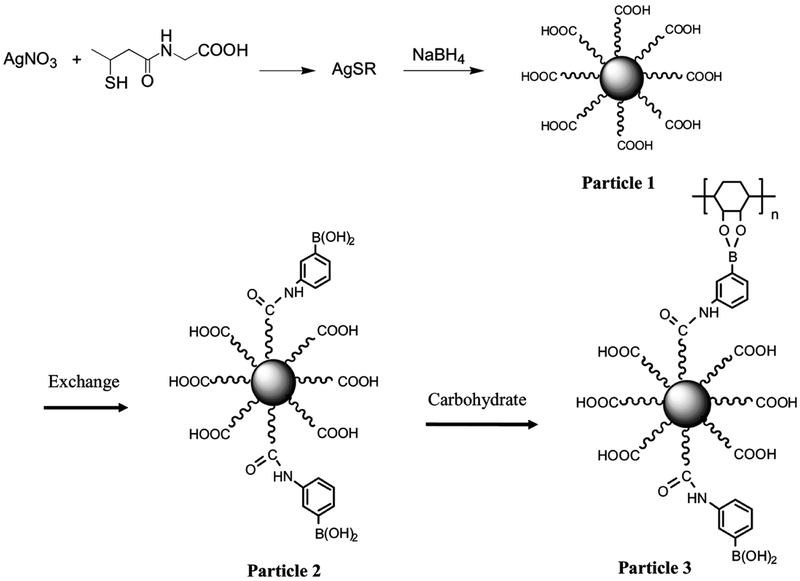
Tiopronin-coated silver nanoparticles (Scheme 2, particle 1) were prepared using a modified Brust reaction [36,37,44] with a 1:1 mole ratio of tiopronin and silver nitrate in methanol. The mixed monolayer nanoparticles (particle 2) were obtained by stirring in an aqueous solution containing 1:5 mole ratios of thiolate boronic acid : tiopronin ligand on particle 1 for 72 h at room temperature. Water was removed under vacuum and the residue was washed with methanol to remove uncapped thiolate compounds. The mixed monolayer compositions were assessed by 1H NMR spectra with a ratio of aromatic protons and methyl on the tiopronin [32].
Scheme 2.
Preparation of tiopronin-monolayer-protected silver nanoparticle, ligand exchange by compound 1, and coupling with saccharide.
Coupling with glucose and dextran
Particle 2 (1 mg/mL in water) was mixed with dextran 3000 (100 μg/mL) or glucose (1 mg/mL) in water by various mole ratios, and pH value of solution was adjusted by 1.0 mM HCl or NaOH aqueous solution. The experimental conditions for dextran coupling are listed in Table 1.
Table 1.
Experimental conditions for dextran in water and its mole ratios with boronic acid–capped silver particles (concentration = 5.8 × 10⁻⁸)
| Carbohydrate units (μM)a | 0.056 | 0.11 | 0.22 | 0.33 | 0.56 | 0.78 | 1.1 |
| Particle 2/ carbohydrate units | 1.1 | 0.53 | 0.26 | 0.18 | 0.11 | 0.076 | 0.053 |
Each dextran 3000 chain was composed of average 17 carbohydrate units.
Spectra
1H NMR spectra were recorded on a GE-QE 300 spectrometer. Absorption spectra were monitored with a Hewlett–Packard 8453 spectrophotometer in 1-cm quartz cells. Luminescence spectra were recorded with a Cary Eclipse Fluorescence Spectrophotometer. Time-resolved intensity decays were measured using reverse start–stop time-correlated single-photon counting with a Becker and Hickl gmbh 630 SPC PC card and an unamplifed MCP-PMT. Vertically polarized excitation at ≈372 nm was obtained using a pulsed LED source (1 MHz repetition rate) and a dichroic sheet polarizer. The instrumental response function was approx1.1 ns fwhm. The emission was collected at the magic angle (54.7°), using a long-pass filter (Edmund Scientific), which cut off wavelengths below 420 nm. Transmission electron micrographs (TEM) were taken with a side-entry Philips electron microscope operated at 120 keV. Samples were cast from water solutions onto standard carbon-coated (200–300 Å) Formvar films on copper grids (400 mesh).
Results and discussion
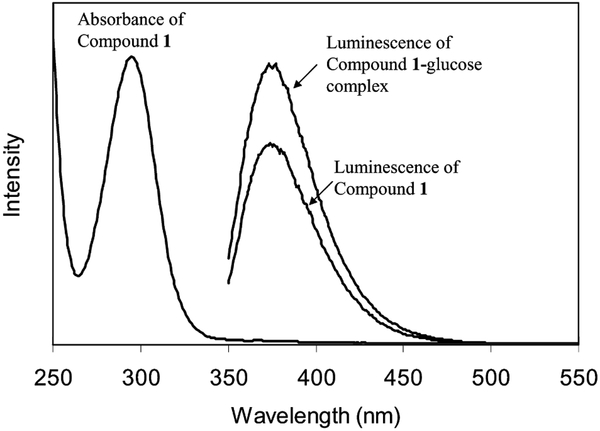
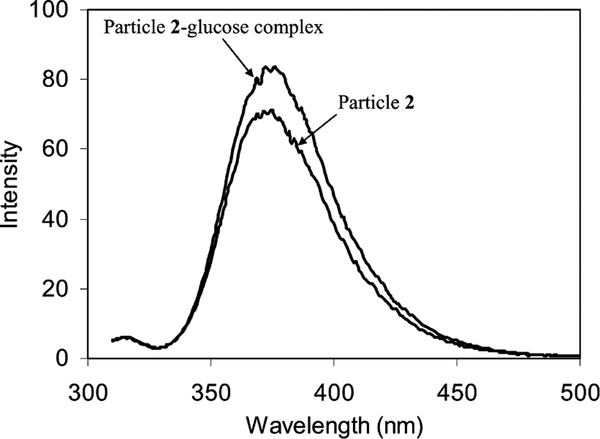
Thiolate boronic acid (compound 1) was prepared by condensation from 3-aminophenyl boronic acid and tiopronin using DCC as the condensation reagent (Scheme 1). To avoid a reaction of boronic acid with DCC, the boronic acid was protected by 2,2-dimethyl-propane-diol and then deprotected in water after condensation. The final product was dissolved in alcohol and water. It displayed an absorbance maximum at 296 nm in water and a fluorescence peak at 377 nm upon excitation at 300 nm (Fig. 1). Compound 1 could be coupled with either the monosaccharide (glucose) or the polysaccharide (dextran) converting to boronate ester, and the luminescence intensities increased to 40 or 50% when the concentration of carbohydrate units in solution was 10 times higher than that of boronic acid. Their association constants with saccharides were estimated to be 3.3 × 10³ and 4.9 × 10³ M−1 based on the relation between the luminescence intensity and the concentration of carbohydrate units (Table 2) [19]. The selectivity was 1.5 for dextran over glucose.
Fig. 1.
Absorbance and luminescence spectra of compound 1 and luminescence spectrum of compound 1–glucose complex upon excitation at 300 nm in water.
Table 2.
Complexation of uncapped compound 1 and its capped silver nanoparticle with glucose and dextran
| Keq with glucose (M−1) | Keq with dextran (M−1) | Selectivity | Fluorescence intensity changesa | |
|---|---|---|---|---|
| Uncapped compound 1 | 3.3 × 10³ | 4.9 × 10³ | 1.5 | 0.4 |
| Particle 2 | 1.6 × 10³ | 1.7 × 10⁴ | 11 | 1.9 |
Fluorescence intensity changes (ΔI/I0) upon binding of dextran.
The silver nitrate reacted with tiopronin to yield thiolate salt (Scheme 2), and the thiolate salt was reduced by NaBH4 to form the tiopronin-protected particle (particle 1). Because NaBH4 was excess in the preparation, the tiopronin ligands coated on metallic cores were expected to be deprotonated. The average diameter of metallic cores was 5 nm [41], so the particle was composed of Ag1082(Tio)453 prior to ligand exchange [35]. A portion of tiopronin ligands on particle 1 was displaced by thiolate boronic acids through a 1:1 ligand exchange to yield a mixed monolayer particle (particle 2). The composition of mixed monolayer was detected by 1H NMR spectroscopy, showing that approximately 1% of the tiopronin ligands was displaced by the boronic acids as Ag1082(Tio)413(compound 1)40.
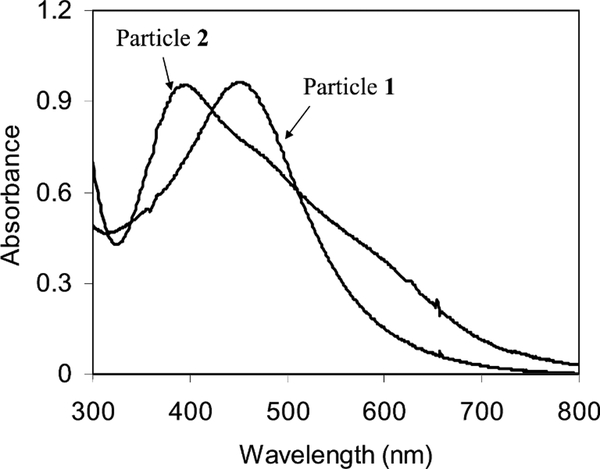
Particle 1 exhibited a plasmon absorbance at 453 nm in water (Fig. 2) and no obvious luminescence upon excitation at 300 nm. After the ligand exchange, the plasmon absorbance of particles 2 was blue-shifted to 398 nm, indicating that the plasmon absorbance was sensitive to the monolayer composition [45].
Fig. 2.
Absorbance spectra of particles 1 and 2 (5.8 × 10⁻⁸+M) in water.
The uncapped compound 1 could be coupled with glucose at neutral conditions but not when capping on the metallic core. When the carboxylic acid was protonated at pH 5, the complexation was observed to occur by a luminescence intensity enhancement to 20% (Fig. 3), implying that this feature of ligands were responsible for the complexation. Such luminescence intensity enhancement was lower than that of uncapped compound 1 (40% in Fig. 1). It was hence suggested that the boronic acid had a weaker affinity with glucose after capping on the particle. Absorbance spectral change was not observed. Although two-site complexation of diboronic acid with one glucose molecule has been reported [17], the particle–glucose complex did not show aggregated particles on TEM images, suggesting that the glucose could not form two-site association on different particles.
Fig. 3.
Luminescence spectral change of particle 2 (5.8 × 10⁻⁸ M) before and after coupling by glucose (2.5 × 10⁻⁵ M) at pH 5 in water.
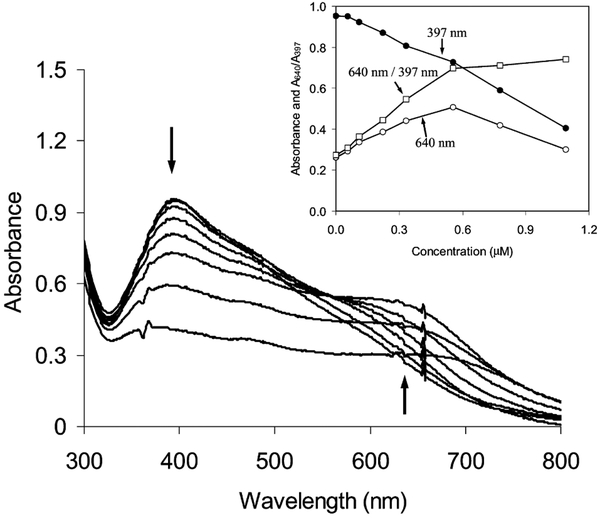
Contrary to glucose, dextran displayed a stronger affinity with particle 2 even under neutral conditions. It was first verified by absorbance spectral change (Fig. 4), which displayed a decrease of plasmons at 398 nm and a simultaneous rising at 640 nm, which was due to the aggregation of particles 2 on the dextran chain [46,47]. The aggregation of particles depended on the mole ratio of particle/dextran in solution (concentration of particle = 5.9 × 10⁻⁸ M). The absorbances at 398 and 640 nm and the ratio of absorbance at 640/398 nm were plotted against the carbohydrate unit concentration of dextran (inset of Fig. 4). When the carbohydrate unit concentration of dextran was low (Table 1, 1.1 × 10⁻⁷ M, mole ratio of particle/carbohydrate unit = 0.53), only a few particles were aggregated. The aggregation increased with the concentration of dextran. At a carbohydrate unit concentration 5.6 × 10⁻⁷ M, the mole ratio of particle/carbohydrate unit decreased to 0.11 and almost all particles were aggregated. The aggregation of particles resulted in a decrease of absorbance at 397 nm, an increase at 640 nm, and an increase of the ratio of absorbance at 640/398 nm. The absorbance at 640 nm and the ratio of absorbance at 640/398 nm began to decrease when the concentration of carbohydrate units was higher than 5.6 × 10⁻⁷ M. This was probably due to the larger aggregates, which resulted in inhomogeneity and light scattering in solution.
Fig. 4.
Absorbance spectral change of particle 2 (5.8 × 10⁻⁸ M) on the dextran concentration after 2 h reaction in water. The inset represents plots of absorbances at 397 and 640 nm and absorbance ratio of 640/397 nm with the concentration of carbohydrate units of dextran.
The association constant of the particle–dextran complex was calculated based on the absorbance change (Table 2). This value was even higher than that of uncapped compound 1. The association constant of dextran over glucose was about 11, seven times higher than that of uncapped compound 1. The boronic acid capped on silver particles displayed a higher selectivity to the polysaccharide.
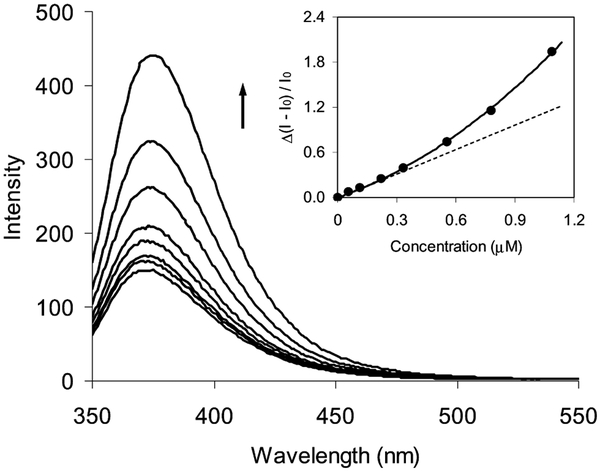
Particle 2 displayed a luminescence maximum at 397 nm upon excitation at 300 nm (Fig. 5), about a 20-nm redshift from the uncapped compound 1 in water. The intensity increased with the concentration of carbohydrate units and showed an upward deviation (inset of Fig. 5). The enhancement was expected to be dependent on the presence of an enhanced field on the surface of the particle [48]. Relative to the single particles, the fields between the coupling particles were expected to become stronger by their overlapping, and the fluorophore in the overlapped field displayed a considerably stronger luminescence enhancement. Our previous results also revealed that the aggregated particles could lead to a stronger SEF than the single particle [47]. Therefore, the luminescence intensity displayed an upward deviation from a linear relationship with the concentration of dextran. This also provided a possible method to improve detection sensitivity.
Fig. 5.
Luminescence spectral change of particle 2 on the dextran concentration after 2 h coupling in water. The inset represented the increase of luminescence intensity at 375 nm with the concentration of carbohydrate units of dextran in water.
The fluorophore near the metal surface is known to be strongly quenched by the metallic surface, but it is enhanced when beyond the quenching region [49,50]. This enhancement depends on two major factors: an enhanced field and an increase in the intrinsic decay rate of fluorophore. The first factor provides stronger excitation rates, and the second factor changes the quantum yield and lifetime of the fluorophore. The decay time hence was an important contributing factor to consider for surface-enhanced fluorescence. The intensity decays were analyzed with regard to the multiexponential model,
| (1) |
where αi are the amplitudes and τi the decay time, and Σαi = 1.0. The fractional contribution of each component to the steadystate intensity is given by
| (2) |
The mean lifetime of the excited state is given by
| (3) |
and the amplitude-weighted lifetime is given by
| (4) |
The values of αi and τi were determined by nonlinear least squares impulse reconvolution with a goodness-of-fit criterion. The decay times are listed in Table 3. The decay curve for uncapped compound 1 was analyzed with a two-exponential function, and such analysis was also fitting for the dextran–particle complexes, indicating that the boronic acids were capped homogenously on the metallic core. The decay time of boronic acid on a silver core was shorter than that of the uncapped compound 1, which was probably due to quenching from the silver surface. The decay time also decreased with an increase in dextran concentration. The dextran could not quench fluorophores in solution, so the decrease of decay time was due to the aggregation of particles rather than to the quenching effect. Considering that the aggregation could result in an increase of the luminescence intensity, the decrease in decay time with the dextran concentration was ascribed to the overlapped field by the aggregated particles.
Table 3.
Data obtained using the multiexponential model when the concentration of particle 2 was 5.8 × 10⁻⁸ M in water
| Sample | τ1,2 (ns) | α1,2 | <τ> (ns) | χ2 | |
|---|---|---|---|---|---|
| Compound 1 | 1.71 (0.095) | 0.2256 | 5.72 | 5.07 | 0.99 |
| 6.05 (0.075) | 0.7744 | ||||
| Particle 2 | 1.47 (0.0551) | 0.1459 | 4.95 | 4.59 | 1.07 |
| (0M dextran) | 5.12 (0.0734) | 0.8541 | |||
| Particle 3 | 1.64 (0.1682) | 0.2403 | 4.87 | 4.34 | 0.92 |
| (1.1 × 10⁻⁷ M dextran) | 5.19 (0.0771) | 0.7599 | |||
| Particle 3 | 1.42 (0.0685) | 0.2233 | 4.93 | 4.36 | 0.90 |
| (2.2 × 10⁻⁷ M dextran) | 5.21 (0.0435) | 0.7767 | |||
| Particle 3 | 1.29 (0.0573) | 0.2817 | 4.69 | 3.98 | 0.97 |
| (3.3 × 10⁻⁷ M dextran) | 5.03 (0.0388) | 0.7183 | |||
| Particle 3 | 1.05 (0.0577) | 0.2460 | 4.53 | 3.86 | 1.08 |
| (7.8 × 10⁻⁷ M dextran) | 4.78 (0.0405) | 0.7540 |
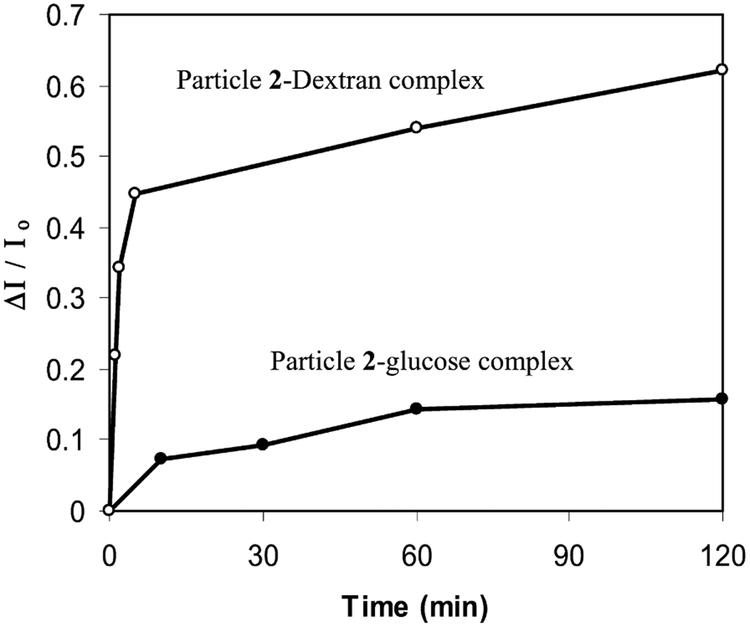
Time-dependent absorbance and luminescence spectral changes could be used to analyze the complexation kinetic of particles 2 with carbohydrates. The absorbance spectra showed a decrease of plasmon absorbance at 397 nm and a simultaneous rise at 640 nm with the time when the particles 2 were coupled with dextran. Compared with the uncapped 1, which was completed in seconds to conjugate with the dextran, the boronic acid on the capped particle took 2 h to reach saturation. However, the complexation was completed to 80% in 5 min by either plot of the absorbance decrease at 397 nm or rising at 640 nm with time. This process could also be observed by luminescence spectral changes for both glucose and dextran (Fig. 6). The complexation of particle 2 with glucose could be observed by an increase of luminescence intensity at 374 nm (Fig. 6). It was noted that complexation took 1 h to complete an 80% conversion for the glucose, implying that in addition to a lower association constant, the complexation kinetic of the glucose was also a slower process.
Fig. 6.
Dependence of luminescence intensity of particle 2 (5.8 × 10⁻⁸ M) at 374 nm on the reaction time when coupling with glucose (5.9 × 10⁻⁷ M) and dextran (carbohydrate unit concentration 5.6 × 10⁻⁷ M) in water.
Conclusion
Tiopronin ligand coated on silver nanoparticles (average diameter of core size = 5 nm) was displaced by thiolate boronic acid through ligand exchange. The boronic acid capped on the particle displayed a higher affinity to couple with polysaccharides (dextran) than monosaccharides (glucose) according to absorbance and luminescence spectral changes. The luminescence intensity from boronic acid capped on the particle showed an upward deviation increasing with the concentration of dextran. This was ascribed to a stronger SEF of fluorophores localized in an overlapped enhanced field by the aggregated particles on the dextran chain. The decay time decreased with the concentration of dextran in solution. The complexation of particle 2 with dextran was also much faster than that with glucose. Although the specificity of this approach is not nearly sufficient for a diagnostic assay, more work can be done based on the results of this study.
Acknowledgments
This research was supported by a grant from NIH, NCRR, RR-08119.
Footnotes
Abbreviations used: SEF, surface-enhanced fluorescence; THF, tetrahydrofuran; TEM, transmission electron micrographs; DCC, dicyclohexyl carbodiimide.
References
- [1].James TD, Sandanayake KRAS, Shinkai S, Chiral discrimination of monosaccharides using a fluorescent molecular sensor, Nature 374 (1995) 345–347. [Google Scholar]
- [2].Pickup JC, Thevenot DR, in: Advances in Biosensors, Suppl. 1, JAI Press, London, UK, 1993, pp. 273–288. [Google Scholar]
- [3].Rolinski OJ, Birch DJS, McCartney LJ, Pickup JC, in: Lakowicz JR, Soper S, Thompson RB (Eds.), Proceedings of Advances in Fluorescence Sensing Technology IV, SPIE, San Jose, CA, 1999, pp. 6–14. [Google Scholar]
- [4].Scheller FW, Schubert F, Fedrowitz J (Eds.), Frontiers in Biosensorics I. Fundamental Aspects, Birkhauser Verlag, Berlin, 1997. [Google Scholar]
- [5].Scheller FW, Schubert F, Fedrowitz J (Eds.), Frontiers in Biosensorics II. Practical Applications, Birkhauser Verlag, Berlin, 1997. [Google Scholar]
- [6].de Silva AP, Gunaratne HQN, Gunnhaugson T, Huxley AJM, McCoy CP, Rademacher JT, Rice TE, Signaling recognition events with fluorescent sensors and switches, Chem. Rev 97 (1997) 1515–1566. [DOI] [PubMed] [Google Scholar]
- [7].Marvin JS, Hellinga HW, Engineering biosensors by introducing fluorescent allosteric signal transducers: construction of a novel glucose sensor, J. Am. Chem. Soc 120 (1998) 7–11. [Google Scholar]
- [8].Berroca MJ, Johnson RD, Badr IHA, Liu MD, Gao DY, Bachas LG, Improving the blood compatibility of ion-selective electrodes by employing poly(MPC-co-BMA), a copolymer containing phosphorylcholine, as a membrane coating, Anal. Chem 74 (2002) 3644–3648. [DOI] [PubMed] [Google Scholar]
- [9].Tiessen RG, Rhemrev-Boom MM, Korf J, Glucose gradient differences in subcutaneous tissue of healthy volunteers assessed with ultraslow microdialysis and a nanolitre glucose sensor, Life Sci. 70 (2002) 2457–2466. [DOI] [PubMed] [Google Scholar]
- [10].McCartney LJ, Pickup JC, Rolinski OJ, Birch DJS, Near-infrared fluorescence lifetime assay for serum glucose based on allophycocyanin-labeled concanavalin A, Anal. Biochem 292 (2001) 216–221. [DOI] [PubMed] [Google Scholar]
- [11].Cao H, Diaz DI, DiCesare N, Lakowicz JR, Heagy MD, Monoboronic acid sensor that displays anomalous fluorescence sensitivity to glucose, Org. Lett 4 (2002) 1503–1505. [DOI] [PMC free article] [PubMed] [Google Scholar]
- [12].Meadows DL, Schultz JS, Design, manufacture, and characterization of an optical-fiber glucose affinity sensor-based on a homogenerous fluorescence energy transfer assay system, Anal. Chim. Acta 280 (1993) 21–30. [Google Scholar]
- [13].Ballerstadt R, Schultz JS, Competitive-binding assay method based on fluorescence quenching of ligands held in close proximity by a multivalent receptor, Anal. Chim. Acta 345 (1997) 203–212. [Google Scholar]
- [14].Lakowicz JR, Emerging biomedical application of time-resolved florescence spectroscopy, in: Lakowicz JR, (Ed.), Topic in Fluorescence spectroscopy, Probe Design and Chemical Sensing, vol. 4, Plenum Press, New York, 1994, pp. 1–9. [Google Scholar]
- [15].Yoon J, Czarnik AW, Fluorescent chemosensors of carbohydrates—a means of chemically communicating the binding of polyols in water based on chelation-enhanced quenching, J. Am. Chem. Soc 114 (1992) 5874–5875. [Google Scholar]
- [16].Mohler LK, Czarnik AW, Alpha-amino-acid chelative complexation by an arylboronic acid, J. Am. Chem. Soc 115 (1993) 7037–7038. [Google Scholar]
- [17].James TD, Sandanayake KRAS, Iguchi R, Shinkai S, Novel saccharide-photoinduced electron-transfer sensors based on the interaction of boronic acid and amine, J. Am. Chem. Soc 117 (1995) 8982–8987. [Google Scholar]
- [18].James TD, Sandanayake KRAS, Shinkai S, Saccharide sensing with molecular receptors based on boronic acid, Angew. Chem. Int. Ed. Engl 135 (1996) 1911–1922. [Google Scholar]
- [19].Springsteen G, Ballard CE, Gao S, Wang W, Wang B, The development of photometric sensors for boronic acids, Bioorg. Chem 29 (2001) 259–270. [DOI] [PubMed] [Google Scholar]
- [20].Springsteen G, Wang B, A detailed examination of boronic acid– diol complexation, Tetrahedron 58 (2002) 5291–5300. [Google Scholar]
- [21].Karnati VV, Gao X, Gao S, Yang W, Ni W, Sankar S, Wang B, A glucose-selective fluorescence sensor based on boronic acid–diol recognition, Bioorg. Med. Chem. Lett 12 (2002) 3373–3377. [DOI] [PubMed] [Google Scholar]
- [22].Wang W, Gao X, Wang B, Boronic acid-based sensors, Curr. Med. Chem 6 (2002) 1285–1317. [Google Scholar]
- [23].Tong A-J, Yamauchi A, Hayashita T, Zhang Z-Y, Smith BD, Teramae N, Boronic acid fluorophore/beta-cyclodextrin complex sensors for selective sugar recognition in water, Anal. Chem 73 (2001) 1530–1536. [DOI] [PubMed] [Google Scholar]
- [24].Yang W, He H, Drueckhammer DG, Computer-guided design in molecular recognition: design and synthesis of a glucopyranose receptor, Angew. Chem. Int. Ed. Engl 40 (2001) 1714–1718. [PubMed] [Google Scholar]
- [25].Tolosa L, Szmacinski H, Rao G, Lakowicz JR, Lifetime-based sensing of glucose using energy transfer with a long lifetime donor, Anal. Biochem 250 (1997) 102–108. [DOI] [PMC free article] [PubMed] [Google Scholar]
- [26].DiCesare N, Pinto MR, Schanze KS, Lakowicz JR, Saccharide detection based on the amplified fluorescence quenching of a water-soluble poly(phenylene ethynylene) by a boronic acid functionalized benzyl viologen derivative, Langmuir 18 (2002) 7785–7787. [DOI] [PMC free article] [PubMed] [Google Scholar]
- [27].Hayat MA (Ed.), Colloidal Gold: Principles, Methods, and Applications, Academic Press, San Diego, 1991. [Google Scholar]
- [28].Allara D, in: Ulman A (Ed.), Characterization of Organic Thin Films, Butterworth-Heinemann, Boston, 1995, Chapter 4. [Google Scholar]
- [29].Ulman A, Ultrathin Organic Films, Academic Press, San Diego, 1991. [Google Scholar]
- [30].Ulman A, Formation and structure of self-assembled monolayers, Chem. Rev 96 (1996) 1533–1554. [DOI] [PubMed] [Google Scholar]
- [31].Templeton AC, Wuelfing WP, Murray RW, Monolayer protected cluster molecules, Acc. Chem. Res 33 (2000) 27–36. [DOI] [PubMed] [Google Scholar]
- [32].Ingram RS, Hostetler MJ, Murray RW, J. Am. Chem. Soc 119 (1997) 9175–9178. [Google Scholar]
- [33].Templeton AC, Hostetler MJ, Kraft CT, Murray RW, Reactivity of monolayer-protected gold cluster molecules: steric effects, J. Am. Chem. Soc 120 (1998) 1906–1911. [Google Scholar]
- [34].Hostetler MJ, Templeton AC, Murray RW, Dynamics of place-exchange reactions on monolayer-protected gold cluster molecules, Langmuir 15 (1999) 3782–3789. [Google Scholar]
- [35].Hostetler MJ, Wingate JE, Zhong C-J, Harris JE, Vachet RW, Clark MR, Londono JD, Green SJ, Stokes JJ, Wignall GD, Glish GL, Porter MD, Evans ND, Murray RW, Alkanethiolate gold cluster molecules with core diameters from 1.5 to 5.2 nm: core and monolayer properties as a function of core size, Langmuir 14 (1998) 17–30. [Google Scholar]
- [36].Huang T, Murray RW, Visible luminescence of water-soluble monolayer-protected gold clusters, J. Phys. Chem. B 105 (2001) 12498–12505. [Google Scholar]
- [37].Huang T, Murray RW, Quenching of [Ru(bpy)3]2+ fluorescence by binding to Au nanoparticles, Langmuir 18 (2002) 7077–7081. [Google Scholar]
- [38].Lakowicz JR, Radiative decay engineering: biophysical and biomedical applications, Anal. BioChem 298 (2001) 1–24. [DOI] [PMC free article] [PubMed] [Google Scholar]
- [39].Lakowicz JR, Shen YB, D’Auria S, Malicka J, Fang JY, Gryczynski Z, Gryczynski I, Radiative decay engineering 2. Effects of silver island films on fluorescence intensity, lifetimes, and resonance energy transfer, Anal. Biochem 301 (2002) 261–277. [DOI] [PMC free article] [PubMed] [Google Scholar]
- [40].Geddes CD, Cao H, Gryczynski I, Gryczynski Z, Fang JY, Lakowicz JR, Metal-enhanced fluorescence (MEF) due to silver colloids on a planar surface: potential applications of indocyanine green to in vivo imaging, J. Phys. Chem. A 107 (2003) 3443–3449. [DOI] [PMC free article] [PubMed] [Google Scholar]
- [41].Zhang J, Malicka J, Gryczynski I, Lakowicz JR, Oligonucleotide-displaced organic monolayer-protected silver nanoparticles and enhanced luminescent of their salted aggregates, Anal. BioChem 330 (2004) 81–86. [DOI] [PMC free article] [PubMed] [Google Scholar]
- [42].Oya M, Hideo M, Iwao J-I, Funae Y, Chem. Pharm. Bull 29 (1981) 63. [DOI] [PubMed] [Google Scholar]
- [43].Roger J, Eric B, Bull. Soc. Chim. Fr 2 (11–12) (1982) 391. [Google Scholar]
- [44].Brust M, Walker M, Bethell D, Schiffrin DJ, Whyman R, Synthesis of thiol-derivatized gold nanoparticles in 2-phase liquid liquid system, J. Chem. Soc. Chem. Commun (1994) 801–802. [Google Scholar]
- [45].Kamat PV, Photophysical, photochemical and photocatalytic aspects of metal nanoparticles, J. Phys. Chem 106 (2002) 7729–7744. [Google Scholar]
- [46].Esumi K, Matsushima Y, Torigoe K, Preparation of rodlike gold particles by UV irradiation using cationic micells as template, Langmuir 11 (1995) 3285–3287. [Google Scholar]
- [47].Link S, Mohamed MB, El-Sayed MA, Simulation of the optical absorption spectra of gold nanorods as a function of their aspect ratio and the effect of the medium dielectric constant, J. Phys. Chem. B 103 (1999) 3073–3077. [Google Scholar]
- [48].Evanoff DD, White RL, Chumanov G, Measuring the distance dependence of the local electromagnetic field from silver nanoparticlesz, J. Phys. Chem. B 108 (2004) 1522–1524. [Google Scholar]
- [49].Malicka J, Gryczynski I, Lakowicz JR, Enhanced emission of highly labeled DNA oligomers near silver metallic surfaces, Anal. Chem 75 (2003) 4408–4414. [DOI] [PMC free article] [PubMed] [Google Scholar]
- [50].Malicka J, Gryczynski I, Gryczynski Z, Lakowicz JR, Fluorescence spectral properties of cyanine dye-labeled DNA oligomers on surfaces coated with silver particles, Anal. Biochem 315 (2003) 57. [DOI] [PMC free article] [PubMed] [Google Scholar]


