Abstract
Not much is known about the roles of long non-coding RNAs (lncRNAs) for chronic kidney disease (CKD). In this study, we included CKD patient cohorts and normal controls as a discovery cohort to identify putative lncRNA biomarkers associated with CKD. We first compared the lncRNA expression profiles of CKD patients with normal controls, and identified differentially expressed lncRNAs and mRNAs. Co-expression network based on the enriched differentially expressed mRNAs and lncRNAs was constructed using WGCNA to identify important modules related to CKD. A lncRNA-miRNA-mRNA pathway network based on the hub lncRNAs and mRNAs, related miRNAs, and overlapping pathways was further constructed to reveal putative biomarkers. A total of 821 significantly differentially expressed mRNAs and lncRNAs were screened between CKD and control samples, which were enriched in nine modules using weighted correlation network analysis (WGCNA), especially brown and yellow modules. Co-expression network based on the enriched differentially expressed mRNAs and lncRNAs in brown and yellow modules uncovered 7 hub lncRNAs and 53 hub mRNAs. A lncRNA-miRNA-mRNA pathway network further revealed that lncRNAs of HCP5 and NOP14-AS1 and genes of CCND2, COL3A1, COL4A1, and RAC2 were significantly correlated with CKD. The lncRNAs of NOP14-AS1 and HCP5 were potential prognostic biomarkers for predicting the risk of CKD.
Keywords: Long non-coding RNAs, Chronic kidney disease, WGCNA, Prognostic biomarkers
Introduction
Arising from many heterogeneous disease pathways, chronic kidney disease (CKD) can alter the function and structure of the kidney irreversibly, over months or years. In 2012, according to World Health Organization global health estimates, 864 226 deaths (or 1.5% of deaths worldwide) were attributable to CKD. Thus, the burden of CKD is substantial. The etiology of CKD is very complex, with hypertension and diabetes being the main causes. Moreover, increased risk of developing CKD and more rapidly progressing CKD are reported to be related to worsening blood pressure control. Recently, investigation of people with genetic causes of CKD has been evolving rapidly. Several loci, genetic polymorphisms, and single nucleotide polymorphisms that might contribute to accelerated progression of CKD have been identified with genome-wide association studies (1 –4).
During past years, the biological roles of various types of non-coding RNAs (ncRNAs) have been highlighted. Long non-coding RNAs (lncRNAs), a newly discovered class of ncRNAs, were defined as RNA molecules longer than 200 nucleotides in length. There is growing evidence that lncRNAs are involved in various biological processes, including maintenance of pluripotency, nuclear organization, development, translational control, and RNA splicing. A growing number of lncRNAs have been characterized as tumor suppressor genes or oncogenes contributing to cancer development, progression, and metastasis (3,5,6). Nevertheless, not much is known about the roles of lncRNAs for chronic human diseases other than cancer until recently, such as CKD.
In this work, CKD patient cohorts and normal controls were included as a discovery cohort to identify putative lncRNA biomarkers. The lncRNA expression profiles of CKD patients were compared with normal controls, and differentially expressed lncRNAs and mRNAs were identified. Co-expression network based on the enriched differentially expressed mRNAs and lncRNAs was constructed using weighted correlation network analysis (WGCNA) to identify important modules related to CKD. A lncRNA-miRNA-mRNA-pathway network based on the hub lncRNAs and mRNAs, related miRNAs, and overlapping pathways was further constructed to reveal putative biomarkers for CKD.
Material and Methods
Microarray data and data preprocessing
The microarray data GSE48944 for CKD was downloaded from the National Center for Biotechnology Information (NCBI) Gene Expression Omnibus database (GEO) on May 7, 2018 (7). The testing platform was Affymetrix Human Genome U133A 2.0 (GPL571: HG-U133A_2). GSE48944 included 13 human CKD samples and 12 control (CTRL) samples. Microarray raw data (.CEL files) of the CKD were processed with oligo Version 1.41.1 (http://www.bioconductor.org/packages/release/bioc/html/oligo.html) in R language to achieve an approximate normal distribution (8). Subsequently, the data were standardized using the median normalization and quantile methods.
Screening of differentially expressed mRNAs and lncRNAs
The probe sequences (GPL571) of Affymetrix HG-U133_2 array were downloaded from the Affymetrix website (https://www.ncbi.nlm.nih.gov/geo/query/acc.cgi?acc=GPL571). Along with information of transcript ID, RefSeq ID, and chromosomal position, the 3909 lncRNAs and 19198 protein coding genes in HUGO Gene Nomenclature Committee (HGNC, http://www.genenames.org/) were used to re-annotate the mRNAs and lncRNAs in the microarray data (9). Limma Version 3.34.0 (https://bioconductor.org/packages/release/bioc/html/limma.html) in R language (R3.4.1) was used to determine the false discovery rate (FDR) and fold changes (FC) of differentially expressed mRNAs and lncRNAs (10). The FDR value <0.05 and |logFC|>0.5 were used as the cut-off criteria. Based on expression profiles of mRNAs and lncRNAs, the pheatmap Version 1.0.8 (https://cran.r-project.org/package=pheatmap) in R language (R3.4.1) was used to determine the metric of Euclidean distance and bilateral hierarchical clustering, and displayed with hierarchical clustering (11 –13). Functional enrichment analysis for lncRNAs was conducted using DAVID Bioinformatics Tool (DAVID 6.8, https://david.ncifcrf.gov/) limited to Gene Ontology (GO) terms and Kyoto Encyclopedia of Genes and Genomes (KEGG) categories to screen the significantly enriched GO functions and KEGG pathways (14,15).
WGCNA analysis to screen specific modules and RNAs
WGCNA, a biology systems method, can be used to construct a scale-free network from gene expression data. WGCNA package Version 1.61 in R (https://cran.r-project.org/web/packages/WGCNA/) was used to screen specific modules and RNAs related to CKD (16 –18). The modules were detected using dynamic tree cut algorithm with a minimum module size of 100 and a minimum cut height of 0.95 (P value <0.05). The significantly differentially expressed mRNAs and lncRNAs were mapped to modules in WGCNA. Fold enrichments and P values of significantly differentially expressed mRNAs and lncRNAs in modules were calculated using the hypergeometric test of f(k,N,M,n) = C(k,M) * C(n-k,N-M) / C(n,N) (19). A fold enrichment >1 and P value <0.05 were used as the cut-off criteria.
Network construction of enriched differentially expressed mRNAs and lncRNAs
Pearson’s correlation coefficient (PCC) of the enriched differentially expressed mRNAs and lncRNAs in WGCNA modules was calculated using the cor function in R (http://77.66.12.57/R-help/cor.test.html), and the co-expression network was constructed. Cytoscape 3.6.1 (http://www.cytoscape.org/) was used to visualize the co-expression network of enriched differentially expressed mRNAs and lncRNAs in WGCNA modules (20). GO functional and KEGG pathway analyses for enriched differentially expressed mRNAs and lncRNAs in the co-expression network were searched using the Database for Annotation, Visualization, and Integrated Discovery (DAVID, http://www.david.niaid.nih.gov) software. Three categories of biological process, cellular compartment, and molecular function were included in the GO terms.
Construction of KEGG pathway network related to CKD
KEGG pathways related to CKD were searched with Comparative Toxic Genomics Database 2017 update (CTD, http://ctd.mdibl.org/) using the keyword “Chronic Kidney Disease”. These pathways were compared with KEGG pathways enriched in the co-expression network of differentially expressed mRNAs and lncRNAs, and then the overlapping pathways were obtained. A KEGG pathway network related to CKD was constructed using these overlapping pathways. We searched the related miRNAs using StarBase Version 2.0 database (http://starbase.sysu.edu.cn/), constructed lncRNA-miRNA-mRNA-pathway network by connecting the hubs, and screened the potential prognostic biomarkers of long non-coding RNAs for predicting the risk of CKD (21).
Results
Overview of differential expression analysis (lncRNAs and mRNAs)
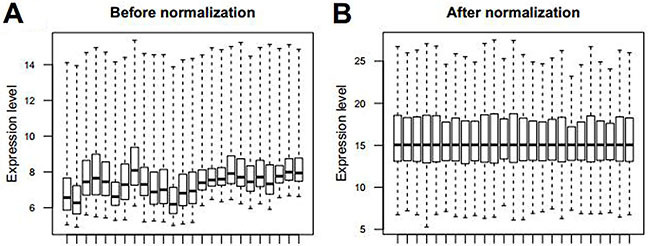
Firstly, the microarray raw data were standardized using the median normalization and quantile methods. Boxplots of microarray raw data before and after normalization are shown in Figure 1.
Figure 1. Boxplot of microarray raw data before (A) and after (B) normalization.
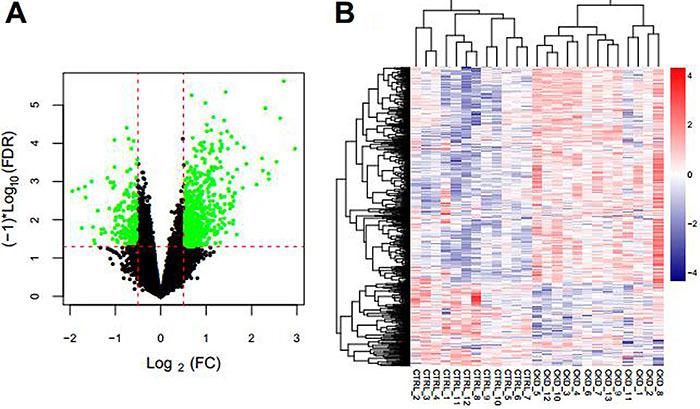
Next, we performed differentially expressed analysis to identify potential lncRNAs associated with CKD. A total of 130 lncRNAs and 12,126 protein-coding genes were obtained after re-annotation, as shown in Table S1. A total of 821 significantly differentially expressed mRNAs and lncRNAs were screened using Limma (http://www.bioconductor.org/packages/release/bioc/html/limma.html), including 205 downregulated and 616 upregulated between CKD and CTRL (Figure 2A and Table S2). The expression level of these significantly differentially expressed mRNAs and lncRNAs are shown in Table S3. Bilateral hierarchical clustering of significantly differentially expressed mRNAs and lncRNAs are shown in Figure 2B. The expression level of RNAs could discriminate CKD and CTRL samples, indicating distinctive features between these samples.
Figure 2. A, Volcano plot of log2 fold change (FC) – log10 false discovery rate (FDR) test for differentially expressed mRNAs and lncRNAs. Red dotted line indicates FDR <0.05. Green dots indicate differentially expressed mRNAs and lncRNAs. B, Heatmap of hierarchical clustering of differentially expressed lncRNAs and mRNAs.
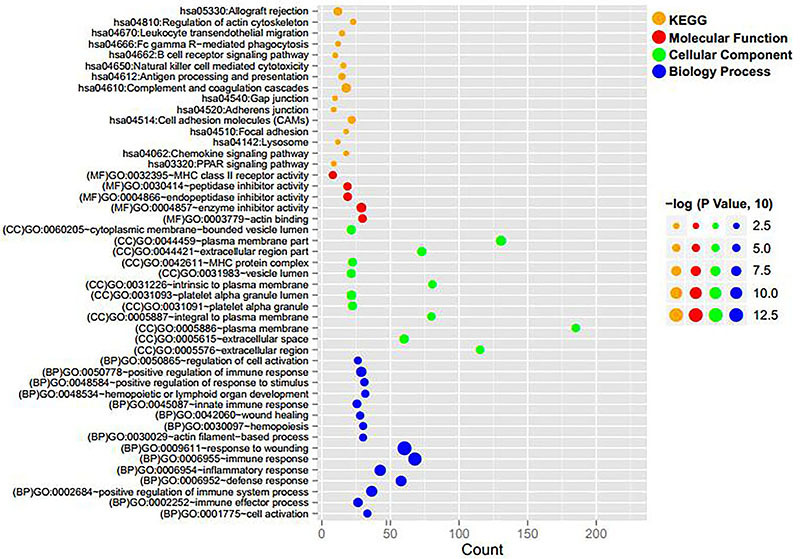
GO functional and KEGG pathway analyses for 802 differentially expressed coding RNAs indicated that 32 GO functions (15 biological processes, 12 cellular compartments, and 5 molecular functions) and 15 KEGG pathways were enriched. As shown in Table 1 and Figure 3, these differentially expressed coding RNAs were related to GO functions of wound response, immune response, and inflammatory response, as well as KEGG pathways of complement and coagulation cascades (hsa04610), allograft rejection (hsa05330), and cell adhesion molecules (hsa04514), etc.
Table 1. Enriched GO functions and KEGG pathways of differentially expressed coding RNAs.
| Category | Term | Count | P value |
|---|---|---|---|
| Biology Process | GO: 0009611∼response to wounding | 67 | 2.55E-13 |
| GO: 0006955∼immune response | 77 | 2.08E-12 | |
| GO: 0006954∼inflammatory response | 44 | 6.85E-10 | |
| GO: 0002684∼positive regulation of immune system process | 36 | 1.67E-09 | |
| GO: 0006952∼defense response | 64 | 3.54E-09 | |
| GO: 0050778∼positive regulation of immune response | 26 | 1.47E-08 | |
| GO: 0002252∼immune effector process | 23 | 2.63E-07 | |
| GO: 0045087∼innate immune response | 22 | 1.77E-06 | |
| GO: 0048584∼positive regulation of response to stimulus | 29 | 5.96E-06 | |
| GO: 0042060∼wound healing | 25 | 1.04E-05 | |
| GO: 0001775∼cell activation | 32 | 1.33E-05 | |
| GO: 0048534∼hemopoietic or lymphoid organ development | 30 | 1.36E-05 | |
| GO: 0030097∼hemopoiesis | 28 | 1.70E-05 | |
| GO: 0050865∼regulation of cell activation | 23 | 2.39E-05 | |
| GO: 0030029∼actin filament-based process | 28 | 2.49E-05 | |
| Cellular Component | GO: 0044459∼plasma membrane part | 155 | 2.53E-08 |
| GO: 0031093∼platelet alpha granule lumen | 13 | 2.00E-07 | |
| GO: 0005615∼extracellular space | 63 | 2.65E-07 | |
| GO: 0044421∼extracellular region part | 80 | 3.03E-07 | |
| GO: 0060205∼cytoplasmic membrane-bounded vesicle lumen | 13 | 4.71E-07 | |
| GO: 0031983∼vesicle lumen | 13 | 7.98E-07 | |
| GO: 0031091∼platelet alpha granule | 14 | 1.19E-06 | |
| GO: 0042611∼MHC protein complex | 14 | 1.48E-06 | |
| GO: 0005886∼plasma membrane | 226 | 3.93E-06 | |
| GO: 0005576∼extracellular region | 135 | 4.08E-06 | |
| GO: 0005887∼integral to plasma membrane | 89 | 5.27E-06 | |
| GO: 0031226∼intrinsic to plasma membrane | 90 | 7.08E-06 | |
| Molecular Function | GO: 0004857∼enzyme inhibitor activity | 35 | 1.04E-07 |
| GO: 0003779∼actin binding | 36 | 3.10E-06 | |
| GO: 0004866∼endopeptidase inhibitor activity | 22 | 3.18E-06 | |
| GO: 0030414∼peptidase inhibitor activity | 22 | 7.56E-06 | |
| GO: 0032395∼MHC class II receptor activity | 8 | 1.36E-05 | |
| KEGG Pathway | hsa04610: Complement and coagulation cascades | 18 | 2.04E-07 |
| hsa05330: Allograft rejection | 12 | 2.50E-06 | |
| hsa04514: Cell adhesion molecules (CAMs) | 22 | 1.69E-05 | |
| hsa04612: Antigen processing and presentation | 15 | 0.000189 | |
| hsa04810: Regulation of actin cytoskeleton | 23 | 0.004886 | |
| hsa04670: Leukocyte transendothelial migration | 15 | 0.00551 | |
| hsa04650: Natural killer cell mediated cytotoxicity | 16 | 0.006762 | |
| hsa04666: Fc gamma R-mediated phagocytosis | 12 | 0.013475 | |
| hsa04662: B cell receptor signaling pathway | 10 | 0.017701 | |
| hsa03320: PPAR signaling pathway | 9 | 0.027244 | |
| hsa04062: Chemokine signaling pathway | 18 | 0.028853 | |
| hsa04540: Gap junction | 10 | 0.043395 | |
| hsa04520: Adherens junction | 9 | 0.04559 | |
| hsa04142: Lysosome | 12 | 0.046965 | |
| hsa04510: Focal adhesion | 18 | 0.048777 |
GO: Gene Ontology.
Figure 3. Distribution diagram of enriched Gene Ontology (GO) functions and KEGG pathways of differentially expressed mRNAs and lncRNAs. Orange, red, green, and blue dots indicate KEGG pathway, molecular function, cellular component, and biological process, respectively.
Identification and characterization of CKD-associated modules using WGCNA
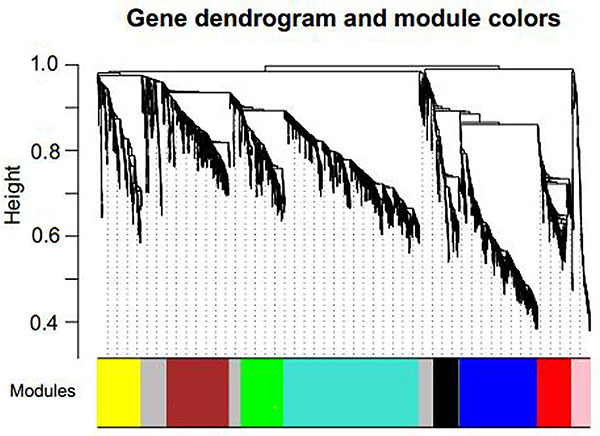
The underlying molecular mechanisms of CKD could be explored through an approach of gene co-expression network. It allows us to explore a set of interacting mRNAs and lncRNAs measured by modules or subnetworks that are involved in the complex disease of CKD. The WGCNA R package implements a suite of tools, which can be used for the network construction. A weighted adjacency matrix implemented in WGCNA was used to construct a scale-free network and identify important modules related to CKD. In this work, a step-by-step network construction and module detection method was used, and a selected power (power=12) was determined through a soft-threshold approach implemented in WGCNA, as shown in Figure 4. Co-expression modules were defined by a robust dynamic hierarchical tree and sets of tightly co-regulated genes with the measurement of dissimilarity. The minimum module size of 100 and a minimum cut height of 0.25 were set to ensure a qualified number of genes for the further analysis. Nine co-expression modules were obtained by clustering the highly co-expressed genes in the constructed network (Table 2). With each clustered module showing a different color, they were visualized as shown in Figure 5. Differently expressed mRNAs and lncRNAs were significantly enriched in brown and yellow modules, including 151 and 54 RNAs (containing 7 lncRNAs), respectively. These 205 differently expressed mRNAs and lncRNAs enriched in brown and yellow modules were used for subsequent investigation. The list of these RNAs in brown and yellow modules are provided in Table S4.
Figure 4. Left panel: power selection map. Right panel: mean connectivity degree of RNA under different power values.

Table 2. Summary of nine modules in co-expression network.
| Color | RNAs (#) | Correlation | Pcorr | DE RNAs (n) | Enrichment fold (95% CI) | Phyper |
|---|---|---|---|---|---|---|
| Black | 171 | 0.832 | 0.000338 | 1 | 0.0615 (0.00155-0.350) | 6.75E-06 |
| Blue | 519 | 0.863 | 0.000936 | 5 | 0.101 (0.0325-0.241) | 1.35E-13 |
| Brown | 421 | 0.861 | 0.00209 | 151 | 3.771 (3.006-4.716) | 2.20E-16 |
| Green | 289 | 0.819 | 0.000286 | 17 | 0.619 (0.351-1.025) | 0.526 |
| Grey | 355 | 0.129 | 0.282 | 22 | 0.652 (0.397-1.021) | 6.34E-02 |
| Pink | 122 | 0.724 | 0.0263 | 1 | 0.0862 (0.00216-0.493) | 3.87E-04 |
| Red | 229 | 0.861 | 0.000317 | 1 | 0.0459 (0.00116-0.261) | 7.07E-08 |
| Turquoise | 903 | 0.794 | 0.00102 | 62 | 0.722 (0.5354-0.9611) | 2.46E-02 |
| Yellow | 293 | 0.889 | 0.0266 | 54 | 1.938 (1.389-2.664) | 9.10E-05 |
DE: differently expressed.
Figure 5. Network construction and module identification.
Network analysis revealed prognostic lncRNA biomarkers associated with CKD progression
To identify potential prognostic lncRNA biomarkers associated with CKD progression, we further constructed a co-expression network based on the enriched differentially expressed mRNAs and lncRNAs in brown and yellow modules. PCC of 197 differentially expressed mRNAs and 7 differentially expressed lncRNAs were calculated (Table S5). As shown in Figure 6, lncRNA-mRNA co-expression network contained 462 lines (250 with negative correlation and 212 with positive correlation) and 204 hubs. Among these 7 lncRNAs, 1 lncRNA was upregulated and 6 lncRNAs were downregulated, while 53 mRNAs were downregulated and 144 mRNAs were upregulated.
Figure 6. lncRNA-mRNA co-expression network. Green lines represent negative correlations, and pink lines represent positive correlations. Squares indicate lncRNA, and circles indicate mRNA. The node change from green to red indicates that log fold change (FC) changed from negative to positive.

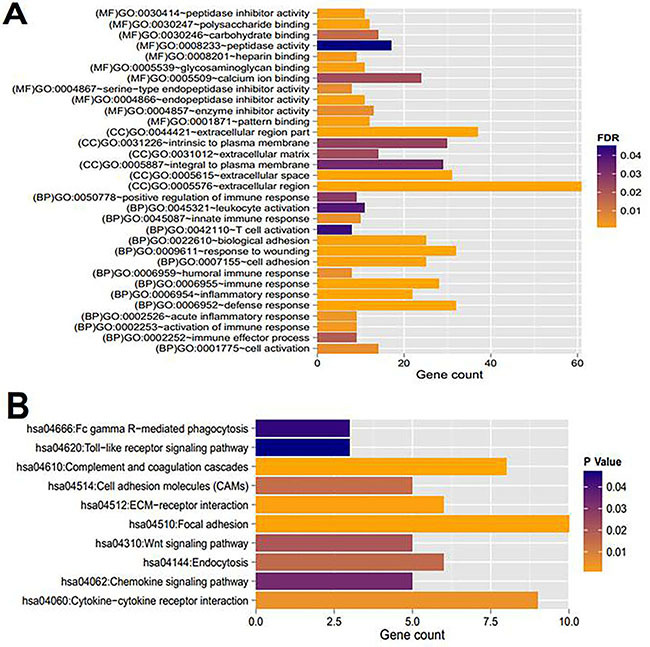
GO functional and KEGG pathway analyses using DAVID for differentially expressed mRNAs indicated 32 GO functions (15 biological processes, 6 cellular compartments, and 11 molecular functions) and 10 KEGG pathways were enriched (Table 3 and Figure 7). The differentially expressed mRNAs in the lncRNA-mRNA co-expression network were related to GO functions of wound response, defense response, immune response, and inflammatory response. Moreover, the enriched KEGG pathways included complement and coagulation cascades (hsa04610), ECM-receptor interaction (hsa04512), cytokine-cytokine receptor interaction (hsa04060), and cell adhesion molecules (hsa04514), etc.
Table 3. Enriched Gene Ontology (GO) functions and KEGG pathways of mRNAs in the co-expression network.
| Category | Term | Count | P value |
|---|---|---|---|
| Biology process | GO: 0009611∼response to wounding | 32 | 7.40E-14 |
| GO: 0006952∼defense response | 32 | 3.77E-12 | |
| GO: 0006954∼inflammatory response | 22 | 1.90E-10 | |
| GO: 0006955∼immune response | 28 | 2.73E-08 | |
| GO: 0022610∼biological adhesion | 25 | 1.97E-06 | |
| GO: 0007155∼cell adhesion | 25 | 1.92E-06 | |
| GO: 0002253∼activation of immune response | 9 | 1.38E-05 | |
| GO: 0002526∼acute inflammatory response | 9 | 1.87E-05 | |
| GO: 0006959∼humoral immune response | 8 | 3.72E-05 | |
| GO: 0045087∼innate immune response | 10 | 3.42E-05 | |
| GO: 0001775∼cell activation | 14 | 3.19E-05 | |
| GO: 0002252∼immune effector process | 9 | 1.74E-04 | |
| GO: 0050778∼positive regulation of immune response | 9 | 2.97E-04 | |
| GO: 0045321∼leukocyte activation | 11 | 5.51E-04 | |
| GO: 0042110∼T cell activation | 8 | 6.86E-04 | |
| Cellular component | GO: 0005576∼extracellular region | 61 | 2.57E-11 |
| GO: 0044421∼extracellular region part | 37 | 2.49E-09 | |
| GO: 0005615∼extracellular space | 31 | 2.00E-09 | |
| GO: 0031012∼extracellular matrix | 14 | 4.48E-04 | |
| GO: 0031226∼intrinsic to plasma membrane | 30 | 6.13E-04 | |
| GO: 0005887∼integral to plasma membrane | 29 | 9.38E-04 | |
| Molecular function | GO: 0001871∼pattern binding | 12 | 2.14E-06 |
| GO: 0030247∼polysaccharide binding | 12 | 2.14E-06 | |
| GO: 0004866∼endopeptidase inhibitor activity | 11 | 8.62E-06 | |
| GO: 0005539∼glycosaminoglycan binding | 11 | 6.31E-06 | |
| GO: 0030414∼peptidase inhibitor activity | 11 | 1.38E-05 | |
| GO: 0008201∼heparin binding | 9 | 3.00E-05 | |
| GO: 0004857∼enzyme inhibitor activity | 13 | 8.93E-05 | |
| GO: 0004867∼serine-type endopeptidase inhibitor activity | 8 | 1.09E-04 | |
| GO: 0030246∼carbohydrate binding | 14 | 3.03E-04 | |
| GO: 0005509∼calcium ion binding | 24 | 5.12E-04 | |
| GO: 0008233∼peptidase activity | 17 | 0.001293 | |
| KEGG pathway | *hsa04610: Complement and coagulation cascades | 8 | 8.31E-06 |
| *hsa04510: Focal adhesion | 10 | 0.000368 | |
| hsa04512: ECM-receptor interaction | 6 | 0.000945 | |
| *hsa04060: Cytokine-cytokine receptor interaction | 9 | 0.004923 | |
| hsa04514: Cell adhesion molecules (CAMs) | 5 | 0.014839 | |
| *hsa04144: Endocytosis | 6 | 0.015668 | |
| hsa04310: Wnt signaling pathway | 5 | 0.020687 | |
| *hsa04062: Chemokine signaling pathway | 5 | 0.033087 | |
| *hsa04666: Fc gamma R-mediated phagocytosis | 3 | 0.043681 | |
| *hsa04620: Toll-like receptor signaling pathway | 3 | 0.046832 |
Figure 7. Enriched Gene Ontology functions (A) and KEGG pathways (B) of differentially expressed mRNAs and lncRNAs in the co-expression network. FDR: false discovery rate.
KEGG pathway network further revealed the prognostic lncRNA biomarkers related to CKD
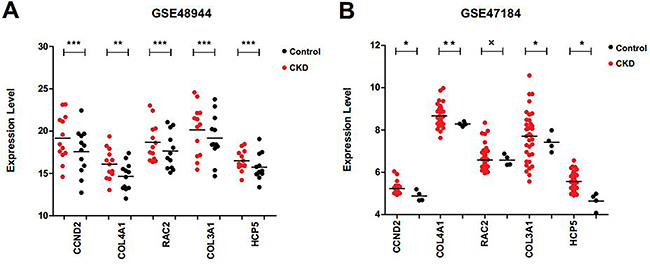
Using the keyword “Chronic Kidney Disease”, 175 KEGG pathways related to CKD were searched with CTD, as shown in Table S6. These pathways were compared with KEGG enriched pathways in the co-expression network of differentially expressed mRNAs and lncRNAs, and 7 overlapping pathways were obtained (Table 3, indicated with *). A lncRNA-mRNA-pathway network related to CKD was constructed using these overlapping pathways, as shown in Figure 8A. The miRNAs related to 7 lncRNAs in the network were searched using StarBase Version 2.0 database, and 24 lncRNA-miRNA linking relations were found, involving two lncRNAs of HCP5 and NOP14-AS1 (Table S7). Next, a lncRNA-miRNA-mRNA-pathway network was constructed by connecting the has-miR-29a/b/c, HCP5, and 4 KEGG pathways. As shown in Figure 8B, the four genes of CCND2, COL3A1, COL4A1, and RAC2, positively related with HCP5, were found to participate in four KEGG pathways directly related to CKD. As shown in Figure 9, CCND2, COL3A1, COL4A1, RAC2, and HCP5 were significantly upregulated in GSE48944 and GSE47184 (besides RAC2 in GSE47184).
Figure 8. A lncRNA-mRNA-pathway network (A) and a lncRNA-miRNA-mRNA-pathway network (B) related to chronic kidney disease (CKD). Green lines represent negative correlations; pink lines represent positive correlations; black lines represent gene connection with KEGG pathways. Squares indicate lncRNA; circles indicate mRNA; yellow circles indicate miRNA; triangles indicate pathways. The node change from green to pink indicates that log fold change changed from negative to positive.
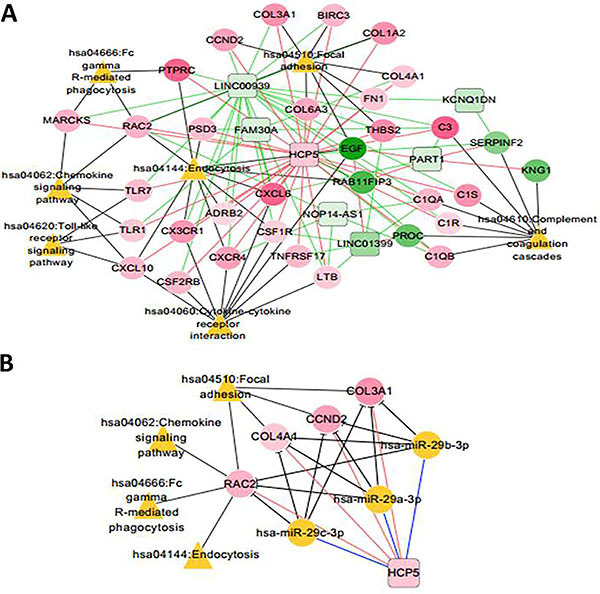
Figure 9. Expression level of CCND2, COL3A1, COL4A1, RAC2, and HCP5 in GSE48944 and GSE47184 in controls and in chronic kidney disease (CKD) patients. *P<0.05; **P<0.01; ***P<0.005. x indicates not significant. Statistical analyses were performed with the t-test.
Discussion
The results of this study indicated that genes with similar functions within modules could contribute to the risk of CKD in a co-expression manner, and the modules with different functions could be regulated synergistically.
In order to identify potential critical lncRNAs and genes associated with CKD, we focused our attention on hub lncRNAs and genes in the lncRNA-miRNA-mRNA-pathway network. Downregulated has-miR-29a/b/c was reported to be related to CKD directly (22). NOP14-AS1 (NOP14 antisense RNA 1) is affiliated with the non-coding RNA class. Diseases associated with NOP14-AS1 include astrocytoma. Previous research identified that NOP14-AS1 was strongly regulated by DNA damaging agents and significantly negatively correlated with its sense gene NOP14 in a p53-dependent manner. Hence, sense-antisense pair of NOP14-AS1/NOP14 might be involved in the progression of CKD upon DNA damage induction. The long non-coding RNA-HLA complex P5 (HCP5) has been found to be overexpressed in follicular thyroid carcinoma, which functions as a competing endogenous RNA and acts as a sponge for several miRNAs (23). The lncRNA-miRNA-mRNA-pathway network constructed indicated that HCP5 might be regulatory genes associated with the progression of CKD via the genes of CCND2, COL3A1, COL4A1, and RAC2. The CCND2 gene encodes a protein G1/S-specific cyclin-D2 in humans, which belongs to the highly conserved cyclin family. Cyclins function as regulators of cyclin-dependent kinases. High level expression of CCND2 gene was observed in ovarian and testicular tumors (24). COL3A1 gene encodes a protein of collagen alpha-1(III) chain, a precursor to collagen III, which is found in extensible connective tissues, frequently in association with type I collagen (25). The COL4A1 gene contains one of 27 SNPs associated with increased risk of coronary artery disease (26). RAC2 gene encodes a small (∼21 kDa) signaling G protein, a member of the Rac subfamily of the Rho family of GTPases, which has been shown to interact with nitric oxide synthase 2A (27). Thus, these are important genes for CKD.
In summary, this work revealed that lncRNA of NOP14-AS1 and HCP5 might be potential genetic biomarkers for the progression of CKD. They may function via the genes of CCND2, COL3A1, COL4A1, and RAC2, and the pathways of complement and coagulation cascades (hsa04610), ECM-receptor interaction (hsa04512), cytokine-cytokine receptor interaction (hsa04060), and cell adhesion molecules (hsa04514), etc. Although a comprehensive analysis was performed, there were a number of limitations in the work. Functional validation was not done for the hub lncRNAs and mRNAs obtained. Further investigations are required with substantial experiments. Nevertheless, this work provides novel insights into the occurrence and progression of CKD.
Supplementary Material
Click here to view [xls].
References
- 1.Vassalotti JA, Li S, Chen SC, Collins AJ. Screening populations at increased risk of CKD: the Kidney Early Evaluation Program (KEEP) and the public health problem. Am J Kidney Dis. 2009;53:S107–S114. doi: 10.1053/j.ajkd.2008.07.049. [DOI] [PubMed] [Google Scholar]
- 2.Webster AC, Nagler EV, Morton RL, Masson P. Chronic kidney disease. Lancet. 2017;389:1238–1252. doi: 10.1016/S0140-6736(16)32064-5. [DOI] [PubMed] [Google Scholar]
- 3.Silva A, Bullock M, Calin G. The clinical relevance of long non-coding RNAs in cancer. Cancers (Basel) 2015;7:2169–2182. doi: 10.3390/cancers7040884.. [DOI] [PMC free article] [PubMed] [Google Scholar]
- 4.Stevens PE, Levin A, Kidney Disease: Improving Global Outcomes Chronic Kidney Disease Guideline Development Work Group M Evaluation and management of chronic kidney disease: synopsis of the kidney disease: improving global outcomes 2012 clinical practice guideline. Ann Intern Med. 2013;158:825–830. doi: 10.7326/0003-4819-158-11-201306040-00007. [DOI] [PubMed] [Google Scholar]
- 5.Ko YA, Mohtat D, Suzuki M, Park AS, Izquierdo MC, Han SY, et al. Cytosine methylation changes in enhancer regions of core pro-fibrotic genes characterize kidney fibrosis development. Genome Biol. 2013;14:R108. doi: 10.1186/gb-2013-14-10-r108. [DOI] [PMC free article] [PubMed] [Google Scholar]
- 6.Zhou M, Zhong L, Xu W, Sun Y, Zhang Z, Zhao H, et al. Discovery of potential prognostic long non-coding RNA biomarkers for predicting the risk of tumor recurrence of breast cancer patients. Sci Rep. 2016;6:31038. doi: 10.1038/srep31038. [DOI] [PMC free article] [PubMed] [Google Scholar]
- 7.Barrett T, Troup DB, Wilhite SE, Ledoux P, Rudnev D, Evangelista C, et al. NCBI GEO: mining tens of millions of expression profiles - database and tools update. Nucleic Acids Res. 2007;35:D760–D765. doi: 10.1093/nar/gkl887. [DOI] [PMC free article] [PubMed] [Google Scholar]
- 8.Parrish RS, Spencer HJ, 3rd Effect of normalization on significance testing for oligonucleotide microarrays. J Biopharm Stat. 2004;14:575–589. doi: 10.1081/BIP-200025650. [DOI] [PubMed] [Google Scholar]
- 9.Yates B, Braschi B, Gray KA, Seal RL, Tweedie S, Bruford EA. Genenames.org: the HGNC and VGNC resources in 2017. Nucleic Acids Res. 2017;45:D619–D625. doi: 10.1093/nar/gkw1033. [DOI] [PMC free article] [PubMed] [Google Scholar]
- 10.Ritchie ME, Phipson B, Wu D, Hu Y, Law CW, Shi W, et al. limma powers differential expression analyses for RNA-sequencing and microarray studies. Nucleic Acids Res. 2015;43:e47. doi: 10.1093/nar/gkv007. [DOI] [PMC free article] [PubMed] [Google Scholar]
- 11.Boehlen A, Heinemann U, Henneberger C. Hierarchical spike clustering analysis for investigation of interneuron heterogeneity. Neurosci Lett. 2016;619:86–91. doi: 10.1016/j.neulet.2016.03.024. [DOI] [PubMed] [Google Scholar]
- 12.Liu AA, Su YT, Nie WZ, Kankanhalli M. Hierarchical clustering multi-task learning for joint human action grouping and recognition. IEEE Transactions on Pattern Analysis and Machine Intelligence. 2017;39:102–114. doi: 10.1109/TPAMI.2016.2537337. [DOI] [PubMed] [Google Scholar]
- 13.Wang L, Cao C, Ma Q, Zeng Q, Wang H, Cheng Z, et al. RNA-seq analyses of multiple meristems of soybean: novel and alternative transcripts, evolutionary and functional implications. BMC Plant Biol. 2014;14:169. doi: 10.1186/1471-2229-14-169. [DOI] [PMC free article] [PubMed] [Google Scholar]
- 14.Huang da W, Sherman BT, Lempicki RA. Systematic and integrative analysis of large gene lists using DAVID bioinformatics resources. Nat Protoc. 2009;4:44–57. doi: 10.1038/nprot.2008.211. [DOI] [PubMed] [Google Scholar]
- 15.Huang da W, Sherman BT, Lempicki RA. Bioinformatics enrichment tools: paths toward the comprehensive functional analysis of large gene lists. Nucleic Acids Res. 2009;37:1–13. doi: 10.1093/nar/gkn923. [DOI] [PMC free article] [PubMed] [Google Scholar]
- 16.Oldham MC, Konopka G, Iwamoto K, Langfelder P, Kato T, Horvath S, et al. Functional organization of the transcriptome in human brain. Nat Neurosci. 2008;11:1271–1282. doi: 10.1038/nn.2207. [DOI] [PMC free article] [PubMed] [Google Scholar]
- 17.Liao Q, Liu C, Yuan X, Kang S, Miao R, Xiao H, et al. Large-scale prediction of long non-coding RNA functions in a coding-non-coding gene co-expression network. Nucleic Acids Res. 2011;39:3864–3878. doi: 10.1093/nar/gkq1348. [DOI] [PMC free article] [PubMed] [Google Scholar]
- 18.Langfelder P, Horvath S. WGCNA: an R package for weighted correlation network analysis. BMC Bioinformatics. 2008;9:559. doi: 10.1186/1471-2105-9-559. [DOI] [PMC free article] [PubMed] [Google Scholar]
- 19.Cao J, Zhang S. A Bayesian extension of the hypergeometric test for functional enrichment analysis. Biometrics. 2014;70:84–94. doi: 10.1111/biom.12122. [DOI] [PMC free article] [PubMed] [Google Scholar]
- 20.Shannon P, Markiel A, Ozier O, Baliga NS, Wang JT, Ramage D, et al. Cytoscape: a software environment for integrated models of biomolecular interaction networks. Genome Res. 2003;13:2498–2504. doi: 10.1101/gr.1239303. [DOI] [PMC free article] [PubMed] [Google Scholar]
- 21.Hsu SD, Lin FM, Wu WY, Liang C, Huang WC, Chan WL, et al. miRTarBase: a database curates experimentally validated microRNA-target interactions. Nucleic Acids Res. 2011;39:D163–D169. doi: 10.1093/nar/gkq1107. [DOI] [PMC free article] [PubMed] [Google Scholar]
- 22.Qin W, Chung AC, Huang XR, Meng XM, Hui DS, Yu CM, et al. TGF-beta/Smad3 signaling promotes renal fibrosis by inhibiting miR-29. J Am Soc Nephrol. 2011;22:1462–1474. doi: 10.1681/ASN.2010121308. [DOI] [PMC free article] [PubMed] [Google Scholar]
- 23.Liang L, Xu J, Wang M, Xu G, Zhang N, Wang G, et al. LncRNA HCP5 promotes follicular thyroid carcinoma progression via miRNAs sponge. Cell Death Dis. 2018;9:372. doi: 10.1038/s41419-018-0382-7. [DOI] [PMC free article] [PubMed] [Google Scholar]
- 24.Salaverria I, Royo C, Carvajal-Cuenca A, Clot G, Navarro A, Valera A, et al. CCND2 rearrangements are the most frequent genetic events in cyclin D1(-) mantle cell lymphoma. Blood. 2013;121:1394–1402. doi: 10.1182/blood-2012-08-452284. [DOI] [PMC free article] [PubMed] [Google Scholar]
- 25.Pepin MG, Schwarze U, Rice KM, Liu M, Leistritz D, Byers PH. Survival is affected by mutation type and molecular mechanism in vascular Ehlers-Danlos syndrome (EDS type IV) Genet Med. 2014;16:881–888. doi: 10.1038/gim.2014.72. [DOI] [PubMed] [Google Scholar]
- 26.Mega JL, Stitziel NO, Smith JG, Chasman DI, Caulfield M, Devlin JJ, et al. Genetic risk, coronary heart disease events, and the clinical benefit of statin therapy: an analysis of primary and secondary prevention trials. Lancet. 2015;385:2264–2271. doi: 10.1016/S0140-6736(14)61730-X. [DOI] [PMC free article] [PubMed] [Google Scholar]
- 27.Kuncewicz T, Balakrishnan P, Snuggs MB, Kone BC. Specific association of nitric oxide synthase-2 with Rac isoforms in activated murine macrophages. Am J Physiol Renal Physiol. 2001;281:F326–F336. doi: 10.1152/ajprenal.2001.281.2.F326. [DOI] [PubMed] [Google Scholar]


