This article reports on a new prognostic nomogram for outcome prediction for patients with diffuse large B‐cell lymphoma.
Abstract
Purpose.
This study aimed to develop a prognostic nomogram in diffuse large B‐cell lymphoma (DLBCL) and compare it with traditional prognostic systems.
Materials and methods.
We included 1,070 consecutive and nonselected patients with DLBCL in the National Cancer Center/National Clinical Research Center for Cancer/Cancer Hospital, Chinese Academy of Medical Sciences, between 2006 and 2012. A nomogram based on the Cox proportional hazards model was developed.
Results.
The entire group were divided into the primary (n = 748) and validation (n = 322) cohorts. The 5‐year overall survival (OS) rate was 64.1% for the entire group. Based on a multivariate analysis of the primary cohort, seven independent prognostic factors including age, Ann Arbor stage, Eastern Cooperative Oncology Group performance status score, lactate dehydrogenase, β2‐microglobulin, CD5 expression, and Ki‐67 index were identified and entered the nomogram. The calibration curve showed the optimal agreement between nomogram prediction and actual observation. In addition, the concordance index (C‐index) of the nomogram for OS prediction was 0.77 (95% confidence interval [CI], 0.73–0.81) in the primary cohort and 0.76 (95% CI, 0.70–0.81) in the validation, superior to that of the international prognostic index (IPI), revised IPI (R‐IPI), and National Comprehensive Cancer Network (NCCN)‐IPI (range, 0.69–0.74, p<.0001). Moreover, in patients receiving rituximab plus CHOP (R‐CHOP) or R‐CHOP‐like regimens, compared with IPI (C‐index, 0.73; 95% CI, 0.69–0.77), R‐IPI (C‐index, 0.70; 95% CI, 0.66–0.74), or NCCN‐IPI (C‐index, 0.71; 95% CI, 0.66–0.75), the DLBCL‐specific nomogram showed a better discrimination capability (p < .0001).
Conclusions.
The proposed nomogram provided an accurate estimate of survival of patients with DLBCL, especially for those receiving R‐CHOP or R‐CHOP‐like regimens, allowing clinicians to optimized treatment plan based on individualized risk prediction.
Implications for Practice.
A diffuse large B‐cell lymphoma (DLBCL)‐specific prognostic nomogram was developed based on Chinese patients with DLBCL. As a tertiary hospital, National Cancer Center/Cancer Hospital, Chinese Academy of Medical Sciences is the number 1 ranked cancer center in China, with more than 800,000 outpatients in 2018. Patients included in this study were nonselected and came from 29 different provinces, municipalities, and autonomous regions in China. Thus, the data is believed to be representative to an extent.
摘要
目的。本研究旨在构建弥漫性大 B 细胞淋巴瘤 (DLBCL) 的预后列线图,并与传统预后系统进行对比。
材料和方法。2006 年至 2012 年期间,我们在中国医学科学院国家癌症中心/国家癌症临床研究中心/肿瘤医院连续、非选择性纳入了 1 070 例 DLBCL 患者。我们建立了基于 Cox 比例风险模型的列线图。
结果。整个人群分为主要队列 (n = 748) 和验证队列 (n = 322)。整个人群的 5 年总生存率 (OS) 为 64.1%。对主要队列进行多变量分析,发现七个独立预后因素,包括年龄、Ann Arbor 分期、美国东部肿瘤协作组行为状态得分、乳酸脱氢酶、β2‐微球蛋白、CD5 表达和 Ki‐67 指数,并将这七个因素输入列线图。标定曲线与实测结果吻合较好。此外,主要队列的 OS 预测列线图一致性指数(C 指数)为 0.77[95% 可信区间 (CI),0.73‐0.81],验证队列组为 0.76 (95% CI, 0.70‐0.81),优于国际预后指数 (IPI)、修订 IPI (R‐IPI) 和国家综合癌症网络(NCCN)‐IPI(范围 0.69‐0.74,p<0.000 1)。此外,在接受利妥昔单抗联合 CHOP (R‐CHOP) 或R‐CHOP 类方案的患者中,与 IPI(C 指数,0.73; 95% CI, 0.69‐0.77)、R‐IPI(C 指数,0.70; 95% CI, 0.66‐0.74) 或 NCCN‐IPI(C 指数,0.71; 95% CI, 0.66‐0.75)相比,DLBCL 的特异性列线图区分度较好 (p<0.000 1)。
结论。对于 DLBCL 患者,特别是对于接受 R‐CHOP 或 R‐CHOP 类方案的患者,本文所构建的列线图能够准确估计其生存情况,临床医生能够基于个体化风险预测来优化治疗方案。《肿瘤学家》(The Oncologist)2019;24:1–10
实践意义:以中国弥漫性大 B 细胞淋巴瘤 (DLBCL) 患者作为研究基础,构建了 DLBCL 特异性预后列线图。作为三级医院,中国医学科学院国家癌症中心/肿瘤医院是中国排名第一的癌症中心,2018 年门诊患者超过 80 万人次。本研究纳入的患者均为来自中国 29 个省、市、自治区的非选择性患者。因此,可认为这些数据具有一定的代表性。
Introduction
Since 1993, the international prognostic index (IPI) has long been referred to for risk stratification, prognosis prediction, treatment guiding in patients with diffuse large B‐cell lymphoma (DLBCL). The five factors in the IPI score include Ann Arbor stage III/IV, age >60 years, elevated lactate dehydrogenase (LDH), Eastern Cooperative Oncology Group (ECOG) performance status (PS) ≥2, and involvement of at least one extranodal site. Each factor scored one point, and the total allows for patients to be stratified into four discrete groups with a 5‐year overall survival (OS) ranging from 26% to 73% [1].
However, the IPI was developed prior to the era of rituximab. Since the late 1990s, the addition of rituximab to conventional CHOP or CHOP‐like regimens for DLBCL has resulted in a major improvement in survival across all risk groups [2], [3]. Nevertheless, the capacity of the IPI declined in risk stratification, especially in the higher‐risk patients. Analysis of pooled data from three European trials (MInT, MegaCHOEP, and RICOVER‐60), which enrolled adult patients with DLBCL treated with rituximab‐containing regimens, demonstrated a 5‐year OS in the IPI‐defined high‐risk group of approximately 50%. As such, the Kaplan‐Meier curves for OS showed a convergence of high‐intermediate and high‐risk categories [4].
Efforts to improve the IPI discrimination had focused on regrouping the original IPI score or refined categorization of predictive factors during the rituximab era. Sehn et al. announced the revised IPI (R‐IPI) which redistributed the IPI factors into three risk groups from the British Columbia lymphoid cancer registry in 2007 [5]. The R‐IPI identified three prognostic groups with a very good outcome (patients without any risk factors), good outcome (patients with one or two risk factors), and poor outcome (patients with three to five risk factors). After redistribution of the risk factors, the R‐IPI provided us with a more clinically useful risk prediction tool. However, the predictive capacity remained limited in the poor‐risk group, with 5‐year OS over 50%. Recognizing that introduction of new treatment option can alter the previously widely used prognostic system, the National Comprehensive Cancer Network (NCCN)‐IPI was built as an optimized IPI with the goal of improving risk stratification in 2014, using raw clinical data from the NCCN database collected during the rituximab era [6]. Based on a similar set of clinical factors, the NCCN‐IPI applied a refined categorization of age and normalized LDH to better capture the associated increased risk of mortality. Compared with the IPI, the NCCN‐IPI better discriminated low‐ and high‐risk subgroups (5‐year OS: 96% vs. 33%) than the IPI (5‐year OS: 90% vs. 54%). Moreover, unlike the original IPI, which built on patients with diffuse aggressive lymphomas enrolled in clinical trials, the R‐IPI and NCCN‐IPI derived from unselected patients with a confirmed diagnosis of DLBCL in the rituximab era.
The diversity in the clinical features, morphology, immunophenotype, and the genetic and molecular alterations strongly suggested that DLBCL is a heterogeneous group of aggressive B‐cell lymphomas rather than a single clinicopathologic entity [7], [8]. Several clinical features have emerged as promising prognostic factors over the past decades.
The visual format of nomogram indicates a statistical predictive model that can determine how many points are attributed for each variable value. In accordance with this, it has been demonstrated in studies of several malignancies that nomograms permit improved predictive accuracy for clinical outcomes when compared with the former prognostic systems [9], [10], [11]. The intent of this study was to identify prognostic factors for OS, develop and validate a newly applicable prognostic nomogram for patients’ outcome prediction, and to compare its predictive capacity with predefined risk stratifications. To our knowledge, this is the first study to develop a DLBCL‐specific prognostic nomogram based on a large cohort of patients and the first prognostic nomogram based on a DLBCL database in Chinese population.
Subjects, Materials, and Methods
Patients and Study Design
A total of 1,742 patients with DLBCLs between 7 and 97 years were referred to interdisciplinary evaluation, and their data were included in the institutional database from June 2006 to December 2012. Patients who did not have complete clinical information or immunohistochemistry (562 cases), were lost to follow‐up immediately after treatment (95 cases), or were 18 and younger or 80 and older (15 cases) were excluded from this study. We subsequently included 1,070 patients with an age between 18 and 80 years who were diagnosed with DLBCL based on typical histological and immunophenotypic features, according to the World Health Organization classification of Tumors of Haematapoietic and Lymphoid Tissue [12]. Computer‐generated randomized numbers were used to assign 748 patients to the primary cohort and 322 patients to the validation cohort. This project was approved by the Ethics Committee of Cancer Hospital, Chinese Academy of Medical Sciences, and Peking Union Medical College.
Evaluation and Treatment
Pretreatment evaluations included patients’ demographic characteristics; a careful physical examination; blood routine examination; computed tomography scans of the neck, chest, abdomen, and pelvis or positron emission tomography scans of whole body; and bone marrow examination. All patients were staged according to the Ann Arbor staging system and immunohistochemically classified into germinal center B‐cell‐like (GCB) and non‐GCB, referring to the Hans algorithm [13], and stratified according to the original IPI, R‐IPI, and NCCN‐IPI [1], [5], [6].
The majority of patients with localized disease (n = 693, 64.8%) received initial chemotherapy with radiotherapy treatment (n = 423, 61.0%) or chemotherapy alone (n = 229, 33.0%); 5.1% received surgery ± chemotherapy ± radiotherapy (n = 35). Patients with disseminated disease (n = 377, 35.2%) received initial chemotherapy with radiotherapy treatment (n = 66, 17.5%) or chemotherapy alone (n = 298, 79.0%). A total of 604 (56.4%) patients received rituximab plus CHOP (R‐CHOP) or R‐CHOP‐like regimens.
Construction and Validation of the Nomogram
In the design of the nomogram, we identified clinical features that have previously been demonstrated to be associated with survival and incorporated these as prognostic features. These factors included gender, age, ECOG PS score, primary site of tumor invasion (nodal or extranodal), Ann Arbor stage, bulky disease, B symptoms, number of extranodal involvement sites, Ki‐67 expression, CD5 expression, Bcl‐6 expression, immunohistochemical classification referring to the Hans algorithm [13], level of LDH, and serum β2‐microglobulin (β2‐MG). We applied the multivariate Cox proportional hazards model to predicting 5‐year OS for each factor. Internal validation was undertaken with a concordance index (C‐index) being estimated by analyzing the area under the curve of the receiver operating characteristic curve. A calibration plot was then used to show the concordance between predicted and observed probabilities for survival. Finally, we performed external validation, in which the nomogram was applied to assess each patient in the validation cohort. Cox regression analysis was performed using each patient's total score as an independent factor. The regression analysis was used for C‐index and the calibration curve.
Statistical Analysis
OS was calculated from the start of initial treatment until the time of death of any cause or until the last follow‐up. To compare the clinicopathological characteristics of patients, we used the Student's t test and the Chi‐square test. Survival curves were estimated with the Kaplan‐Meier method and compared with a log‐rank test stratified according to the prognostic factors. The nomogram was constructed on the grounds of the Cox model parameter estimates in the primary cohort. A backward step‐down selection process was applied to select the final model. The construction and validation process were performed following the Iasonos’ guide [14]. Statistical analysis was performed using IBM SPSS Statistics, Version 21.0 (IBM; Armonk, NY) and the Hmisc, rms, survival ROC package in R, version 3.0.2 (http://www.R-project.org). Unless otherwise stated, p < .05 was considered significant.
Results
Clinical Features and Survival
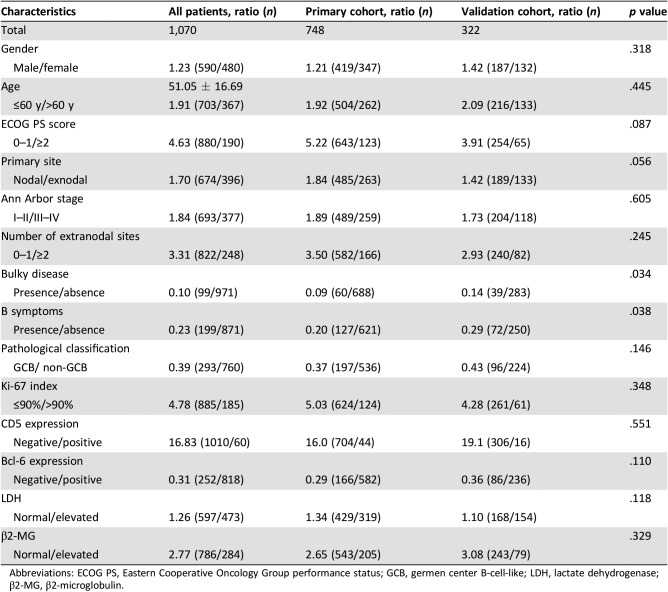
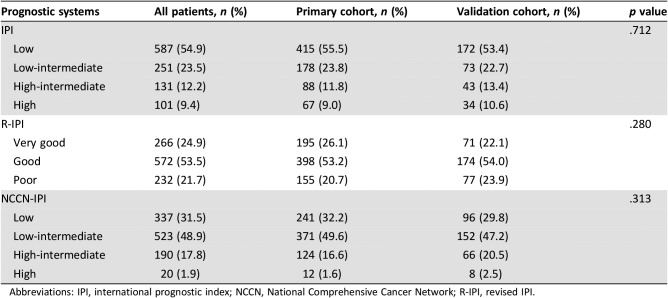
The baseline characteristics of patients with DLBCL are listed in Table 1. The median age was 53 years (range, 18–80); 67.5% patients were aged under 60 years. The male/female ratio was 1.23. Most patients presented with limited‐stage (64.8%), ECOG PS score 0 or 1 (82.2%), and their primary disease commonly located in nodal sites (63.0%). A total 18.6% of patients had B symptoms at diagnosis, and 9.3% of patients had bulky disease. Elevated LDH and elevated β2‐MG were observed in 55.8% and 26.5% of patients, respectively. A total of 5.6% of patients had CD5 expression, whereas the proportions of patients who had bcl‐6 and high Ki‐67 expression (>90%) were 76.4% and 17.3%. GCB patients accounted for 27.8% in all the patients with complete histological results [15]. Up to 54.9% of patients and 31.5% of patients were scored as low‐risk according to the IPI (0 or 1 score) and the NCCN‐IPI (0 or 1 score), respectively. A total of 24.9% of patients were defined as in very good group according to the R‐IPI (Table 2). Comparable clinical characteristics were observed in both cohorts. The median follow‐up time was 57 months for surviving patients. The 5‐year OS rate for the entire group was 64.1% (95% CI, 61.3%–67.0%; Fig. 1).
Table 1. Clinical characteristics of 1,070 patients with diffuse large B‐cell lymphoma.
Abbreviations: ECOG PS, Eastern Cooperative Oncology Group performance status; GCB, germen center B‐cell‐like; LDH, lactate dehydrogenase; β2‐MG, β2‐microglobulin.
Table 2. Traditional prognostic systems of patients with diffuse large B‐cell lymphoma.
Abbreviations: IPI, international prognostic index; NCCN, National Comprehensive Cancer Network; R‐IPI, revised IPI.
Figure 1.
Kaplan‐Meier OS curve for all 1,070 patients included in the analysis.
Abbreviations: CI, confidence interval; OS, overall survival.
Nomogram Construction and Internal Validation
In the univariate analysis, the prognostic factors that affected survival in the primary cohort were as follows: age, ECOG PS score, disease stage, bulky disease, B symptom, number of extranodal involvement sites, Ki‐67 expression; CD5 expression, bcl‐6 expression, classification according to the Hans algorithm, LDH, and β2‐MG level. Multivariate analysis established that age >60 years, ECOG PS score ≥2, disease stage ≥II, elevated LDH, high Ki‐67 expression, positive CD5 expression and elevated β2‐MG were independent risk factors associated with poor outcomes (Table 3).
Table 3. Multivariate analysis of 748 patients in the primary cohort.
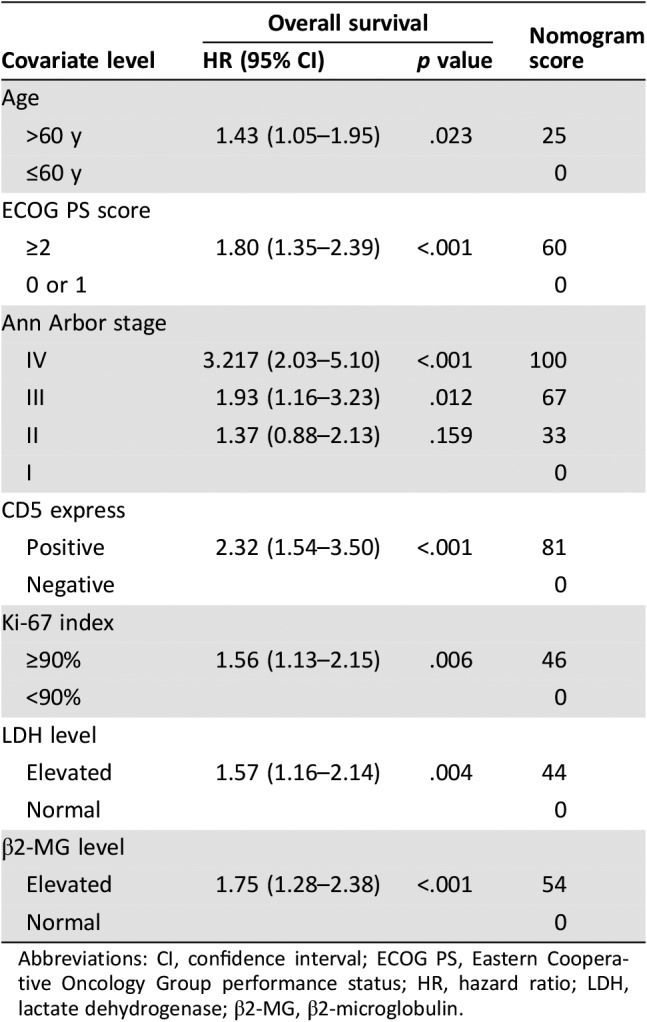
Abbreviations: CI, confidence interval; ECOG PS, Eastern Cooperative Oncology Group performance status; HR, hazard ratio; LDH, lactate dehydrogenase; β2‐MG, β2‐microglobulin.
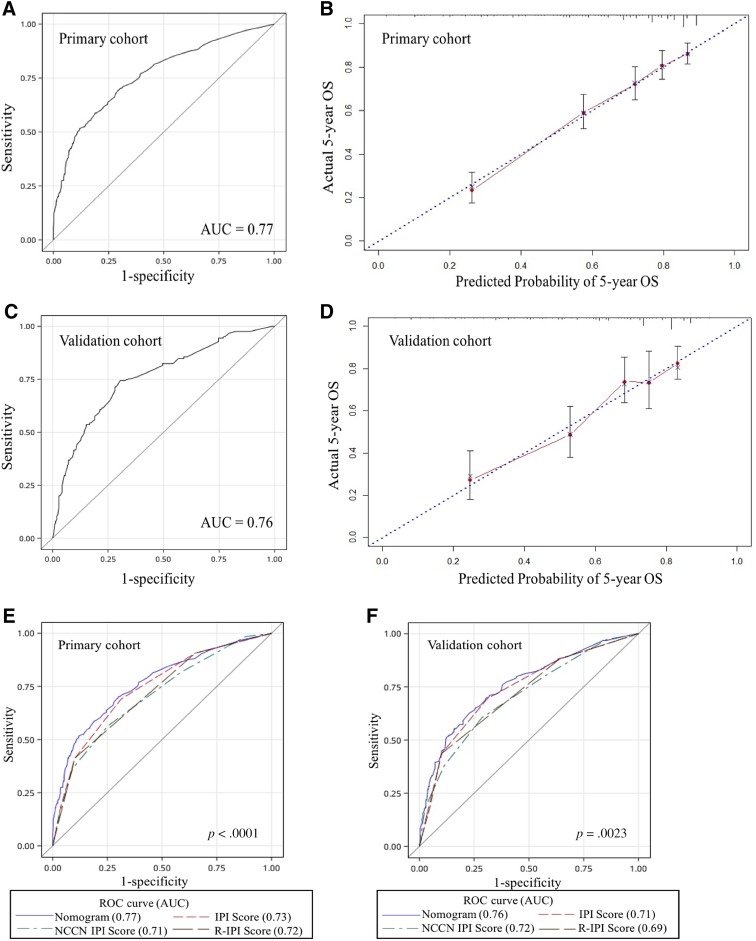
We then developed a nomogram to predict 5‐year OS upon the results from the multivariate analysis (Fig. 2). Age, ECOG PS score, stage, LDH, Ki‐67 expression, CD5 expression, and β2‐MG entered the nomogram. The predictive accuracy for 5‐year OS as measured by the C‐index was 0.77 (95% CI, 0.73–0.81) in the internal validation (Fig. 3A). The calibration plot for the probability of 5‐year OS showed a good correlation between the actual observed outcome and the prediction by the nomogram (Fig. 3B).
Figure 2.
Nomogram for patients with diffuse large B‐cell lymphoma. To use the nomogram, the value attributed to a patient is located on each variable axis, and a line is drawn upwards to determine the number of points received for each variable value. The sum of these numbers is located on the total points axis, and a line is then drawn downwards to the survival axis to determine the 5‐year overall survival likelihood.
Abbreviations: ECOG PS, Eastern Cooperative Oncology Group performance status; LDH, lactate dehydrogenase; β2‐MG, β2‐microglobulin.
Figure 3.
Internal and external validation of the nomogram to predict OS likelihoods in patients with diffuse large B‐cell lymphoma in the primary cohort. (A): The AUC was 0.77 in the internal validation. (B): The nomogram‐predicted probability of OS is plotted on the x‐axis; the actual OS is plotted on the y‐axis in the internal validation. (C): The AUC was 0.76 in the external validation. (D): The nomogram‐predicted probability of OS is plotted on the x‐axis; the actual OS is plotted on the y‐axis in the external validation. The AUC for the prediction of 5‐year OS in different modal in primary (E) and validation cohort (F).
Abbreviations: AUC, area under the ROC curve; IPI, international prognostic index; NCCN, National Comprehensive Cancer Network; OS, overall survival; R‐IPI, revised IPI; ROC, receiver operating characteristic.
External Validation of Nomogram
We further validated this nomogram externally by the calibration plot in Figure 3C and D and by computing the bootstrap C statistic in an independent validation cohort of 322 patients. The C‐index for the prediction of the 5‐year OS was 0.76 (95% CI, 0.70–0.81) in the external validation step (Fig. 3C) and an optimal agreement between the actual observation and the nomogram prediction in 5‐year OS (Fig. 3D), which indicated this nomogram is a model with favorable validity, reliability, and discriminative ability.
Comparison of the Predictive Accuracy for OS Between the Nomogram and Current Prognostic Scoring Systems
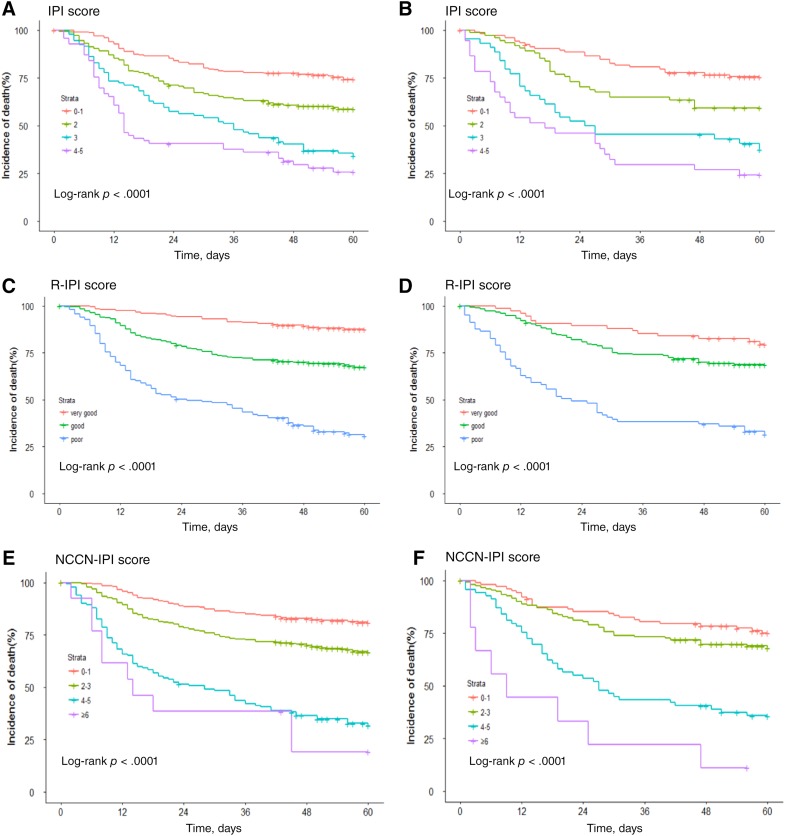
Nomogram and current prognostic scoring systems were applied (Fig. 4). The Kaplan‐Meier survival curves showed a convergence in high‐intermediate and high‐risk groups in validation IPI cohorts (Fig. 4B). Referring to the NCCN‐IPI, the convergence was found in both in primary cohort (Fig. 4C) and validation cohort (Fig. 4D). Furthermore, the R‐IPI was unsatisfactory for stratifying between good and very good patient groups in the validation cohort (Fig. 4F).
Figure 4.
Kaplan‐Meier survival curves of the primary cohort according to the IPI (A), NCCN‐IPI (E) and R‐IPI (C); and the validation cohort according to the IPI (B), NCCN‐IPI (F) and R‐IPI (D).
Abbreviations: IPI, international prognostic index; NCCN, National Comprehensive Cancer Network; R‐IPI, revised IPI.
When compared with IPI, R‐IPI, and NCCN‐IPI, the nomogram displayed better levels of accuracy for predicting survival in both cohorts. The C‐index of the nomogram in the primary cohort (0.77; 95% CI, 0.73–0.81) was higher than the IPI (0.73; 95% CI, 0.70–0.76), R‐IPI (0.72; 95% CI, 0.68–0.75), and NCCN‐IPI (0.71; 95% CI, 0.67–0.74; Fig. 3E). Similarly, in the validation cohort, the C‐index of IPI (0.71; 95% CI, 0.66–0.77), R‐IPI (0.69; 95% CI, 0.63–0.74), and NCCN‐IPI (0.72; 95% CI, 0.66–0.77) were lower than that of the nomogram (0.76; 95% CI, 0.70–0.81; Fig. 3F). The DLBCL‐specific nomogram showed a more accurate for the prediction of OS (p < .0001 in primary cohort and p = .0023 in validation cohort).
Subgroup Analysis in Patients with DLBCL Under R‐CHOP or R‐CHOP‐Like Regimens
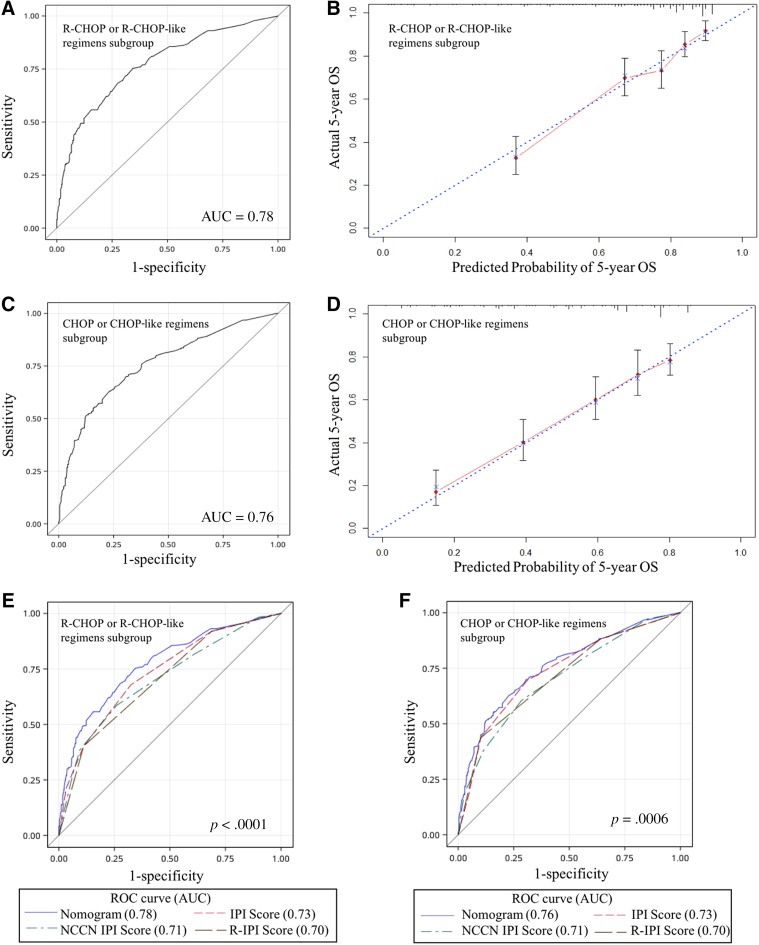
To further assess the utility of the nomogram for R‐CHOP or R‐CHOP‐like regimens, we took subgroup analysis. The C‐index of the nomogram for the 5‐year OS prediction was 0.78 (95% CI, 0.73–0.82) in the patients under R‐CHOP or R‐CHOP‐like regimen (Fig. 5A) and 0.76 (95% CI, 0.71–0.80) in the CHOP or CHOP‐like regimen subgroup (Fig. 5C), which demonstrated that it remained a promising model with powerful discriminative ability in spite of the addition of rituximab. The calibration curve shows good agreement between the predictions from the nomogram and the actual outcomes for the actual outcomes (Fig. 5B, 5D).
Figure 5.
Subgroup analysis in patients with diffuse large B‐cell lymphoma under CHOP or CHOP‐like regimens with or without rituximab. Validation of the nomogram to predict OS likelihoods in patients with R‐CHOP or R‐CHOP‐like regimens in the entire cohort; (A) the AUC was 0.78; (B) the nomogram‐predicted probability of OS is plotted on the x‐axis; the actual OS is plotted on the y‐axis. Validation of the nomogram to predict OS likelihoods in patients with CHOP or CHOP‐like regimens in the entire cohort; (C) the AUC was 0.76. (D) the nomogram‐predicted probability of OS is plotted on the x‐axis; the actual OS is plotted on the y‐axis. The AUC for the prediction of 5‐year OS in different modal in R‐CHOP or R‐CHOP‐like regimens (E) and CHOP or CHOP‐like regimens group (F).
Abbreviations: AUC, area under the ROC curve; IPI, international prognostic index; NCCN, National Comprehensive Cancer Network; OS, overall survival; R‐IPI, revised IPI; ROC, receiver operating characteristic.
The discrimination performance of the DLBCL‐specific nomogram was favorable in patients who received R‐CHOP or R‐CHOP‐like regimens (C‐index, 0.78; 95% CI, 0.73–0.82). Compared with IPI (C‐index, 0.73; 95% CI, 0.69–0.77), R‐IPI (C‐index, 0.70; 95% CI, 0.66–0.74) or NCCN‐IPI (C‐index, 0.71; 95% CI, 0.66–0.75), the DLBCL‐specific prognostic nomogram showed a better discrimination capability (p < .0001; Fig. 5E). Similarly, in the CHOP or CHOP‐like regimens subgroup, the C‐index of IPI (0.73; 95% CI, 0.69–0.78), R‐IPI (0.70; 95% CI, 0.67–0.75), and NCCN‐IPI (0.71; 95% CI, 0.66–0.75) were lower than that of the nomogram (0.76; 95% CI, 0.71–0.80) in the CHOP or CHOP‐like regimens cohort (p = .0006; Fig. 5F). These results suggested that the nomogram was a more powerful tool for the prognosis of patients with DLBCL, especially for the patients under R‐CHOP or R‐CHOP‐like regimens.
Discussion
For the past decades, the IPI has been the basis for initial risk stratification for patients with DLBCL, paving the way for guiding treatment selection, balancing within clinical trials, and comparing among studies. However, its capacity to discriminate among risk groups has declined with the addition of rituximab to CHOP or CHOP‐like regimens.
Efforts to characterized the biological basis for prognosis in DLBCL using immunohistochemical or molecular techniques have identified a variety of biomarkers and gene signatures with prognostic significance [15], [16], [17], [18], [19], [20]. For the most part, these novel prognostic markers are independent of the clinically based IPI but add little to its prognostic power [21]. This is largely the result of intrinsic limitations in the application of these markers related to technical limitations or poor reproducibility.
The DLBCL‐specific prognostic nomogram aimed to estimate the probability of 5‐year OS based on a multivariate Cox proportional hazards model that included seven clinical variables measured at presentation. Based on a large patient population, the nomogram has been validated as a reliable tool to predict survival in these patients, independent of treatment, and has been shown to be superior to IPI, R‐IPI, and NCCN‐IPI. Furthermore, the clinical variables that we have incorporated into the nomogram will be documented by any physician caring for patients with DLBCL, enhancing its practical utility.
The final nomogram model consisted of seven variables from routine clinical practice: age, ECOG PS score, Ann Arbor stage, LDH, Ki‐67 expression, CD5 expression, and β2‐MG. The most significant factor with regard to prognostic relevance to OS in the multivariate analysis was the Ann Arbor stage. In contrast to the IPI, R‐IPI, and NCCN‐IPI, the DLBCL‐specific prognostic nomogram included Ki‐67 expression, CD5 expression, and β2‐MG as novel independent predictive factor for OS and excluded the number of extranodal involvement site.
Ki‐67, a surrogate marker of proliferation, has been investigated in various neoplasms and found to be a powerful prognostic factor for survival outcomes [22], [23]. Patients with highly proliferative tumors show much poorer survival than those with tumors characterized by low proliferation [24]. In a previous study, patients with DLBCL with high Ki‐67 expression received limited survival benefits from R‐CHOP therapy [25]. In accordance with previous studies, our results indicated that high Ki‐67 expression was associated with adverse clinical behaviors for DLBCL.
CD5‐positive DLBCL, composing about 5%–10% of DLBCL [26], had been suggested to be recognized as a subtype of DLBCL with aggressive clinical behavior [27]. In Japanese patients with DLBCL, CD5 positivity was found to correlated with old age, short survival, advanced stage, elevated serum LDH, poor performance status, high IPI, CD10 negativity, and non‐GCB subtype [28]. Similar to former studies, our study on Chinese patients with DLBCL proved the prognostic value of CD5 and included this marker in the nomogram.
β2‐MG is synthesized in almost all nucleated cells and constitutes the light chain subunit of the human leukocyte antigen‐I (HLA‐I), which is distributed on cellular membrane [29]. Investigators conducting studies in DLBCL [30] speculated that higher serum β2‐MG levels correlated with the absence of HLA‐I expression, which could lead to a defective recognition of tumor‐specific antigens by T cells. In accordance with previous studies, elevated β2‐MG was proved to be associated with adverse clinical behaviors in DLBCL and included in the nomogram.
Primary nodal or extranodal involvement is a controversial issue in lymphoma [31]. Patients with purely nodal or extranodal involvement are easily classified. The cases with extensive disease, involving both nodal and extranodal areas, are difficult to categorize. With the involvement of treatment measure, whether it remained a potent prognostic marker was uncertain. With regard to our study, multiple extranodal involvement did not show independent predictive value when standard variables were evaluated in multivariate analysis.
The effects of several clinical variables are integrated by the nomogram to give an individualized risk assessment for each patient. Validated internally and externally, and compared with the IPI, R‐IPI, and NCCN‐IPI, this newly developed nomogram showed favorable ability of survival prediction. Moreover, in patients treated with R‐CHOP or R‐CHOP‐like regimens, the predictive accuracy remained satisfactory. The C‐index of the nomogram for OS prediction was superior to the predictive power of the IPI, R‐IPI, and NCCN‐IPI.
Based on the data in our DLBCL database collected from June 2006 to December 2012, the newly DLBCL‐specific prognostic nomogram developed upon a large cohort of patients under CHOP or CHOP‐like regimens with or without rituximab. In order to assess the accuracy of the nomogram for R‐CHOP or R‐CHOP‐like regimens, we took subgroup analysis. The C‐index of the nomogram for the prediction of the 5‐year OS was 0.78 in the R‐CHOP or R‐CHOP‐like regimen subgroup, which demonstrated that it is a model with a good level of discriminative ability. When compared with IPI, R‐IPI, and NCCN‐IPI, the nomogram displayed significantly better levels of accuracy for predicting survival in R‐CHOP or R‐CHOP‐like regimens subgroup. Because of the involved data of patients under CHOP or CHOP‐like regimens with or without rituximab, the newly DLBCL‐specific prognostic nomogram is a comprehensive evaluation tool. This DLBCL‐specific prognostic nomogram has guiding sigificance both for the patients treated with CHOP or CHOP‐like regimens with or without rituximab.
Previous research has shown that biological behavior of DLBCL differs between the East and the West. A study involving 98 patients in China with histologically and immunohistochemically diagnosed DLBCL was divided by Hans immunophenotyping into 21 GCB cases (21.4%) and 77 non‐GCB cases (78.6%) [32], whereas the proportion of subtypes in Western patients was 42% and 58%, respectively [33]. The DLBCL‐specific prognostic nomogram is the first study based on a large cohort of patients and the first prognostic nomogram based on a DLBCL database in Chinese population. It can help to characterize a prognosis of DLBCL with practical guiding significance, especially for Chinese patients.
Although the nomogram model demonstrated good levels of accuracy for the prediction of OS, there are some limitations to our model. First, our study was based on a general population of patients with DLBCL instead of randomized clinical studies. However, this result should be validated prospectively in routine patient care and applied for treatment plan guiding. Second, the current study was performed on the basis of a single center database in China. Thus, it remains unclear whether this nomogram can be applied to patients from other geographical regions or nonendemic areas.
Conclusion
The DLBCL‐specific prognostic nomogram is a technically robust and clinically useful tool to stratify survival of DLBCL patients based on a large cohort in China. The nomogram described here, which well demonstrated the incremental value of clinical‐pathologic risk factors for individualized OS estimation, may serve as a potential tool to aid clinicians in prognosis prediction and treatment planning interpretation of clinical trials in patients with DLBCL, although this will require further external validation before widespread implementation in clinical practice.
Acknowledgments
We thank the patients, their families, and all investigators who participated in the study, and would like to thank Anxin Wang for biostatistics support. This study was primary funded by grants from the National Key Technology Support Program (Grant No. 2014BAI09B12) and Chinese Academy of Medical Sciences Innovation Fund for Medical Sciences (Grant No. 2016‐I2M‐1‐001).
Contributed equally.
Author Contributions
Conception/design: Yuankai Shi
Collection and/or assembly of data: Ying Han
Data analysis and interpretation: Ying Han, Jianliang Yang, Peng Liu, Xiaohui He, Changgong Zhang, Shengyu Zhou, Yan Qin, Yongwen Song, Yuankai Shi
Manuscript writing: Ying Han, Jianliang Yang, Peng Liu, Xiaohui He, Changgong Zhang, Shengyu Zhou, Yan Qin, Yongwen Song, Yuankai Shi
Final approval of manuscript: Ying Han, Jianliang Yang, Peng Liu, Xiaohui He, Changgong Zhang, Shengyu Zhou, Liqiang Zhou, Yan Qin, Yongwen Song, Yan Sun, and Yuankai Shi
Disclosures
The authors indicated no financial relationships.
References
- 1.International Non‐Hodgkin's Lymphoma Prognostic Factors Project . A predictive model for aggressive non‐Hodgkin's lymphoma. N Engl J Med 1993;329:987–994. [DOI] [PubMed] [Google Scholar]
- 2.Coiffier B, Lepage E, Briere J et al. CHOP chemotherapy plus rituximab compared with CHOP alone in elderly patients with diffuse large B‐cell lymphoma. N Engl J Med 2002;346:235–242. [DOI] [PubMed] [Google Scholar]
- 3.Habermann TM, Weller EA, Morrison VA et al. Rituximab‐CHOP versus CHOP alone or with maintenance rituximab in older patients with diffuse large B‐cell lymphoma. J ClinOncol 2006;24:3121–3127. [DOI] [PubMed] [Google Scholar]
- 4.Ziepert M, Hasenclever D, Kuhnt E et al. Standard international prognostic index remains a valid predictor of outcome for patients with aggressive CD20+ B‐cell lymphoma in the rituximab era. J ClinOncol 2010;28:2373–2380. [DOI] [PubMed] [Google Scholar]
- 5.Sehn LH, Berry B, Chhanabhai M, Fitzgerald C, Gill K, Hoskins P, et al. The revised International Prognostic Index (R‐IPI) is a better predictor of outcome than the standard IPI for patients with diffuse large B‐cell lymphoma treated with R‐CHOP. Blood 2007;109:1857–1861. [DOI] [PubMed] [Google Scholar]
- 6.Zhou Z, Sehn LH, Rademaker AW et al. An enhanced International Prognostic Index (NCCN‐IPI) for patients with diffuse large B‐cell lymphoma treated in the rituximab era. Blood 2014;123:837–842. [DOI] [PMC free article] [PubMed] [Google Scholar]
- 7.Harris NL, Jaffe ES, Stein H et al. A revised European‐American classification of lymphoid neoplasms: A proposal from the International Lymphoma Study Group. Blood 1994;84:1361–1392. [PubMed] [Google Scholar]
- 8.Pileri SA, Dirnhofer S, Went P et al. Diffuse large B‐cell lymphoma: One or more entities? Present controversies and possible tools for its subclassification. Histopathology 2002;41:482–509. [DOI] [PubMed] [Google Scholar]
- 9.Albert JM, Liu DD, Shen Y et al. Nomogram to predict the benefit of radiation for older patients with breast cancer treated with conservative surgery. J Clin Oncol 2012;30:2837–2843. [DOI] [PMC free article] [PubMed] [Google Scholar]
- 10.Han DS, Suh YS, Kong SH et al. Nomogram predicting long‐term survival after d2 gastrectomy for gastric cancer. J ClinOncol 2012;30:3834–3840. [DOI] [PubMed] [Google Scholar]
- 11.Yang Y, Zhang YJ, Zhu Y, Cao JZ, Yuan ZY, Xu LM, et al. Prognostic nomogram for overall survival in previously untreated patients with extranodal NK/T‐cell lymphoma, nasal‐type: A multicenter study. Leukemia 2015;29:1571–1577. [DOI] [PubMed] [Google Scholar]
- 12.Swerdlow SH, Campo E, Harris NL et al. WHO Classification of Tumors of Haematopoietic and Lymphoid Tissue. 4th ed. Lyon, France: IARC Press; 2008. [Google Scholar]
- 13.Hans CP, Weisenburger DD, Greiner TC et al. Confirmation of the molecular classification of diffuse large B‐cell lymphoma by immunohistochemistry of diffuse using a tissue microarray. Blood 2004;103:275–282. [DOI] [PubMed] [Google Scholar]
- 14.Iasonos A, Schrag D, Raj GV et al. How to build and interpret a nomogram for cancer prognosis. J Clin Oncol 2008;26:1364–1370. [DOI] [PubMed] [Google Scholar]
- 15.Lossos IS, Czerwinski DK, Alizadeh AA et al. Prediction of survival in diffuse large B‐cell lymphoma based on the expression of six genes. N Engl J Med 2004;350:1828–1837. [DOI] [PubMed] [Google Scholar]
- 16.Alizadeh AA, Gentles AJ, Alencar AJ et al. Prediction of survival in diffuse large B‐cell lymphoma based on the expression of 2 genes reflecting tumor and microenviroment. Blood 2011;118:1350–1358. [DOI] [PMC free article] [PubMed] [Google Scholar]
- 17.Lenz G, Wright G, Dave SS et al. Lymphoma/Leukemia Molecular Profiling Project. Stromal gene signatures in large B‐cell lymphoma. N Engl J Med 2008;359:2313–2323. [DOI] [PMC free article] [PubMed] [Google Scholar]
- 18.Lossos IS, Morgensztern D. Prognostic biomarkers in diffuse large B‐cell lymphoma. J ClinOncol 2006;24:995–1007. [DOI] [PubMed] [Google Scholar]
- 19.Meyer PN, Fu K, Greiner TC et al. Immunohistochemical methods for predicting cell of origin and survival in patients with diffuse large B‐cell lymphoma treated with rituximab. J Clin Oncol 2011;29:200–207. [DOI] [PMC free article] [PubMed] [Google Scholar]
- 20.Shipp MA, Ross KN, Tamayo P et al. Diffuse large B‐cell lymphoma outcome prediction by gene‐expression profiling and supervised machine learning. Nat Med 2002;8:68–74. [DOI] [PubMed] [Google Scholar]
- 21.Hong F, Kahl BS, Gray R. Incremental value in outcome prediction with gene expression‐based signatures in diffuse large B‐cell lymphoma. Blood 2013;121:156–158. [DOI] [PubMed] [Google Scholar]
- 22.Dziegiel P, Salwa‐Zurawska W, Zurawski J et al. Prognostic significance of augmentedmetallothionein (MT) expression correlated with Ki‐67 antigen expression in selected soft tissue sarcomas. Histo Histopathol 2005;20:83–89. [DOI] [PubMed] [Google Scholar]
- 23.Szczuraszek K, Mazur G, Jeleń M et al. Prognostic significance of Ki‐67 antigen expression in non‐Hodgkin's lymphoma. Anticancer Res 2008;28:1113–1118. [PubMed] [Google Scholar]
- 24.Klapper W, Hoster E, Determann O et al. Ki‐67 as a prognostic marker in mantle cell lymphoma‐consensus guidelines of the pathology panel of the European MCL Network. J Hematop 2009;2:103–111. [DOI] [PMC free article] [PubMed] [Google Scholar]
- 25.Li ZM, Huang JJ, Xia Y et al. High Ki‐67 expression in diffuse large B‐cell lymphoma patients with non‐germinal center subtype indicates limited survival benefit from R‐chop therapy. Eur J Haematol 2012;88:510–517. [DOI] [PubMed] [Google Scholar]
- 26.Harada S, Suzuki R, Uehira K et al. Molecular and immunological dissection of diffuse large B‐cell lymphoma: CD5+, and CD5‐ with CD10+ groups may constitute clinically relevant subtypes. Leukemia 1999;13:1441–1447. [DOI] [PubMed] [Google Scholar]
- 27.Jain P, Fayad LE, Rosenwald A et al. Recent advances in de novo CD5+ diffuse large B‐cell lymphoma. Am J Hematol 2013;88:798–802. [DOI] [PubMed] [Google Scholar]
- 28.Niitsu N, Okamoto M, Tamaru JI et al. Clinicopathologic characteristics and treatment outcome of the addition of rituximab to chemotherapy for CD5‐positive in comparison with CD5‐negative diffuse large B‐cell lymphoma. Ann Oncol 2010;21:2069–2074. [DOI] [PubMed] [Google Scholar]
- 29.Bjorkman PJ, Burmeister WP. Structures of two classes of MHC molecules elucidated: crucial differences and similarities. Curr Opin Struct Biol 1994;4:852–856. [DOI] [PubMed] [Google Scholar]
- 30.Miyashita K, Tomita N, Taguri M et al. Beta‐2 microglobulin is a strong prognostic factor in patients with DLBCL receiving R‐CHOP therapy. Leuk Res 2015;39:1187–1191. [DOI] [PubMed] [Google Scholar]
- 31.Krol ADG, le Cessie S, Snijder S et al. Primary extranodal non‐Hodgkin's lymphoma (NHL): The impact of alternative definitions tested in the Comprehensive Cancer Centre West population‐based NHL registry. Ann Oncol 2003;14:131–139. [DOI] [PubMed] [Google Scholar]
- 32.Xiafei C, Wei S, Miao S et al. Analysis of clinical pathological factors of germinal center type and non‐germinal center type diffuse large B‐cell lymphoma [in Chinese]. China Pra Med 2016;11:20–21. [Google Scholar]
- 33.Hans CP, Weisenburger DD, Greiner TC et al. Confirmation of the molecular classification of diffuse large B‐cell lymphoma by immunohistochemistry using a tissue microarray. Blood 2004; 1031:275–282. [DOI] [PubMed] [Google Scholar]


