Evidence shows that sarcopenia and systemic inflammation are closely associated with poor prognosis from malignant tumors. This article assesses the prognostic efficacy of preoperative sarcopenia and systemic inflammation and reports a novel prognostic score based on these factors to predict long‐term outcomes for patients with resectable gastric cancer.
Keywords: Gastric cancer, Sarcopenia, Systemic inflammation, Prognosis
Abstract
Objective.
The aim of this study was to investigate the prognostic value of preoperative sarcopenia and systemic inflammation for patients with resectable gastric cancer (GC) and develop a novel and powerful prognostic score based on these factors.
Materials and Methods.
Patients with GC who underwent radical gastrectomy between December 2009 and December 2013 were included. A multivariate Cox regression analysis was performed to identify the prognostic factors. A novel prognostic score (SLMR) was developed based on preoperative sarcopenia and the lymphocyte‐monocyte ratio (LMR), and its prognostic value was evaluated.
Results.
In total, 1,167 patients with resectable GC were included in the study. On multivariate analysis, preoperative sarcopenia and the LMR were shown to be independent prognostic factors (both p < .001). A low LMR was an independent predictor from sarcopenia (p < .001). Based on preoperative sarcopenia and the LMR, we established the SLMR. An elevated SLMR was associated with older age, higher ASA scores, larger tumor size, advanced stages, and vascular invasion (all p < .05). Multivariate analysis revealed that the SLMR was a significant independent predictor (p < .001). We incorporated the SLMR into a prognostic model that included tumor size and TNM stage and generated a nomogram, which accurately predicted 3‐ and 5‐year survival for GC patients.
Conclusion.
Preoperative systemic inflammation is significantly associated with sarcopenia. The LMR combined with sarcopenia could enhance prognostication for patients with GC who underwent radical gastrectomy.
Implications for Practice.
Increasing evidence shows that sarcopenia and systemic inflammation are closely associated with the prognosis of malignant tumors, and it is essential for clinicians to understand the relationship and combined prognostic effects of these factors for gastric cancer (GC). Based on a large data set, this study found that preoperative systemic inflammation was significantly associated with sarcopenia in GC, and combining these two predictors could effectively predict the prognosis and complement the prognostic value of the TNM staging system. These findings may lead to the development of new therapeutic avenues to improve cancer outcomes.
摘要
目标。本研究的目的在于调查可切除性胃癌 (GC) 患者出现术前肌肉减少症和全身炎症的预后价值,并根据这些因素建立新的有效预后评分。
材料和方法。我们招募了 2009 年 12 月至 2013 年 12 月接受胃癌根治术的GC患者。采用多变量 Cox 回归分析确定了预后因素。我们根据术前肌肉减少症和淋巴细胞与单核细胞比率 (LMR) 建立了新的预后评分 (SLMR),并评估了其预后价值。
结果。本研究共招募了 1 167 名可切除性GC患者。多变量分析显示,术前肌肉减少症和LMR属于独立预后因素(两者的 p < 0.001)。LMR低是肌肉减少症的独立预测因子 (p < 0.001)。根据术前肌肉减少症和LMR,我们确立了SLMR。SLMR升高与年龄较大、ASA 评分较高、肿瘤尺寸较大、晚期胃癌和血管浸润(所有的 p < 0.05)有关。多变量分析表明,SLMR是重要的独立预测因子 (p < 0.001)。我们将SLMR纳入包括肿瘤尺寸和 TNM 分期的预后模型中,并生成了列线图,准确预测胃癌患者的 3 年和 5 年生存率。
结论。术前全身炎症与肌肉减少症显著相关。LMR结合肌肉减少症可加强对接受过胃癌根治术的GC患者的预后。
实践意义:越来越多的证据表明,肌肉减少症和全身炎症与恶性肿瘤的预后密切相关,临床医生必须了解这些因素与胃癌 (GC) 的关系及综合预后效果。基于大量的数据集,本研究发现,术前全身炎症与GC肌肉减少症显著相关,将这两种预测因子相结合,可有效预测预后并补强 TNM 分期系统的预后价值。上述结果让我们可以开发新的治疗途径,进而改善癌症预后。
Introduction
Gastric cancer (GC) is the fifth most common malignancy and the third most common cause of cancer‐related death worldwide [1]. Despite advancements in surgical techniques and adjuvant therapy, the survival of patients with advanced GC remains poor [2]. Early detection of which patients with GC who are at a high risk of adverse treatment outcomes and premature mortality has been a long‐standing clinical problem. Recently, there have been accumulating studies that have proven that sarcopenia and systemic inflammation are closely associated with a poor prognosis from malignant tumors [3], [4], [5]. Sarcopenia, a syndrome characterized by the progressive and generalized loss of skeletal muscle mass and strength, is associated with a poor surgical outcome [6]. Systemic inflammation has been reported to play a critical role in the pathogenesis and progression of cancer [7]. Preoperative hematological inflammatory biomarkers, including blood neutrophil, lymphocyte, monocyte, and platelet count, albumin (Alb) level and their combination such as the neutrophil‐lymphocyte ratio (NLR), lymphocyte‐monocyte ratio (LMR), and platelet‐lymphocyte ratio (PLR), which have been reported could reflect systemic and local inflammation associated with cancer progression and prognosis [8], [9], [10]. Some studies have shown that systemic inflammation is associated with the cardinal features of muscle depletion, including decreased quality of life, or increased risk of morbidity and mortality [11]. However, whether preoperative sarcopenia is associated with systemic inflammation and the combined prognostic effect of these factors for patients with GC remain largely unknown. Therefore, the aim of this study was to assess the prognostic efficacy of preoperative sarcopenia and systemic inflammation, and develop a novel and powerful prognostic score based on these factors to most efficiently predicts long‐term outcomes for patients with resectable GC.
Subjects, Materials, and Methods
Study Population
We retrospectively reviewed data collected from patients who underwent radical gastrectomy at Fujian Medical University Union Hospital from December 2009 to December 2013. The following inclusion criteria were applied: (a) a histologically confirmed adenocarcinoma of the stomach; (b) no evidence of tumors invading adjacent organs, paraaortic lymph node enlargement or distant metastasis demonstrated by abdominal computed tomography and/or abdominal ultrasound and posteroanterior chest radiography; and (c) a D1/D1+/D2 lymphadenectomy with a curative R0 resection. The case exclusion criteria were as follows: (a) patients with T4b tumors, (b) metastatic disease, (c) gastric stump carcinoma, (d) patients with no available computed tomography (CT) imaging or with a preoperative CT image older than 30 days, and (e) patients with incomplete or inaccurate medical records. In total, 1,167 patients were included in the study (supplemental online Fig. 1). All surgical procedures, including D2 lymphadenectomy, were performed according to the guidelines of the Japanese Gastric Cancer Association [12]. Staging was performed according to the corresponding eighth edition of the American Joint Committee on Cancer (AJCC) Staging Manual [13]. Adjuvant chemotherapy using 5‐fluorouracil‐based regimens (mostly oxaliplatin with either capecitabine or S‐1) was recommended for the majority of patients with advanced GC [14], [15]. In our study, all patients with elective gastric surgery were divided into three groups according to preoperative American Society of Anesthesiologists (ASA) scoring system, as follows: an ASA score of 1 (healthy person), an ASA score of 2 (mild systemic disease), or an ASA score of 3 (severe systemic disease) [16].
Definition of Sarcopenia
In this study, CT‐based measurements were performed using Software OsiriX, version 3.3 (32‐bit; http://www.osirix-viewer.com) by a single trained researcher who was blinded to the outcome [17]. The cross‐sectional skeletal muscle surface area (cm2) was measured, based on attenuation thresholds of −29 to +150 Hounsfield units, at the level of the third lumbar vertebra (L3) on two consecutive transverse slices in which both vertebral spines were visible, and the average surface (cm2) of the two consecutive slices was used for the analyses (supplemental online Fig. 2). Muscle areas were normalized for height (m2) to obtain the L3 skeletal muscle index (SMI; cm2/m2) [18]. Single‐slice muscle area at the third lumbar vertebra strongly correlated with the whole‐body volume of muscle tissue and has been extensively used in oncology settings [19]. Based on our previous reports [6], the optimal cutoff levels for SMI were calculated by the X‐tile software (Yale University, New Haven, CT) [20]. In the current study, preoperative sarcopenia was defined as follows: for men, an SMI less than 36.4 cm2/m2; for women, an SMI less than 28.4 cm2/m2.
Markers of Systemic Inflammation
The hematological and laboratory parameters were obtained within 1 week before surgery [21]. These included the neutrophil count, lymphocyte count, platelet count, and Alb level. The NLR was defined by dividing the neutrophil count by the lymphocyte count. The PLR was defined by dividing the platelet count by the lymphocyte count. The LMR was defined by dividing the lymphocyte count by the monocyte count. The optimal cutoff values for the NLR, PLR, and LMR were calculated by the X‐tile software [20], and were 2.6, 160.7, and 3.4, respectively.
Follow‐up Investigation
A postoperative follow‐up assessment was performed every 3 months, for 2 years, and then every 6 months, during years 2–5. The final follow‐up evaluation was conducted in December 2017. Most routine follow‐up appointments included a physical examination, laboratory testing (including cancer antigen [CA] 19‐9, CA72‐4, and carcinoembryonic antigen‐level measurements), chest radiography, and abdominopelvic ultrasonography or computed tomography, along with an annual endoscopic examination. Overall survival (OS) was defined as the time from surgery to death from any cause or to the time of censoring on the date of the last follow‐up.
Statistical Analysis
Descriptive statistics were used to summarize preoperative sarcopenia, markers of systemic inflammation, and other cohort characteristics. Categorical variables were analyzed using the chi‐square or Fisher's exact test, whereas continuous variables were analyzed using Student's t tests. Univariate and multivariate logistical regressions were used to assess the relationship between preoperative sarcopenia and systemic inflammation. Survival curves were constructed according to the Kaplan‐Meier method, and differences between curves were analyzed using the log‐rank test. Variables that significantly affected survival were investigated using multivariate analysis, according to the Cox regression model. A nomogram was created by R software, using the “rms” package. Calibration plots were generated to examine the performance characteristics of the predictive nomogram. The Harrell's Concordance index (C‐index) and time‐dependent receiver operating characteristic (t‐ROC) curves were used to quantify the predictive accuracy [22], [23]. All tests were two‐sided, and statistical significance was inferred at a p value of < .05. Statistical analyses were performed using SPSS for Windows version 18.0 (SPSS Inc., Chicago, IL) and R ver. 3.1.2 (R Foundation for Statistical Computing, Vienna, Austria). The R package “timeROC” was used for t‐ROC analyses.
Results
Clinicopathological Characteristics
Of the 1,167 patients with GC included in the study, 892 (76.4%) were men and 275 (23.6%) were women; their median age was 61 years (interquartile range, 54–68). Almost half the tumors were located in the lower third of the stomach (n = 553; 47.4%). The distribution of TNM staging was as follows: 342 (29.3%) patients with stage I, 285 (24.4%) with stage II, and 540 (46.3%) with stage III disease. The prevalence of sarcopenia was 22.8% (n = 266; supplemental online Table 1).
Survival Analysis
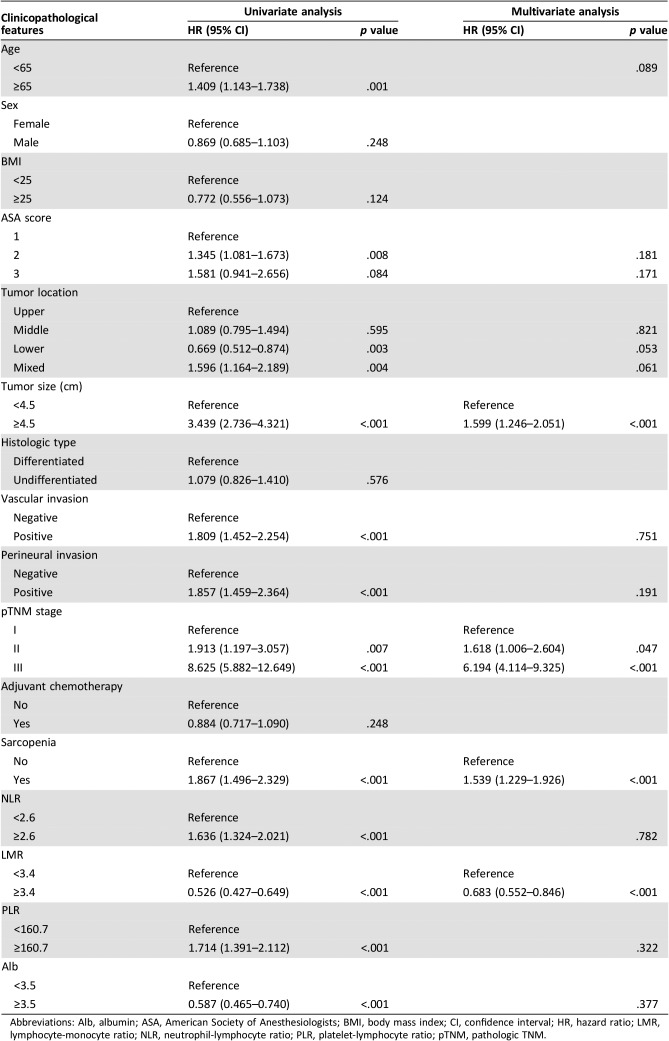
The median follow‐up period was 69.0 months (range, 1–96). The 5‐year OS rate for the entire cohort was 68.2%. Univariate analysis showed that preoperative sarcopenia, NLR, PLR, LMR, and Alb were associated with OS (all p < .05, Table 1). In addition, other variables, including age, the ASA score, tumor location, size, vascular invasion, perineural invasion, and TNM stage, also had prognostic significance for OS (all p < .05, Table 1). In multivariate analyses, age, ASA score, tumor location, size, vascular invasion, perineural invasion, TNM stage, NLR, PLR, and Alb all were not independent prognostic factors for GC (all p > .05). However, both preoperative sarcopenia (hazard ratio [HR], 1.539; 95% confidence interval [CI], 1.229–1.926; p < .001) and a high LMR (LMR ≥3.4; HR, 0.683; 95% CI, 0.552–0.846; p < .001) were still independent prognostic factors (Table 1).
Table 1. Univariate and multivariate analysis of clinicopathologic variables in relation to overall survival in patients undergoing potentially curative resection of gastric cancer.
Abbreviations: Alb, albumin; ASA, American Society of Anesthesiologists; BMI, body mass index; CI, confidence interval; HR, hazard ratio; LMR, lymphocyte‐monocyte ratio; NLR, neutrophil‐lymphocyte ratio; PLR, platelet‐lymphocyte ratio; pTNM, pathologic TNM.
Correlations Between Sarcopenia and Systemic Inflammation
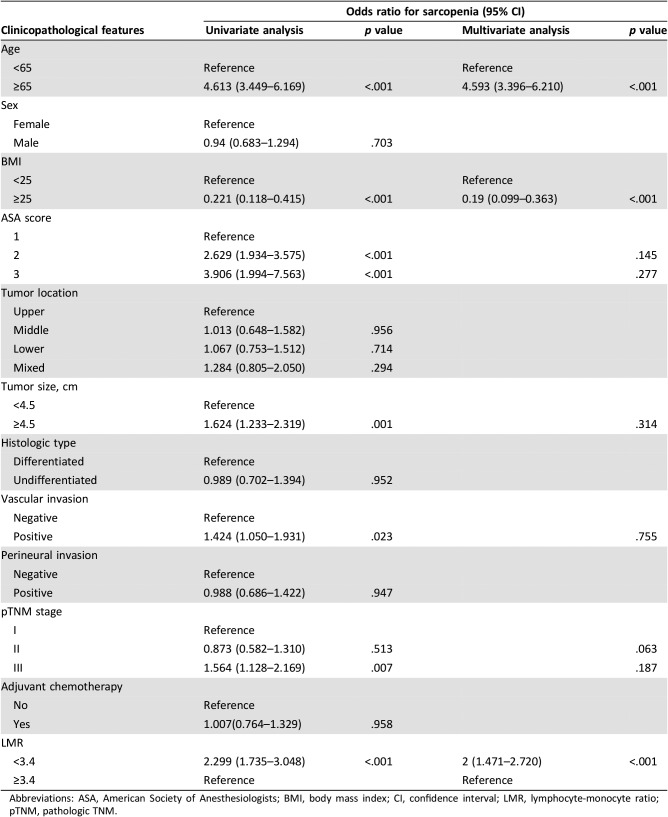
To investigate whether systemic inflammation, expressed as the LMR, was associated with sarcopenia, univariate and multivariate logistic regression analyses were performed. Univariate analysis identified the LMR, age, ASA score, tumor size, vascular invasion, and TNM stage to be predictors of sarcopenia. Multivariate analysis showed that a low LMR (OR, 2.000; 95% CI, 1.471–2.720; p < .001, respectively) was an independent predictor of sarcopenia, together with age and BMI (Table 2). Furthermore, the results were consistent across other markers of systemic inflammation, with a higher NLR, a higher PLR, and hypoalbuminemia all shown to be independently associated with a higher chance of sarcopenia (all p < .001, supplemental online Table 2).
Table 2. The relationship between sarcopenia and clinicopathological parameters.
Abbreviations: ASA, American Society of Anesthesiologists; BMI, body mass index; CI, confidence interval; LMR, lymphocyte‐monocyte ratio; pTNM, pathologic TNM.
Establishment of the Prognostic Score Based on Sarcopenia and the LMR
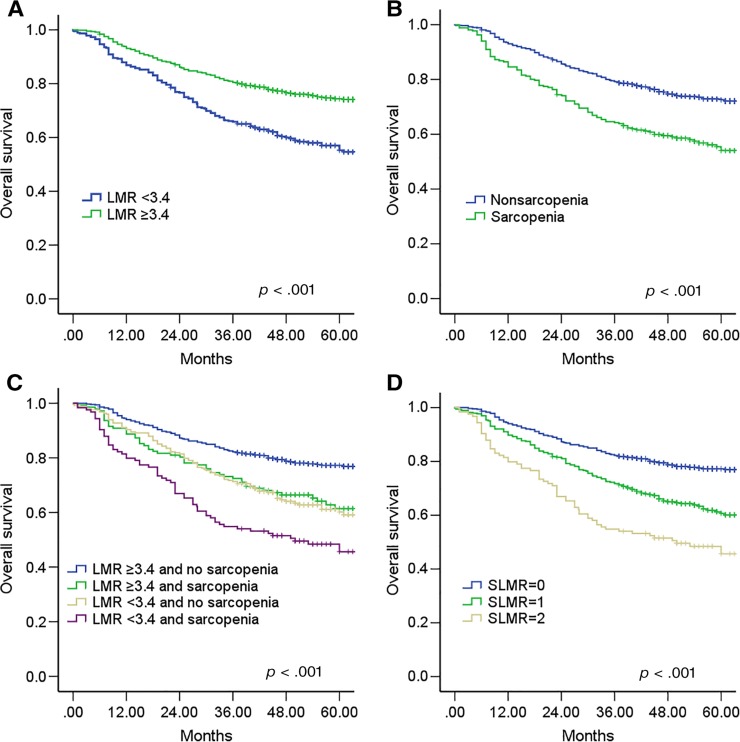
As observed in the Kaplan‐Meier curves, preoperative sarcopenia and a low LMR were both associated with a worse OS (both p < .001; Fig. 1A, 1B). To further discriminate between patients with different outcomes, we combined sarcopenia and LMR levels to generate four subgroups. Patients with sarcopenia and an LMR <3.4 had the worst survival, whereas patients with no sarcopenia and an LMR ≥3.4 survived the longest (p < .001, Fig. 1C). However, the survival of patients with no sarcopenia and an LMR < 3.4 was similar to that of patients with sarcopenia and an LMR ≥3.4 (p > .05). Thus, we combined the two subgroups to establish the sarcopenia and the LMR (SLMR) defined as follows: patients with neither sarcopenia or an LMR ≥3.4 were assigned a score of 0; patients with either sarcopenia or an LMR <3.4 were assigned a score of 1, and patients with both sarcopenia and an LMR <3.4 were assigned a score of 2 (supplemental online Table 3).
Figure 1.
Kaplan‐Meier analysis for overall survival (OS) of patients with gastric cancer according to the preoperative LMR and sarcopenia. Kaplan‐Meier analysis for OS according to (A) preoperative LMR, (B) preoperative sarcopenia, (C) combination of preoperative LMR and sarcopenia, and (D) SLMR.
Abbreviations: LMR, lymphocyte‐monocyte ratio; SLMR, sarcopenia and the LMR.
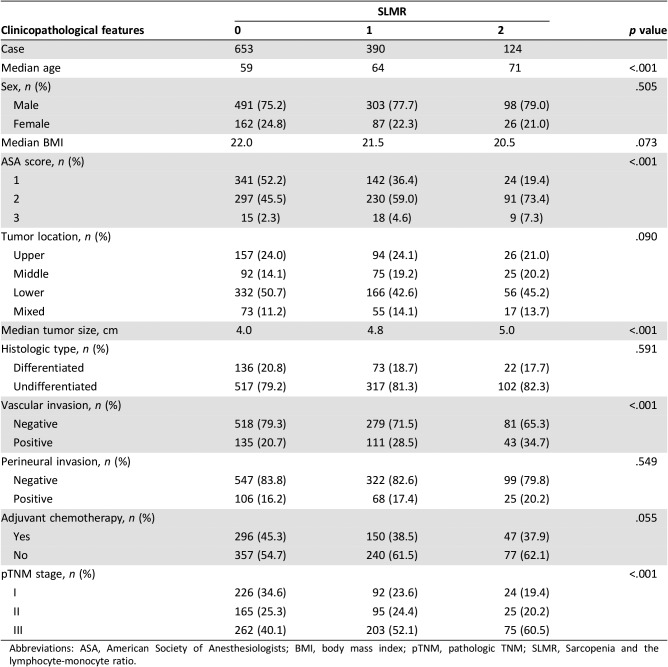
The relationship between clinicopathological factors and the SLMR is given in Table 3. There were 653 patients (56.0%) in the SLMR = 0 group, 390 (33.4%) in the SLMR = 1 group, and 124 (10.6%) in the SLMR = 2 group (Table 3). An increased SLMR was significantly associated with older age, a higher ASA score, a larger tumor size, vascular invasion, and a more advanced TNM stage (all p < .001, Table 3).
Table 3. The relationship between the SLMR and clinicopathological characteristics in patients undergoing potentially curative resection for gastric cancer.
Abbreviations: ASA, American Society of Anesthesiologists; BMI, body mass index; pTNM, pathologic TNM; SLMR, Sarcopenia and the lymphocyte‐monocyte ratio.
Influence of the SLMR on OS
The Kaplan‐Meier curves for the 5‐year OS rate were divided into three groups according to the SLMR (SLMR = 0: 77.2%, SLMR = 1: 60.7%, and SLMR = 2: 45.6%; log‐rank test: p < .001; Fig. 1D). Multivariate analyses revealed that the SLMR was an independent prognostic factor for OS (SLMR = 1: HR, 1.466; SLMR = 2: HR, 2.269; p < .001; Table 4). Patients with sarcopenia and an LMR < 3.4 had a nearly twofold increased risk of death from any cause, compared with patients with neither condition (Table 4). Other independent risk factors included a larger tumor size and a more advanced TNM stage (both p < .001).
Table 4. Multivariate analysis of clinicopathologic variables in relation to overall survival in patients undergoing potentially curative resection for gastric cancer.
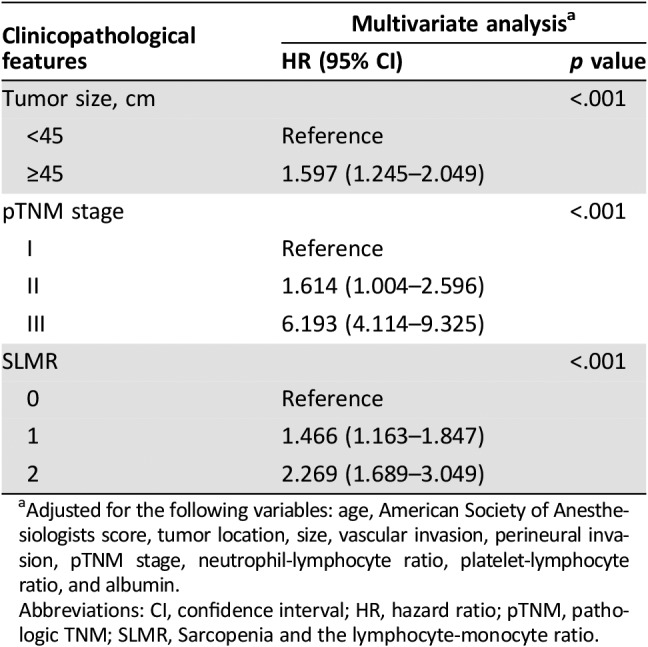
Adjusted for the following variables: age, American Society of Anesthesiologists score, tumor location, size, vascular invasion, perineural invasion, pTNM stage, neutrophil‐lymphocyte ratio, platelet‐lymphocyte ratio, and albumin.
Abbreviations: CI, confidence interval; HR, hazard ratio; pTNM, pathologic TNM; SLMR, Sarcopenia and the lymphocyte‐monocyte ratio.
Furthermore, we explored the prognostic accuracies of the SLMR and each of its components—sarcopenia and LMR—by using areas under the curve (AUCs) for the prediction of 5‐year OS. AUCs for the SLMR, sarcopenia, and the LMR were 0.621 (95% CI, 0.591–0.649), 0.573 (95% CI, 0.544–0.603), and 0.589 (95% CI, 0.560–0.618), respectively. According to the Z‐test method, the AUC for the SLMR was significantly higher than that for sarcopenia and the LMR (both p < .05).
Predictive Nomogram Based on the SLMR
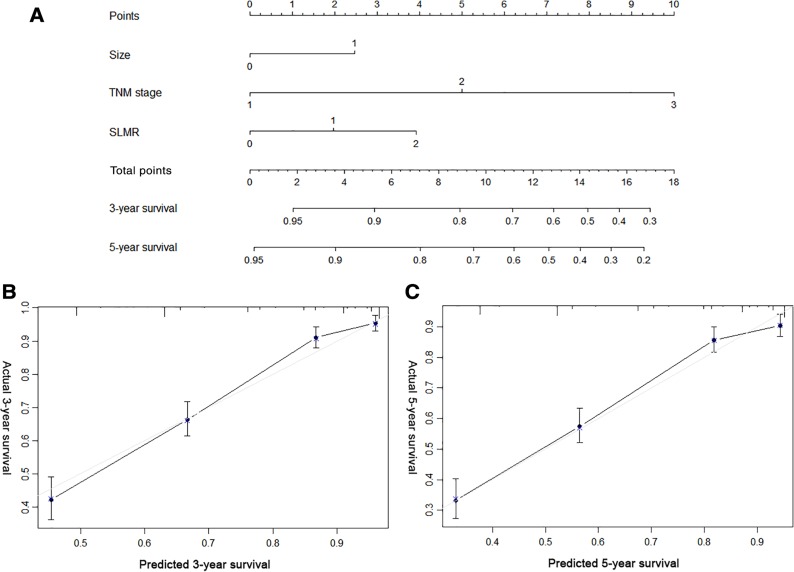
To provide a quantitative method for better outcome prediction, we constructed a nomogram that integrated the proven independent prognostic factors, the SLMR, tumor size, and TNM stage (Fig. 2A). For internal validation, calibration plots of the nomogram predicting 3‐ and 5‐year survival performed well with the ideal model (Fig. 2B, 2C). The C‐index of the nomogram based on the SLMR (0.761; 95% CI, 0.737–0.784) was significantly higher than the prognostic model without a combined SLMR (non‐SLMR nomogram; 0.742; 95% CI, 0.719–0.765; p < .001) and pathologic TNM (pTNM) stage (0.719; 95% CI 0.697–0.740; p < .001).
Figure 2.
Nomogram for predicting the 3‐ and 5‐year overall survival (OS) of patients with gastric cancer (GC) after surgery. (A): Nomogram for predicting the 3‐ and 5‐year OS of patients with GC after surgery. Calibration plot of the nomogram for (B) 3‐year and (C) 5‐year survival.
Abbreviation: SLMR, sarcopenia and the lymphocyte‐monocyte ratio.
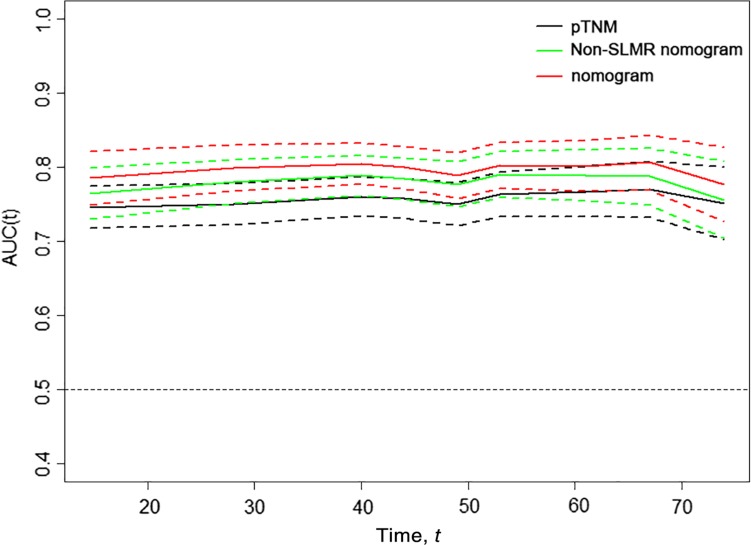
Meanwhile, we generated t‐ROC curves to compare the prognostic accuracy of the three prognostic models (Fig. 3). The t‐ROC curve for the nomogram based on the SLMR was consistently superior to that of the non‐SLMR nomogram and pTNM stage throughout the observation period.
Figure 3.
Time‐dependent receiver‐operating characteristic (ROC) curves for the nomogram, non‐SLMR nomogram, and pTNM for the prediction of overall survival. The horizontal axis represents year after surgery, and the vertical axis represents the estimated area under the ROC curve for survival at the time of interest. Red, green, and black solid lines represent the estimated AUCs of the nomogram, non‐SLMR nomogram, and pTNM, respectively, and broken lines represent the 95% confidence intervals of each AUC.
Abbreviations: AUC, area under the curve; pTNM, pathologic TNM; SLMR, sarcopenia and the lymphocyte‐monocyte ratio.
Discussion
Accumulating studies have shown that sarcopenia and systemic inflammation are associated with the prognosis of multiple tumors; however, most studies have addressed them individually [5], [9], [24]. Whether there is a correlation between sarcopenia and systemic inflammation in GC and their prognostic value has remained unclear. In this study, sarcopenia and systemic inflammatory markers, measured as the LMR, were proven to be independent predictors of OS for patients with GC undergoing curative surgical resection, which was consistent with previous studies [9], [24]. Furthermore, univariate and multivariate analysis revealed that sex was not an independent prognostic factor, but age had a significant effect on prognosis for GC. Until now, whether sex and age can affect the prognosis of GC remained controversial [8], [25], [26]. Wang et al. found that sex and age were not associated with the prognosis of in resectable gastroesophageal junction and gastric adenocarcinoma [8]. However, Han et al. demonstrated that male sex and older age both were independent risk factors for GC [25]. Our result is consistent with the result of Woo et al [26]. Sarcopenia, the loss of skeletal muscle mass and strength, is a key criterion for cancer cachexia [27], which was recognized as a risk factor for functional limitation, physical disability, decreased quality of life, and ultimately death [28]. Prado et al. demonstrated that there is an association between sarcopenia and having a poorer functional status and an increased risk of chemotherapy toxicity in patients with cancer [18]. Therefore, the prognosis of patients with sarcopenia is poor. LMR consists of lymphocytes and monocytes. Elevated LMR values indicate increased lymphocyte count and/or decreased monocyte count in peripheral blood. Recent evidence indicates that lymphocytes can enhance cancer immune‐surveillance to inhibit tumor cell proliferation, invasion, and metastasis [29]. Azimi et al. found that the presence of tumor‐infiltrating lymphocytes was associated with improved outcomes in a variety of cancers, possibly owing to tumor‐infiltrating, lymphocyte‐induced, antitumor activity and inhibition of angiogenesis [30]. Circulating monocytes may contribute to both tumor growth and reduced immunosurveillance, which is supported by previous findings [31]. In addition, tumor‐associated macrophages, which are derived from circulating monocyte populations, have been reported to be a key player in the tumor microenvironment, encouraging metastasis and tumor progression [32]. Thus, the LMR plays an important role in the prognosis of gastric cancer, and an increase in LMR is a protective factor for the prognosis of gastric cancer.
So far, the cutpoint of sarcopenia has not been uniform worldwide [18], [27], [33]. In Western countries, most cutpoints for L3 SMI appear in the upper 30 cm2/m2 in women and 40 cm2/m2 and low 50 cm2/m2 in men, which are higher than that of Eastern countries researched [6], [24], [34]. If the Western definitions are applied, the prevalence of sarcopenia in our study is about 90.7%. Therefore, to better evaluate the prognostic value of sarcopenia in Eastern population, the optimal cutoff values for SMI were calculated by the X‐tile software and were 36.4 cm2/m2 in men and 28.4 in women, which is similar to the definition of sarcopenia in previous studies from Asian researches [6], [24], [34]. X‐tile plot is a novel time‐dependent cutoff value analysis based on survival information, which identifies the cutoff value with minimum p values from log‐rank χ2 statistics for the categorical biomarkers in terms of survival, which has been widely used in previous studies [6], [35]. Therefore, in our study, the other optimal cutoff values for the inflammatory biomarkers were also determined by the software. However, the optimal cutoff values for SMI in our study were based on the large number of Eastern patients. Martin et al. defined the different cutoff values for SMI in men according to the BMI, but the cutoff value in women is the same [33]. In the current study, there were only 41 (3.5%) obese patients (BMI >28; 3.0% for male and 0.5% for female patients), so we did not define the different cutoff values for SMI according to BMI.
In a large cohort of patients with resectable GC, our study found that a low LMR was significantly associated with sarcopenia. Gupta et al. found that proinflammatory cytokines and growth factors, released as part of the systemic inflammatory response to the tumor, have profound catabolic effects on host metabolism, which can lead to muscle breakdown [36]. Kantola et al. found that certain markers of systemic inflammation are correlated with elevated circulating concentrations of various tumor cytokines; these are implicated in the activation of several catabolic pathways [37]. For example, cytokines, such as tumor necrosis factor and interleukin‐6, are produced by the tumor or surrounding cells and promote protein degradation and decreased synthesis [38]. Fearon et al. demonstrated that tumor necrosis factor inhibits skeletal myocyte differentiation and promotes muscle atrophy [39]. Increases in inflammatory cytokines can also lead to insulin resistance and muscle wasting through the activation of the ubiquitin‐proteasome proteolytic pathway, whereas the muscle loss itself further exacerbates insulin resistance, forming a vicious cycle [40]. In addition, Kalinkovich et al. demonstrated that low muscularity could contribute to local inflammation in the muscle, leading to further breakdown and driving systemic inflammation [41]. Our results also suggested that systemic inflammation and sarcopenia are associated, which contributes to the poor prognosis of patients with GC. Inflammation is thought to be one of the principle causes of muscle wasting. It is more possible that both of these measures, muscle wasting by CT and inflammatory markers, are simply imperfect methods for detecting cachexia, and by using both parameters simply captures more of these at‐risk patients. Thus, we developed a novel prognostic score, called the SLMR, based on the combination of preoperative sarcopenia and the LMR, and found that the SLMR was an independent prognostic factor for patients with GC. Furthermore, patients with sarcopenia and a low LMR (SLMR = 2) had nearly a twofold increased risk of mortality, compared with patients with neither condition, and the prognostic accuracy of SLMR was significantly better than that of preoperative sarcopenia and LMR. Therefore, as an integrated indicator, based on sarcopenia and the LMR, the SLMR can better reflect the comprehensive effect of preoperative sarcopenia and systemic inflammation on tumor progression. We recommend that patients with higher SLMR should exercise regularly before operation or be treated with standardized neoadjuvant therapy prior to surgery to possibly avoid surgeries in those with micrometastatic disease.
Traditionally, the AJCC TNM staging system has been the most important prognostic factor and the main basis for treatment in GC [13]. However, prognoses can vary in patients with GC, even when they have the same TNM stage. A nomogram was constructed by incorporating the SLMR into tumor size and TNM staging; it performed well in internal validation. When assessing OS, the nomogram was observed to have a higher predictive accuracy compared with that of non‐SLMR nomograms or TNM staging; thus, the SLMR can improve the prediction of prognoses in patients with GC. In clinical practice, the SLMR can be used as a supplement to the TNM staging system, to better stratify patients, and to provide a more accurate basis for guiding postoperative follow‐up and treatment.
There were several limitations to our study. First, as a retrospective study, it may have been subject to selection bias and may lack some information, such as complete chemotherapy information. Second, there may be inevitable confounding factors in the study, such as socioeconomic status, diet, and alcohol consumption, which could plausibly influence sarcopenia and the LMR. Third, we are unsure of whether all patients were in the same state before blood sampling. Finally, our nomogram were based on the result of an Eastern population‐based study. We have no relevant data to verify whether it is suitable for Western populations, which is the limitation of our study. However, our study confirmed the correlation between sarcopenia and systemic inflammation and that both are significantly associated with the prognosis of GC, which can provide more evidence‐based medical evidence for Western population‐based research.
Conclusion
Despite these limitations, our study is the first to demonstrate that the preoperative systemic inflammation was significantly associated with sarcopenia in GC, and by combining these two predictors, we developed a novel and easily obtained prognostic score, named the SLMR, which can effectively predict the prognosis of GC and complement the prognostic value of the TNM staging system. Thus, a better understanding of how the host systemic inflammatory response influences skeletal muscle changes, such as sarcopenia, may lead to the development of novel therapies to improve cancer outcomes.
See http://www.TheOncologist.com for supplemental material available online.
Acknowledgments
Funding was provided by the following: scientific and technological innovation joint capital projects of Fujian Province, China (No.2016Y9031); minimally invasive medical center of Fujian Province (No. [2017]171). Project was supported by the Science Foundation of the Fujian Province, China (Grant No.2018 J01307), and Startup Fund for scientific research, Fujian Medical University (No.2016QH024). All procedures followed were in accordance with the ethical standards of the responsible committee on human experimentation (institutional and national) and with the Helsinki Declaration of 1964 and later versions. Informed consent or a substitute for it was obtained from all patients for being included in the study.
Contributed equally.
Contributor Information
Chao‐Hui Zheng, Email: wwkzch@163.com.
Chang‐Ming Huang, Email: hcmlr2002@163.com.
Ping Li, Email: pingli811002@163.com.
Author Contributions
Conception/Design: Jian‐Xian Lin, Jun‐Peng Lin, Chao‐Hui Zheng, Chang‐Ming Huang, Ping Li
Provision of study material or patients: Jian‐Xian Lin, Jun‐Peng Lin, Jian‐Wei Xie, Jia‐bin Wang, Jun Lu, Qi‐Yue Chen, Long‐long Cao, Mi Lin, Ruhong Tu, Chao‐Hui Zheng, Chang‐Ming Huang, Ping Li
Collection and/or assembly of data: Jian‐Xian Lin, Jun‐Peng Lin, Jian‐Wei Xie, Jia‐bin Wang, Jun Lu, Qi‐Yue Chen, Long‐long Cao, Mi Lin, Ruhong Tu
Data analysis and interpretation: Jian‐Xian Lin, Jun‐Peng Lin, Jian‐Wei Xie, Jia‐bin Wang, Jun Lu, Qi‐Yue Chen, Long‐long Cao, Mi Lin, Ruhong Tu, Chao‐Hui Zheng, Chang‐Ming Huang, Ping Li
Manuscript writing: Jian‐Xian Lin, Jun‐Peng Lin, Chao‐Hui Zheng, Chang‐Ming Huang, Ping Li
Final approval of manuscript: Jian‐Xian Lin, Jun‐Peng Lin, Jian‐Wei Xie, Jia‐bin Wang, Jun Lu, Qi‐Yue Chen, Long‐long Cao, Mi Lin, Ruhong Tu, Chao‐Hui Zheng, Chang‐Ming Huang, Ping Li
Disclosures
The authors indicated no financial relationships.
References
- 1.Ferlay J, Soerjomataram I, Dikshit R et al. Cancer incidence and mortality worldwide: Sources, methods and major patterns in GLOBOCAN 2012. Int J Cancer 2015;136:E359–E386. [DOI] [PubMed] [Google Scholar]
- 2.Sasako M, Sano T, Yamamoto S et al. D2 lymphadenectomy alone or with para‐aortic nodal dissection for gastric cancer. N Engl J Med 2008;359:453462. [DOI] [PubMed] [Google Scholar]
- 3.Aurello P, Tierno SM, Berardi G et al. Value of preoperative inflammation‐based prognostic scores in predicting overall survival and disease‐free survival in patients with gastric cancer. Ann Surg Oncol 2014;21:1998–2004. [DOI] [PubMed] [Google Scholar]
- 4.Diakos CI, Charles KA, McMillan DC et al. Cancer‐related inflammation and treatment effectiveness. Lancet Oncol 2014;15:e493–e503. [DOI] [PubMed] [Google Scholar]
- 5.Shachar SS, Williams GR, Muss HB et al. Prognostic value of sarcopenia in adults with solid tumours: A meta‐analysis and systematic review. Eur J Cancer 2016;57:58–67. [DOI] [PubMed] [Google Scholar]
- 6.Zheng ZF, Lu J, Zheng CH et al. A novel prognostic scoring system based on preoperative sarcopenia predicts the long‐term outcome for patients after R0 resection for gastric cancer: Experiences of a high‐volume center. Ann Surg Oncol 2017;24:1795–1803. [DOI] [PubMed] [Google Scholar]
- 7.Coussens LM, Werb Z. Inflammation and cancer. Nature 2002;420:860–867. [DOI] [PMC free article] [PubMed] [Google Scholar]
- 8.Wang SC, Chou JF, Strong VE et al. Pretreatment neutrophil to lymphocyte ratio independently predicts disease‐specific survival in resectable gastroesophageal junction and gastric adenocarcinoma. Ann Surg 2016;263:292–297. [DOI] [PMC free article] [PubMed] [Google Scholar]
- 9.Hsu JT, Wang CC, Le PH et al. Lymphocyte‐to‐monocyte ratios predict gastric cancer surgical outcomes. J Surg Res 2016;202:284–290. [DOI] [PubMed] [Google Scholar]
- 10.Lian L, Xia YY, Zhou C et al. Application of platelet/lymphocyte and neutrophil/lymphocyte ratios in early diagnosis and prognostic prediction in patients with resectable gastric cancer. Cancer Biomark 2015;15:899–907. [DOI] [PubMed] [Google Scholar]
- 11.Richards CH, Roxburgh CS, MacMillan MT et al. The relationships between body composition and the systemic inflammatory response in patients with primary operable colorectal cancer. Plos One 2012;7:e41883. [DOI] [PMC free article] [PubMed] [Google Scholar]
- 12.Japanese Gastric Cancer Association . Japanese gastric cancer treatment guidelines 2010 (ver. 3). Gastric Cancer 2011;14:113–123. [DOI] [PubMed] [Google Scholar]
- 13.Amin MB, Edge S, Green F. et al., eds. AJCC Cancer Staging Manual. 8th ed. New York: Springer; 2016. [Google Scholar]
- 14.Bang YJ, Kim YW, Yang HK et al. Adjuvant capecitabine and oxaliplatin for gastric cancer after D2 gastrectomy (CLASSIC): A phase 3 open‐label, randomised controlled trial. Lancet 2012;379:315–321. [DOI] [PubMed] [Google Scholar]
- 15.Sasako M, Sakuramoto S, Katai H et al. Five‐year outcomes of a randomized phase III trial comparing adjuvant chemotherapy with S‐1 versus surgery alone in stage II or III gastric cancer. J Clin Oncol. 2011;29:4387–4393. [DOI] [PubMed] [Google Scholar]
- 16.Sankar A, Johnson SR, Beattie WS et al. Reliability of the American Society of Anesthesiologists physical status scale in clinical practice. Br J Anaesth 2014;113:424–432. [DOI] [PMC free article] [PubMed] [Google Scholar]
- 17.Dello SA, Lodewick TM, van Dam RM et al. Sarcopenia negatively affects preoperative total functional liver volume in patients undergoing liver resection. HPB (Oxford) 2013;15:165–169. [DOI] [PMC free article] [PubMed] [Google Scholar]
- 18.Prado CM, Lieffers JR, McCargar LJ et al. Prevalence and clinical implications of sarcopenic obesity in patients with solid tumours of the respiratory and gastrointestinal tracts: A population‐based study. Lancet Oncol 2008;9:629–635. [DOI] [PubMed] [Google Scholar]
- 19.Mourtzakis M, Prado CM, Lieffers JR et al. A practical and precise approach to quantification of body composition in cancer patients using computed tomography images acquired during routine care. Appl Physiol Nutr Metab 2008;33:997–1006. [DOI] [PubMed] [Google Scholar]
- 20.Camp RL, Dolled‐Filhart M, Rimm DL. X‐tile: A new bio‐informatics tool for biomarker assessment and outcome‐based cut‐point optimization. Clin Cancer Res 2004;10:7252–7259. [DOI] [PubMed] [Google Scholar]
- 21.Lin JP, Lin JX, Cao LL et al. Preoperative lymphocyte‐to‐monocyte ratio as a strong predictor of survival and recurrence for gastric cancer after radical‐intent surgery. Oncotarget 2017;8:79234–79247. [DOI] [PMC free article] [PubMed] [Google Scholar]
- 22.Harrell FJ, Lee KL, Mark DB. Multivariable prognostic models: Issues in developing models, evaluating assumptions and adequacy, and measuring and reducing errors. Stat Med 1996;15:361–387. [DOI] [PubMed] [Google Scholar]
- 23.Suzuki Y, Okabayashi K, Hasegawa H et al. Comparison of preoperative inflammation‐based prognostic scores in patients with colorectal cancer. Ann Surg 2018;267:527–531. [DOI] [PubMed] [Google Scholar]
- 24.Wang SL, Zhuang CL, Huang DD et al. Sarcopenia adversely impacts postoperative clinical outcomes following gastrectomy in patients with gastric cancer: A Prospective study. Ann Surg Oncol 2016;23:556–564. [DOI] [PubMed] [Google Scholar]
- 25.Han DS, Suh YS, Kong SH et al. Nomogram predicting long‐term survival after d2 gastrectomy for gastric cancer. J Clin Oncol 2012;30:3834–3840. [DOI] [PubMed] [Google Scholar]
- 26.Woo Y, Son T, Song K et al. A novel prediction model of prognosis after gastrectomy for gastric carcinoma: Development and validation using Asian databases. Ann Surg 2016;264:114–120. [DOI] [PubMed] [Google Scholar]
- 27.Fearon K, Strasser F, Anker SD et al. Definition and classification of cancer cachexia: An international consensus. Lancet Oncol 2011;12:489–495. [DOI] [PubMed] [Google Scholar]
- 28.Cruz‐Jentoft AJ, Baeyens JP, Bauer JM et al. Sarcopenia: European consensus on definition and diagnosis: Report of the European Working Group on Sarcopenia in Older People. Age Ageing 2010;39:412–423. [DOI] [PMC free article] [PubMed] [Google Scholar]
- 29.Dunn GP, Old LJ, Schreiber RD. The immunobiology of cancer immunosurveillance and immunoediting. Immunity 2004;21:137–148. [DOI] [PubMed] [Google Scholar]
- 30.Azimi F, Scolyer RA, Rumcheva P et al. Tumor‐infiltrating lymphocyte grade is an independent predictor of sentinel lymph node status and survival in patients with cutaneous melanoma. J Clin Oncol 2012;30:2678–2683. [DOI] [PubMed] [Google Scholar]
- 31.Augier S, Ciucci T, Luci C et al. Inflammatory blood monocytes contribute to tumor development and represent a privileged target to improve host immunosurveillance. J Immunol 2010;185:7165–7173. [DOI] [PubMed] [Google Scholar]
- 32.Galdiero MR, Bonavita E, Barajon I et al. Tumor associated macrophages and neutrophils in cancer. Immunobiology 2013;218:1402–1410. [DOI] [PubMed] [Google Scholar]
- 33.Martin L, Birdsell L, Macdonald N et al. Cancer cachexia in the age of obesity: Skeletal muscle depletion is a powerful prognostic factor, independent of body mass index. J Clin Oncol 2013;31:1539–1547. [DOI] [PubMed] [Google Scholar]
- 34.Iritani S, Imai K, Takai K et al. Skeletal muscle depletion is an independent prognostic factor for hepatocellular carcinoma. J Gastroenterol 2015;50:323–332. [DOI] [PubMed] [Google Scholar]
- 35.Qureshi YA, Sarker SJ, Walker RC et al. Proximal resection margin in Ivor‐Lewis oesophagectomy for cancer. Ann Surg Oncol 2017;24:569–577. [DOI] [PubMed] [Google Scholar]
- 36.Gupta D, Lis CG. Pretreatment serum albumin as a predictor of cancer survival: A systematic review of the epidemiological literature. Nutr J 2010;9:69. [DOI] [PMC free article] [PubMed] [Google Scholar]
- 37.Kantola T, Klintrup K, Väyrynen JP et al. Stage‐dependent alterations of the serum cytokine pattern in colorectal carcinoma. Br J Cancer 2012;107:1729–1736. [DOI] [PMC free article] [PubMed] [Google Scholar]
- 38.Baracos VE. Regulation of skeletal‐muscle‐protein turnover in cancer‐associated cachexia. Nutrition 2000;16:1015–1018. [DOI] [PubMed] [Google Scholar]
- 39.Fearon KC, Glass DJ, Guttridge DC. Cancer cachexia: Mediators, signaling, and metabolic pathways. Cell Metab 2012;16:153–166. [DOI] [PubMed] [Google Scholar]
- 40.Wang X, Hu Z, Hu J et al. Insulin resistance accelerates muscle protein degradation: Activation of the ubiquitin‐proteasome pathway by defects in muscle cell signaling. Endocrinology 2006;147:4160–4168. [DOI] [PubMed] [Google Scholar]
- 41.Kalinkovich A, Livshits G. Sarcopenic obesity or obese sarcopenia: A cross talk between age‐associated adipose tissue and skeletal muscle inflammation as a main mechanism of the pathogenesis. Ageing Res Rev 2017;35:200–221. [DOI] [PubMed] [Google Scholar]


