Strategies to identify T‐lymphoblastic lymphoma (T‐LBL) patients with a high risk for relapse are needed. This article reports on the prognostic roles of absolute lymphocyte to absolute monocyte count ratio, neutrophil‐lymphocyte ratio, and platelet‐lymphocytie ratio as predictors of T‐LBL.
Keywords: Complete blood count, Tumor microenvironment, Host immunity, T‐lymphoblastic lymphoma, Prognosis
Abstract
Background.
T‐lymphoblastic lymphoma (T‐LBL) is a highly aggressive neoplasm of lymphoblasts of T‐cell origin. Although promising improvements have been recently achieved, one third of patients experience relapse or refractory T‐LBL. Therefore, optimal strategies for identifying high‐risk patients are urgently needed.
Materials and Methods.
In the present study, 75 newly diagnosed adult patients (aged ≥15 years) with T‐LBL were identified and the predictive value of complete blood count (CBC) abnormalities, including lymphocyte‐monocyte ratio (LMR), neutrophil‐lymphocyte ratio (NLR), and platelet‐lymphocyte ratio (PLR) on clinical outcomes, was analyzed.
Results.
Using the receiver operating characteristic curve to determine the best cutoff values based on survival, it was found that patients with T‐LBL with LMR ≤2.8, NLR ≥3.3, and PLR ≥200 had both inferior progression‐free survival (PFS) and inferior overall survival (OS), in which the differences were much more remarkable in the international prognostic index score 0–2 subgroup. In the multivariable analysis, NLR ≥3.3 together with age >40 years and central nervous system (CNS) involvement were identified to be independently associated with shortened PFS, whereas PLR ≥200 and CNS involvement were identified to be independent risk factors for OS. LMR, NLR, and PLR were integrated to generate a “CBC score” model, which well separated adult patients with T‐LBL into three risk groups, and the 3‐year OS was 84%, 53%, and 30% for low‐, intermediate‐, and high‐risk patients, respectively.
Conclusion.
Overall, a “CBC score” model was initially promoted for stratification in adult patients with T‐LBL using simple, widely available, and easy to interpret parameters in the largest adult T‐LBL cohort to date.
Implications for Practice.
Optimal strategies for identifying high‐risk patients with T‐lymphoblastic lymphoma (T‐LBL) are urgently needed. In the largest adult T‐LBL cohort to date, simple, inexpensive, widely available parameters were applied and revealed that patients with lymphocyte‐monocyte ratio (LMR) ≤2.8, neutrophil‐lymphocyte ratio (NLR) ≥3.3, and platelet‐lymphocyte ratio (PLR) ≥200 had both inferior progression‐free survival and inferior overall survival (OS), in which the differences were much more remarkable in the international prognostic index score 0–2 subgroup. LMR, NLR, and PLR were integrated to generate a “complete blood count score” model, in which the 3‐year OS was 84%, 53%, and 30% for low‐, intermediate‐, and high‐risk patients, respectively.
Introduction
Lymphoblastic lymphoma (LBL) is a rare and aggressive precursor lymphoblast origin hematological disorder that represents 1%–2% of all non‐Hodgkin's lymphomas. T‐cell LBL (T‐LBL), which accounts for 90% of all LBLs, generally occurs in adolescents and young adults and often manifests with a mediastinal mass. Although great improvement has been achieved by treatment according to protocols for acute lymphoblastic leukemia (ALL), approximately one third of patients experience disease relapse, and the 5‐year overall survival (OS) rate for adults is approximately 50%–55% [1], [2]. These outcomes highlight the need for alternate therapeutic approaches, which require a prognostication model to identify patients at a high risk of relapse.
There is a body of evidence showing that the tumor microenvironment, host immunity, and systemic inflammatory responses are critical for determining the clinical course and outcome of patients with tumors [3], [4]. Using lymphocytes and monocytes as surrogate markers of tumor microenvironment and inflammatory responses, more and more studies have found that elevated absolute monocyte count (AMC), decreased absolute lymphocyte count (ALC), and the absolute lymphocyte to absolute monocyte count ratio (LMR) are predictors of various solid tumors, such as breast carcinoma, ovarian cancer, clonal cancer, and lung cancer, and similar findings have also been demonstrated in diffuse large B‐cell lymphoma (DLBCL) and classical Hodgkin's lymphoma (cHL) [5], [6], [7], [8], [9]. In addition, parameters such as neutrophil‐lymphocyte ratio (NLR) and platelet‐lymphocyte ratio (PLR) have also exhibited prognostic activity in recent studies, although there were conflicting results [10], [11], [12]. In the present study, the role of LMR, NLR, and PLR in the setting of adult T‐LBL was first discussed.
Materials and Methods
Patients and Characteristics
From January 2013 to December 2017, 75 eligible patients were identified from the First Affiliated Hospital of Zhengzhou University, China. The inclusion criteria were as follows: (a) patients with pathologically confirmed T‐LBL, with bone marrow blast cells <20%; (b) patients who were ≥15 years of age; (c) patients who were newly diagnosed; (d) patients who received at least two cycles of treatment in our center. The pathological samples were reviewed by two expert pathologists (G.W. and W.L.) according to the 2016 World Health Organization Classification of Tumors of Hematopoietic and Lymphoid Tissues. The present study was approved by the Clinical and Research Ethics Committee of the First Affiliated Hospital of Zhengzhou University. All procedures in the present study that involved human participants were performed in accordance with the Declaration of Helsinki.
Clinical features were obtained from the medical records of patients. Absolute neutrophil count (ANC), ALC, and AMC were obtained from the complete blood count (CBC) count at diagnosis. LMR was calculated by dividing the ALC by the AMC, NLR was calculated as the ratio of ANC to ALC, and PLR was defined as the ratio between platelets and ALC.
Cutoff Value for LMR/NLR/PLR
The receiver operating characteristic curve (ROC) was applied to determine the optimal cutoff value for LMR, NLR, and PLR. Values with maximum joint sensitivity and specificity were selected for the subsequent analysis.
Statistics Analysis
Progression‐free survival (PFS) was defined as the interval between the first day of diagnosis and the date of disease progression, death from any cause, or end of follow‐up. OS was calculated as the time from diagnosis to the last follow‐up or death from any cause. PFS and OS were analyzed using Kaplan‐Meier curves and compared using log‐rank test. Multivariate prognostic analyses were performed using the Cox proportional hazards regression model. Categorical variables were compared using chi‐square test. Continuous variables, which were presented as median and range or SD, were compared using the Mann‐Whitney or Kruskal‐Wallis test. All statistical analyses were performed using SPSS version 25.0 statistical software (SPSS Inc., Chicago, IL). The results were considered to be statistically significant when the p value was <.05, and 95% confidence interval (CI) was given, as indicated.
Results
Patient Characteristics
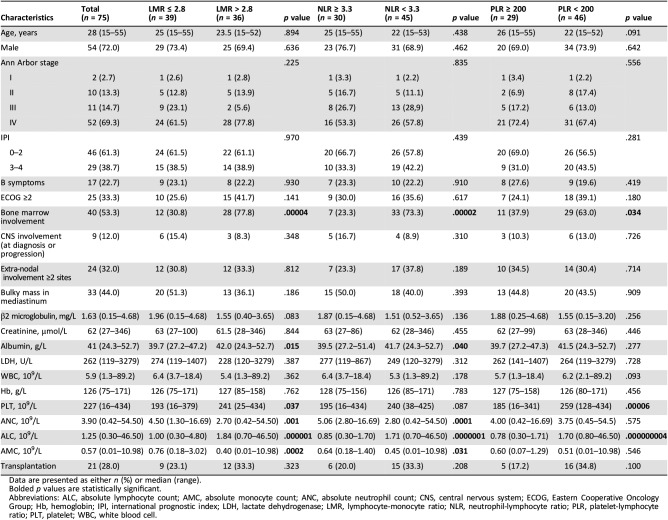
From January 2013 to December 2017, 75 newly diagnosed patients with T‐LBL were included in the present study. The median age was 28 years, and the age range was within 15–55 years. Furthermore, 72% of patients were male, and 84% of patients were in Ann Arbor stage III and IV. In addition, 40 patients had bone marrow involvement. The detailed clinical characteristics for all patients are presented in Table 1.
Table 1. Patients’ characteristics and clinical features.
Data are presented as either n (%) or median (range).
Bolded p values are statistically significant.
Abbreviations: ALC, absolute lymphocyte count; AMC, absolute monocyte count; ANC, absolute neutrophil count; CNS, central nervous system; ECOG, Eastern Cooperative Oncology Group; Hb, hemoglobin; IPI, international prognostic index; LDH, lactate dehydrogenase; LMR, lymphocyte‐monocyte ratio; NLR, neutrophil‐lymphocyte ratio; PLR, platelet‐lymphocyte ratio; PLT, platelet; WBC, white blood cell.
All patients received at least two cycles of chemotherapy. Among these patients, 37 (49.3%) patients were given Hyper‐CVAD/MA regimen, and 45.3% of these patients were administrated with the modified BFM90 regimen, as shown in the study by Dong et al. [13]. The remaining four patients were treated with CHOP‐based (cyclophosphamide, epirubicin, vincristine and prednisone) regimen. Furthermore, 21 patients proceeded to hemopoietic stem cell transplantation, in which 6 of them accepted autologous stem cell transplantation.
Comparison of CBC Abnormalities Between Patients with T‐LBL and Healthy Donors
A total of 75 age‐ and gender‐matched healthy donors were included to determine the difference of CBC parameters with patients with T‐LBL. As shown in supplemental online Figure 1, ALC and AMC were much higher in patients with T‐LBL than in healthy donors. As a result, LMR, NLR, and PLR were significantly elevated in patients with T‐LBL. However, no correlation was found between clinical stage and these CBC abnormalities.
Identification of Optimal Cutoff Values
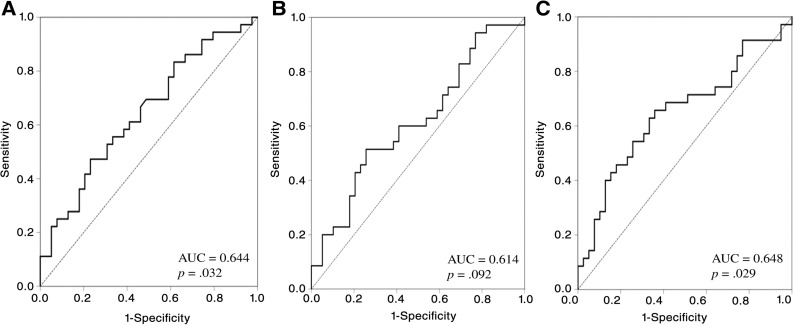
The ROC curve was generated to select the appropriate cutoff values for LMR, NLR, and PLR based on the survival analysis (Fig. 1). For LMR, the area under curve (AUC) was 0.644 (95% CI: 0.520–0.769, p = .032), and a value of 2.8 corresponded to the maximum joint sensitivity and specificity on the ROC curve (62% sensitivity and 42% specificity). The AUC was calculated to be 0.614 (95% CI: 0.485–0.743, p = .092) for NLR, with a generated maximum joint sensitivity and specificity at the value of 3.3. For PLR, the AUC was recorded to be 0.648 (95% CI: 0.519–0.776, p = .029). Then, 200 was selected as the optimal cutoff value, according to the ROC curve (74% sensitivity and 54% specificity).
Figure 1.
Receiver operating characteristic curve based on survival. (A): ROC for LMR; (B): ROC for NLR; (C): ROC for PLR.
Abbreviation: AUC, area under curve.
Association of LMR/NLR/PLR with Clinical Parameters
The baseline clinical characteristics of patients with LMR ≤2.8 at disease onset were compared with patients with LMR >2.8 (Table 1). It was demonstrated that patients with LMR ≤2.8 were inclined to have less bone marrow involvement, lower albumin, lower platelet and ALC, elevated neutrophil and monocyte, and slightly increased β2‐microglobulin. A similar trend was found in patients with elevated NLR and PLR, it was excepted that there were no statistically significant differences in terms of ANC, AMC, and albumin for PLR ≥200, and the platelet difference did not reach statistical significance between patients with NLR ≥3.3 and NLR <3.3.
Prognostic Role of LMR, NLR, and PLR
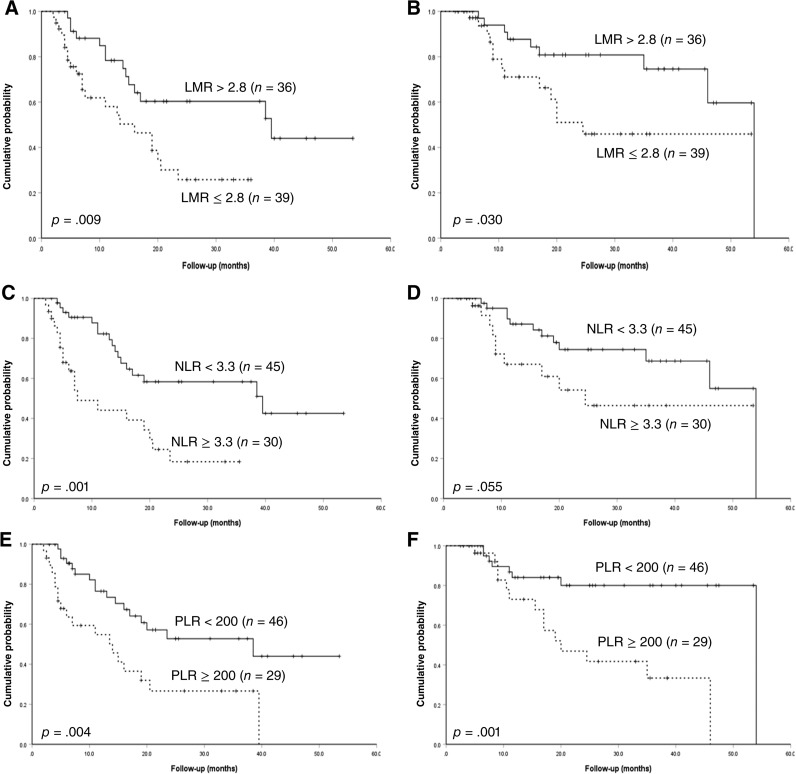
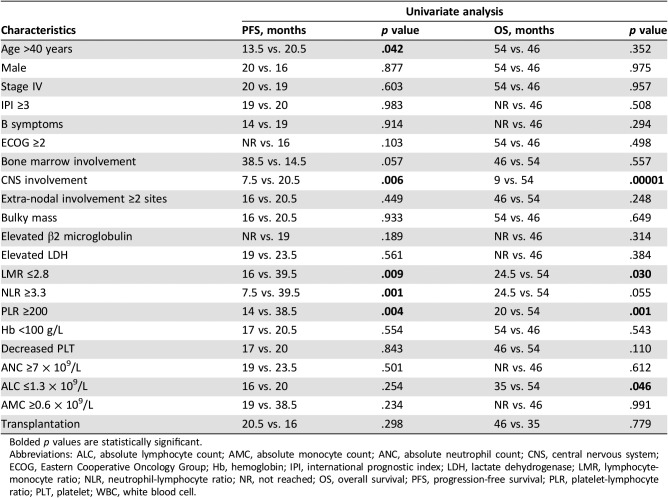
With a median follow‐up time of 20 months (2.5–54 months), the estimated 4‐year PFS and OS was 31.1% and 50.4%, respectively, in the whole cohort. With a cutoff of 2.8, the median PFS was significantly shortened for patients with low LMR compared with patients with high LMR (16.0 and 39.5 months, p = .009; Fig. 2A). The median OS was 24.5 and 54.0 months for patients with LMR ≤2.8 and LMR >2.8, respectively (p = .03; Fig. 2B). NLR was then evaluated for its prognostic role in survival. It was revealed that patients with NLR ≥3.3 correlated with inferior PFS and OS, when compared with patients with NLR <3.3 (PFS: 7.5 and 39.5 months, p = .001; OS: 24.5 and 54 months, p = .055; Fig. 2C, 2D), although the difference in OS did not reach statistical significance. The median PFS of patients with PLR ≥200 was 14 months, which was much lower than that of patients without PLR ≥200 (p = .004; Fig. 2E), and the corresponding OS for both groups was 20 and 54 months, respectively (p = .001; Fig. 2F). Meanwhile, age > 40 years and central nervous system (CNS) involvement, regardless of whether this occurred at the time of onset or progression, were also found to be associated with shortened PFS in the univariable test (Table 2). In terms of OS, the univariable analysis revealed that ALC ≤1.3 × 10⁹/L and CNS involvement were high‐risk factors (Table 2).
Figure 2.
Progression‐free survival and overall survival. (A): PFS for different levels of LMR; (B): OS for different levels of LMR; (C): PFS for different levels of NLR; (D): OS for different levels of NLR; (E): PFS for different levels of PLR; (F): OS for different levels of PLR.
Abbreviations: LMR, lymphocyte‐monocyte ratio; NLR, neutrophil‐lymphocyte ratio; PLR, platelet‐lymphocyte ratio.
Table 2. Univariable analysis on PFS and OS.
Bolded p values are statistically significant.
Abbreviations: ALC, absolute lymphocyte count; AMC, absolute monocyte count; ANC, absolute neutrophil count; CNS, central nervous system; ECOG, Eastern Cooperative Oncology Group; Hb, hemoglobin; IPI, international prognostic index; LDH, lactate dehydrogenase; LMR, lymphocyte‐monocyte ratio; NLR, neutrophil‐lymphocyte ratio; NR, not reached; OS, overall survival; PFS, progression‐free survival; PLR, platelet‐lymphocyte ratio; PLT, platelet; WBC, white blood cell.
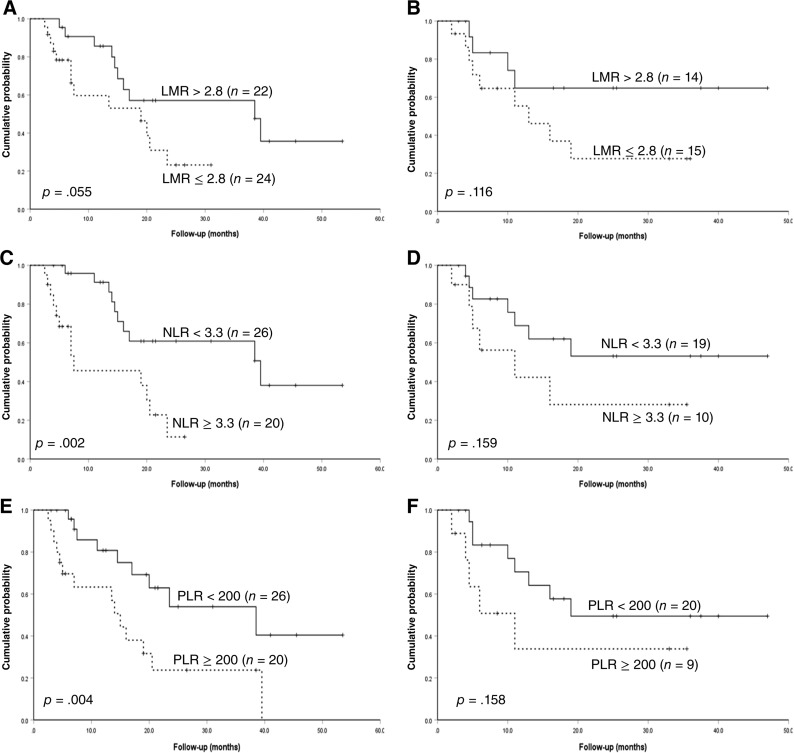
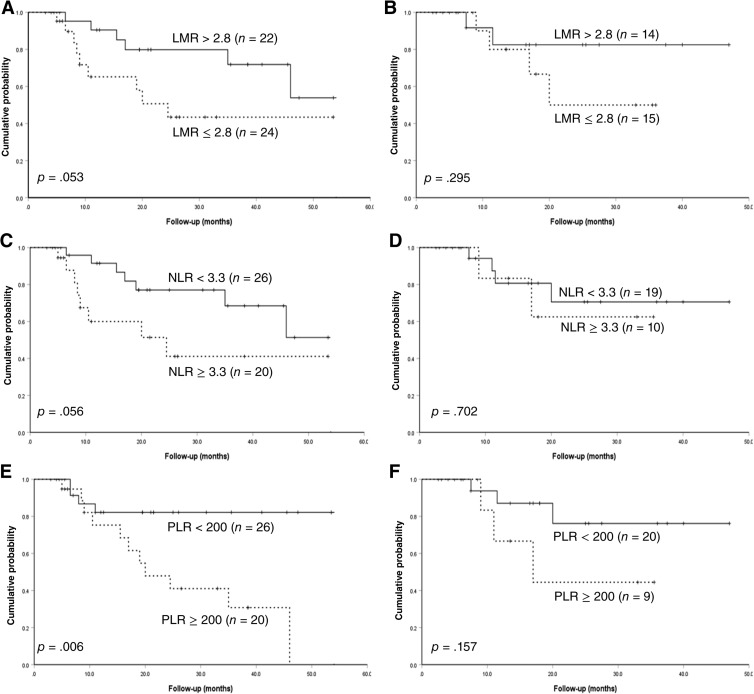
Subsequently, patients were divided into international prognostic index (IPI) score 0–2 and IPI score 3–4 to further evaluate the prognostic value of these CBC abnormalities. As shown in Figures 3 and 4, regardless of whether it was for PFS or OS, the predictive capacity of LMR, NLR, and PLR was much higher in patients with IPI score 0–2, further separating patients into two entities.
Figure 3.
Progression‐free survival subdivided by international prognostic index score. (A): PFS divided by different levels of LMR for patients with IPI score 0‐2; (B): PFS divided by different levels of LMR for patients with IPI score 3‐4; (C): PFS divided by different levels of NLR for patients with IPI score 0‐2; (D): PFS divided by different levels of NLR for patients with IPI score 3‐4; (E): PFS divided by different levels of PLR for patients with IPI score 0‐2; (F): PFS divided by different levels of PLR for patients with IPI score 3‐4.
Abbreviations: IPI, international prognositc index; LMR, lymphocyte‐monocyte ratio; NLR, neutrophil‐lymphocyte ratio; PLR, platelet‐lymphocyte ratio.
Figure 4.
Overall survival subdivided by international prognostic index score. (A): OS divided by different levels of LMR for patients with IPI score 0‐2; (B): OS divided by different levels of LMR for patients with IPI score 3‐4; (C): OS divided by different levels of NLR for patients with IPI score 0‐2; (D): OS divided by different levels of NLR for patients with IPI score 3‐4; (E): OS divided by different levels of PLR for patients with IPI score 0‐2; (F): OS divided by different levels of PLR for patients with IPI score 3‐4.
Abbreviations: IPI, international prognositc index; LMR, lymphocyte‐monocyte ratio; NLR, neutrophil‐lymphocyte ratio; PLR, platelet‐lymphocyte ratio.
Next, a multivariable analysis was performed, and it was found that NLR ≥3.3 (hazard ratio [HR] = 3.112, p = .002), age > 40 years (HR = 3.566, p = .005), and CNS involvement (HR = 2.722, p = .039) were independent risk factors for PFS. PLR ≥200 (HR = 3.482, p = .008) and CNS involvement (HR = 4.715, p = .002) had worse OS independent of Ann Arbor stage, IPI score, and treatment regimen (Table 3).
Table 3. Multivariable analysis on PFS and OS.
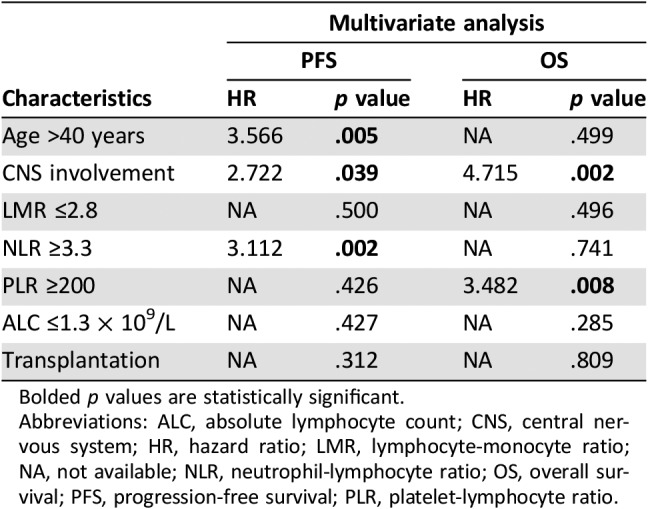
Bolded p values are statistically significant.
Abbreviations: ALC, absolute lymphocyte count; CNS, central nervous system; HR, hazard ratio; LMR, lymphocyte‐monocyte ratio; NA, not available; NLR, neutrophil‐lymphocyte ratio; OS, overall survival; PFS, progression‐free survival; PLR, platelet‐lymphocyte ratio.
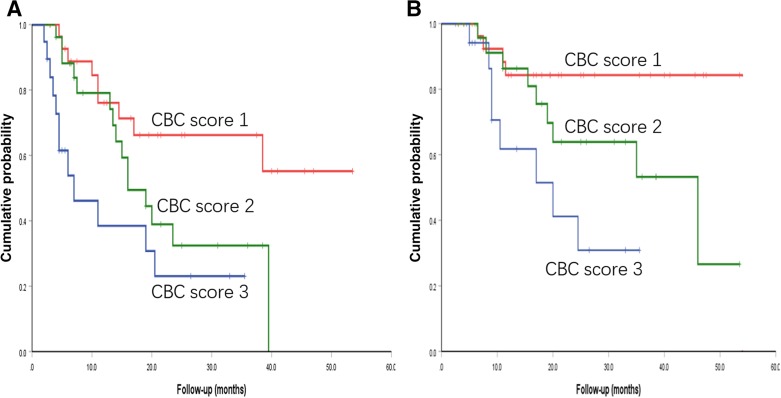
Given the predictive role of LMR, NLR, and PLR on clinical outcomes, a model that incorporated these three parameters was generated, named “CBC score.” A score of 1 represents no abnormality, a score of 3 represents all three aberrations, and a score of 2 represents 1–2 parameter abnormalities. As depicted in Figure 5, this well separated adult patients with T‐LBL into three risk groups. The median PFS for the low‐risk, intermediate‐risk, and high‐risk groups was not reached, 16 months, and 7 months, respectively (p = .004). Furthermore, the corresponding OS for these three groups was not reached, 46 months, and 20 months, respectively (p = .007).
Figure 5.
Prognostic CBC score model in adult T‐lymphoblastic lymphoma. (A): Results for PFS; (B): resutls for OS.
Abbreviation: CBC, complete blood cell.
Discussion
Recently, cumulating data have revealed that CBC parameters, such as AMC, ALC, LMR, and NLR, have shown predictive value in various malignances, including colorectal cancer, advanced gastric cancer, and ovarian cancer as well as cHL and DLBCL [5], [6], [7], [14], [15], [16]. However, this has never been discussed in the context of T‐LBL, which is a more aggressive T‐cell lymphoma with low incidence. Hence, in the present study, the prognostic role of LMR, NLR, and PLR in 75 patients with newly diagnosed adult T‐LBL was first elucidated.
Although the disease was the same in different stages for LBL and ALL, these were still not identical [17]. One of the variations between LBL and ALL concerns the prognostic models. In contrast to ALL, the precise predictive factors have remained inconsistent throughout studies [18]. First, it is known that a leukocyte count of >100 × 109/L is a risk factor for T‐ALL [19]. However, this doesn't necessarily fit for T‐LBL, which commonly involves the lymph node and spleen. As for the present study, merely 13 patients (17%) had elevated white blood cell count, and none of these cases was higher than 100 × 109/L. Second, IPI has been reported to have the inability to distinguish shortened survival in childhood T‐LBL [20]; although this appeared to be predictive in adult T‐LBL in one study [21], our current study also revealed that IPI lacked prognostic value in adult T‐LBL. Another report from the MD Anderson Cancer Center demonstrated that only patients with CNS involvement at initial diagnosis were associated with inferior outcome [22]. Coleman et al. promoted a risk model that integrated parameters, including the presence of bone marrow or CNS involvement, Ann Arbor stage IV, and elevated LDH, and reported that these could identify a subgroup of high‐risk patients with a 19% rate of 5‐year relapse‐free survival, when compared with low‐risk patients with a 94% rate of 5‐year relapse‐free survival [23]. However, this was not validated by the GMALL study group [1]. Recently, several studies have demonstrated that response to treatment assessed by minimal residual disease has potential for predicting prognosis [24], [25]. Moreover, cytogenetic abnormality comprising NOTCH1, FBXW7, RAS, and PTEN mutation has been identified to be an independent predictive value for event‐free survival, disease‐free survival, and OS [26]. Although promising, many of these methods are costly and difficult to obtain, are not easily interpreted, and require further validation. Therefore, identifying prognostic factors that are inexpensive, widely available, and easily interpreted by clinicians for patients with T‐LBL is urgently needed.
Gene‐expression profiling revealed that the biological and clinical behavior of tumors could be determined by the characteristics of the tumor cell, and is greatly influenced by interactions with non‐neoplastic cells in the tumor microenvironment [27]. ALC, an important biomarker of tumor‐infiltrating lymphocytes, reflects host immunity status and is also included in the IPS score for the prognostic model in patients with Hodgkin's lymphoma [28]. AMC serves as a surrogate biomarker of tumor‐associated macrophages within the tumor microenvironment and a subgroup of myeloid‐lineage cells. It can produce a variety of cytokines, such as transforming growth factor‐α, tumor necrosis factor‐α, interleukin‐1 (IL‐1), and IL‐6, in order to promote tumorigenesis, angiogenesis, and distant metastasis [29], [30]. ANC, as a measure of systemic inflammatory response to malignancy, is linked to immunosuppression in certain tumors [31]. Furthermore, platelets can be stimulated by systemic inflammation through several pro‐inflammatory factors, such as IL‐1, IL‐3, and IL‐6, and platelet aggregation and degranulation leads to the release of platelet‐derived proangiogenic mediators, which have been suggested to promote tumor growth [32], [33].
Given the notion that both host immunity and tumor microenvironment contribute to tumorigenesis, it would be theoretical to combine the abovementioned parameters to better reflect tumor prognosis. In this respect, the ALC to AMC ratio (LMR), ANC to ALC ratio (NLR), and platelet to ALC ratio (PLR) were investigated in different context of diseases, especially LMR, which has been extensively discussed and found to be predictive in breast cancer, colorectal carcinoma, lung cancer, nasopharyngeal carcinoma, Hodgkin's lymphoma, DLBCL, etc. However, this has never been discussed in T‐LBL, which urgently requires a simple and practical prognostic model. From this perspective, the present study initially presented that patients with T‐LBL with lower LMR and elevated NLR or PLR were correlated with both inferior PFS and inferior OS in the univariable algorithm, and subgroup analysis revealed that their predictive value was more remarkable in IPI score 0–2 patients, although IPI itself did not associate with clinical outcomes in the present study. In multivariable tests, NLR ≥3.3 demonstrated that it could independently predict shortened PFS, whereas PLR ≥200 was found to be an independent risk factor for OS. In integrating reduced LMR and elevated NLR or PLR to generate a “CBC score” model, adult patients with T‐LBL could be separated into three risk groups. Specifically speaking, patients in the low‐risk group had no CBC abnormality and had a 3‐year OS of 84%, whereas patients in the high‐risk group had a 3‐year OS of merely 30%. Meanwhile, it was demonstrated that CNS involvement significantly shortened both PFS and OS, although an intrathecal injection was routinely performed, which is consistent with a previous study [22]. To the best of our knowledge, the present study has the largest adult T‐LBL cohort and is the first to promote a prognostic model for these patients.
Obtaining LMR, NLR, and PLR from CBC at diagnosis is simple and widely available and can be easily used in clinical practice, especially in resource‐poor areas. The limitations of the present study include the retrospective nature of the study, the short follow‐up period, the relatively small sample size, and lack of cytogenetic data. Another issue is the cutoff value of LMR/NLR/PLR applied in the clinical practice. In previous and present studies, ROC according to survival was applied to determine the best cutoff value, suggesting discordance between centers. Therefore, this requires further exploration in larger samples and prospective trials in the future.
Conclusion
It was confirmed that LMR, NLR, and PLR have predictive value for both PFS and OS and that the “CBC score” model should be initially promoted for stratification in adult patients with T‐LBL. This suggests that these simple, inexpensive, widely available, and easy‐to‐use parameters may be used as a predictive model in T‐LBL. Future studies, especially prospective larger clinical trials, are required to confirm these findings.
See http://www.TheOncologist.com for supplemental material available online.
Acknowledgments
We thank all the treating physicians for allowing us to enroll patients and thank the patients for allowing us to analyze their data.
Author Contributions
Conception/design: Xiaoyan Feng, Xudong Zhang, Mingzhi Zhang
Provision of study material or patients: Xiaoyan Feng, Ling Li, Jingjing Wu, Lei Zhang, Zhenchang Sun, Xin Li, Xinhua Wang, Hui Yu, Yu Chang, Xiaolong Wu, Zhiyuan Zhou
Collection and/or assembly of data: Xiaoyan Feng, Zhaoming Li
Data analysis and interpretation: Xiaoyan Feng, Guannan Wang, Wencai Li
Manuscript writing: Xiaoyan Feng
Final approval of manuscript: Xiaoyan Feng, Ling Li, Jingjing Wu, Lei Zhang, Zhenchang Sun, Xin Li, Xinhua Wang, Hui Yu, Yu Chang, Xiaolong Wu, Zhiyuan Zhou, Guannan Wang, Wencai Li, Zhaoming Li, Xudong Zhang, Mingzhi Zhang
Disclosures
The authors indicated no financial relationships.
References
- 1.Hoelzer D, Gokbuget N, Digel W et al. Outcome of adult patients with T‐lymphoblastic lymphoma treated according to protocols for acute lymphoblastic leukemia. Blood 2002;99:4379–4385. [DOI] [PubMed] [Google Scholar]
- 2.Jain N, Lamb AV, O'Brien S et al. Early T‐cell precursor acute lymphoblastic leukemia/lymphoma (ETP‐ALL/LBL) in adolescents and adults: A high‐risk subtype. Blood 2016;127:1863–1869. [DOI] [PMC free article] [PubMed] [Google Scholar]
- 3.Lenz G, Wright G, Dave SS et al. Stromal gene signatures in large‐B‐cell lymphomas. N Engl J Med 2008;359:2313–2323. [DOI] [PMC free article] [PubMed] [Google Scholar]
- 4.Steidl C, Lee T, Shah SP et al. Tumor‐associated macrophages and survival in classic Hodgkin's lymphoma. N Engl J Med 2010;362:875–885. [DOI] [PMC free article] [PubMed] [Google Scholar]
- 5.Tadmor T, Bari A, Marcheselli L et al. Absolute monocyte count and lymphocyte‐monocyte ratio predict outcome in nodular sclerosis hodgkin lymphoma: Evaluation based on data from 1450 patients. Mayo Clin Proc 2015;90:756–764. [DOI] [PubMed] [Google Scholar]
- 6.Krenn‐Pilko S, Langsenlehner U, Thurner EM et al. The elevated preoperative platelet‐to‐lymphocyte ratio predicts poor prognosis in breast cancer patients. Br J Cancer 2014;110:2524–2530. [DOI] [PMC free article] [PubMed] [Google Scholar]
- 7.Milne K, Alexander C, Webb JR et al. Absolute lymphocyte count is associated with survival in ovarian cancer independent of tumor‐infiltrating lymphocytes. J Transl Med 2012;10:33. [DOI] [PMC free article] [PubMed] [Google Scholar]
- 8.Hu P, Shen H, Wang G et al. Prognostic significance of systemic inflammation‐based lymphocyte‐ monocyte ratio in patients with lung cancer: Based on a large cohort study. PLoS One 2014;9:e108062. [DOI] [PMC free article] [PubMed] [Google Scholar]
- 9.Rambaldi A, Boschini C, Gritti G et al. The lymphocyte to monocyte ratio improves the IPI‐risk definition of diffuse large B‐cell lymphoma when rituximab is added to chemotherapy. Am J Hematol 2013;88:1062–1067. [DOI] [PubMed] [Google Scholar]
- 10.Chen N, Li W, Huang K et al. Increased platelet‐lymphocyte ratio closely relates to inferior clinical features and worse long‐term survival in both resected and metastatic colorectal cancer: An updated systematic review and meta‐analysis of 24 studies. Oncotarget 2017;8:32356–32369. [DOI] [PMC free article] [PubMed] [Google Scholar]
- 11.Romano A, Parrinello NL, Vetro C et al. Prognostic meaning of neutrophil to lymphocyte ratio (NLR) and lymphocyte to monocyte ration (LMR) in newly diagnosed Hodgkin lymphoma patients treated upfront with a PET‐2 based strategy. Ann Hematol 2018;97:1009–1018. [DOI] [PubMed] [Google Scholar]
- 12.Shi L, Qin X, Wang H et al. Elevated neutrophil‐to‐lymphocyte ratio and monocyte‐tolymphocyte ratio and decreased platelet‐to‐lymphocyte ratio are associated with poor prognosis in multiple myeloma. Oncotarget 2017;8:18792–18801. [DOI] [PMC free article] [PubMed] [Google Scholar]
- 13.Dong M, Zhang X, Yang Z et al. Patients over 40 years old with precursor T‐cell lymphoblastic lymphoma have different prognostic factors comparing to the youngers. Sci Rep 2018;8:1088. [DOI] [PMC free article] [PubMed] [Google Scholar]
- 14.Deng Q, He B, Liu X et al. Prognostic value of pre‐operative inflammatory response biomarkers in gastric cancer patients and the construction of a predictive model. J Transl Med 2015;13:66. [DOI] [PMC free article] [PubMed] [Google Scholar]
- 15.Beltran BE, Aguilar C, Quinones P et al. The neutrophil‐to‐lymphocyte ratio is an independent prognostic factor in patients with peripheral T‐cell lymphoma, unspecified. Leuk Lymphoma 2016;57:58–62. [DOI] [PubMed] [Google Scholar]
- 16.Xia WK, Lin QF, Shen D et al. Prognostic significance of lymphocyte‐to‐monocyte ratio in diffuse large B‐cell lymphoma: A systematic review and meta‐analysis. FEBS Open Bio 2016;6:558–565. [DOI] [PMC free article] [PubMed] [Google Scholar]
- 17.Raetz EA, Perkins SL, Bhojwani D et al. Gene expression profiling reveals intrinsic differences between T‐cell acute lymphoblastic leukemia and T‐cell lymphoblastic lymphoma. Pediatr Blood Cancer 2006;47:130–140. [DOI] [PubMed] [Google Scholar]
- 18.Cortelazzo S, Ferreri A, Hoelzer D et al. Lymphoblastic lymphoma. Crit Rev Oncol Hematol 2017;113:304–317. [DOI] [PubMed] [Google Scholar]
- 19.Litzow MR, Ferrando AA. How I treat T‐cell acute lymphoblastic leukemia in adults. Blood 2015;126:833–841. [DOI] [PubMed] [Google Scholar]
- 20.Reiter A, Schrappe M, Ludwig WD et al. Intensive ALL‐type therapy without local radiotherapy provides a 90% event‐free survival for children with T‐cell lymphoblastic lymphoma: A BFM group report. Blood 2000;95:416–421. [PubMed] [Google Scholar]
- 21.Sweetenham JW, Santini G, Qian W et al. High‐dose therapy and autologous stem‐cell transplantation versus conventional‐dose consolidation/maintenance therapy as postremission therapy for adult patients with lymphoblastic lymphoma: Results of a randomized trial of the European Group for Blood and Marrow Transplantation and the United Kingdom Lymphoma Group. J Clin Oncol 2001;19:2927–2936. [DOI] [PubMed] [Google Scholar]
- 22.Thomas DA. Outcome with the hyper‐CVAD regimens in lymphoblastic lymphoma. Blood 2004;104:1624–1630. [DOI] [PubMed] [Google Scholar]
- 23.Coleman CN, Picozzi VJ Jr, Cox RS et al. Treatment of lymphoblastic lymphoma in adults. J Clin Oncol 1986;4:1628–1637. [DOI] [PubMed] [Google Scholar]
- 24.Bassan R, Spinelli O, Oldani E et al. Improved risk classification for risk‐specific therapy based on the molecular study of minimal residual disease (MRD) in adult acute lymphoblastic leukemia (ALL). Blood 2009;113:4153–4162. [DOI] [PubMed] [Google Scholar]
- 25.Stark B, Avigad S, Luria D et al. Bone marrow minimal disseminated disease (MDD) and minimal residual disease (MRD) in childhood T‐cell lymphoblastic lymphoma stage III, detected by flow cytometry (FC) and real‐time quantitative polymerase chain reaction (RQ‐PCR). Pediatr Blood Cancer 2009;52:20–25. [DOI] [PubMed] [Google Scholar]
- 26.Lepretre S, Touzart A, Vermeulin T et al. Pediatric‐like acute lymphoblastic leukemia therapy in adults with lymphoblastic lymphoma: The GRAALL‐LYSA LL03 Study. J Clin Oncol 2016;34:572–580. [DOI] [PubMed] [Google Scholar]
- 27.Gajewski TF, Schreiber H, Fu YX. Innate and adaptive immune cells in the tumor microenvironment. Nat Immunol 2013;14:1014–1022. [DOI] [PMC free article] [PubMed] [Google Scholar]
- 28.Hasenclever D, Diehl V. A prognostic score for advanced Hodgkin's disease. International Prognostic Factors Project on Advanced Hodgkin's Disease. N Engl J Med 1998;339:1506–1514. [DOI] [PubMed] [Google Scholar]
- 29.Yang L, DeBusk LM, Fukuda K et al. Expansion of myeloid immune suppressor Gr+CD11b+ cells in tumor‐bearing host directly promotes tumor angiogenesis. Cancer Cell 2004;6:409–421. [DOI] [PubMed] [Google Scholar]
- 30.Noy R, Pollard Jeffrey W. Tumor‐associated macrophages: From mechanisms to therapy. Immunity 2014;41:49–61. [DOI] [PMC free article] [PubMed] [Google Scholar]
- 31.Liang W, Ferrara N. The complex role of neutrophils in tumor angiogenesis and metastasis. Cancer Immunol Res 2016;4:83–91. [DOI] [PubMed] [Google Scholar]
- 32.Franco AT, Corken A, Ware J. Platelets at the interface of thrombosis, inflammation, and cancer. Blood 2015;126:582–588. [DOI] [PMC free article] [PubMed] [Google Scholar]
- 33.Olsson AK, Cedervall J. The pro‐inflammatory role of platelets in cancer. Platelets 2018;29:569–573. [DOI] [PubMed] [Google Scholar]


