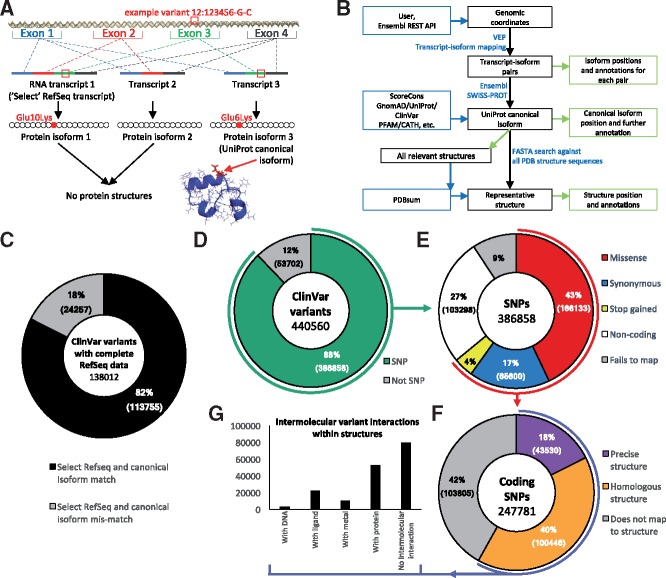
Fig. 1.
Mapping from genomic coordinates to protein sequence and structure. (A) Example missense variant observed on chromosome 12, position 123456, DNA change G/C. Three different transcripts are possible via alternative splicing. Transcript 1 is the longest and is designated as the RefSeq select reference transcript. Three protein isoforms can be created by translating the transcripts. Isoform 3 is designated as the canonical protein isoform in UniProt. The original DNA variant can be mapped onto isoforms 1 and 3, but not to isoform 2 as exon 3 has been spliced out. Isoforms 1 and 2 do not have a corresponding protein 3D structure, whereas isoform 3 does. VarMap maps from the isoform position to the position in the representative structure. (B) Simplified schema for mapping from variant genomic coordinates to protein sequence and structure using VarMap. A more detailed version is available in the Supplementary Materials and on the VarMap website. (C) Shows the percentages of ClinVar variants belonging to a gene whose translated Select RefSeq transcript is identical to the UniProt canonical isoform sequence (black) and those which do not (grey). ClinVar file used: clinvar_20190211.vcf. (D) The percentage of genomic coordinates in ClinVar which are SNPs. (E) A breakdown of the SNP variant types. (F) The percentage of coding SNPs which can be mapped directly to the exact human structure and those which can be mapped to homologous structures. (G) Of the variants which can be mapped to structure, the number which have direct contacts with DNA, metals, ligands and protein as derived from every closely related protein for each variant. The VarMap output from the ClinVar dataset used here is available on the VarMap website. A description of the methods used to generate these plots is available in the Supplementary Material

