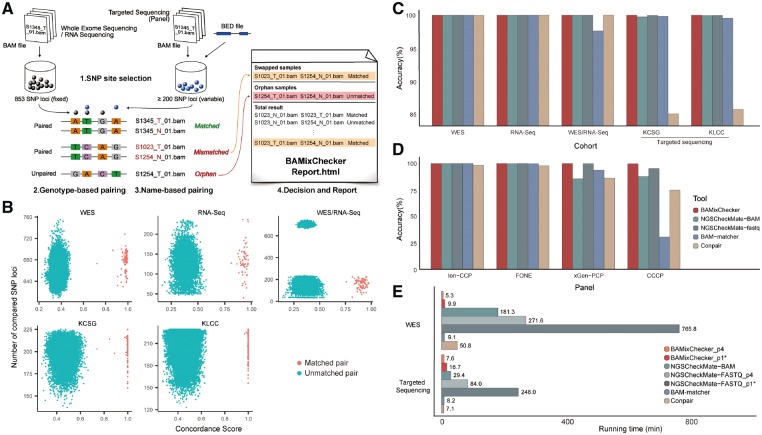
Fig. 1.
(A) Overall workflow of BAMixChecker. (B) Score distribution of BAMixChecker in five datasets. Each dot reflects a comparison result between two samples. Red dots indicate unmatched pairs; blue dots are matched pairs. (C) Accuracies of the four tools in five cohorts. NGSCheckMate contains two different modes (BAM and FASTQ input). WES/RNA-Seq represents a WES-RNA-Seq pair. (D) Accuracy of the four tools in downsampled cohorts. (E) Running times of the four tools. The running times of BAMixChecker and NGSCheckMate were measured in two different modes (p1: single-thread, p4: multi-thread with four processors).*: default

