Power plant exhausts can be identified and quantified from satellite observations.
Abstract
Satellite observations of nitrogen dioxide (NO2) provide valuable information on the location and strength of NOx emissions, but spatial resolution is limited by horizontal transport and smearing of temporal averages due to changing wind fields. In this study, we map NOx emissions on high spatial resolution from TROPOMI observations of NO2 combined with wind fields based on the continuity equation. The divergence of horizontal fluxes proves to be highly sensitive for point sources like exhaust stacks. Thus, NOx emissions from individual power plants can be resolved and quantified even on top of considerably high urban pollution from the Saudi Arabian capital city Riyadh. This allows us to catalog NOx emissions from large point sources globally, as demonstrated for South Africa and Germany, with a detection limit of about 0.11 kg/s down to 0.03 kg/s for ideal conditions.
INTRODUCTION
Nitrogen oxides (NO and NO2, summarized as NOx) are key ingredients in urban pollution as they affect human health (1) and control ozone production (2). Accurate and up-to-date NOx emission data on high spatial resolution are, thus, a prerequisite for improving the prediction of air quality with regional atmospheric chemistry models (3). For more than two decades, satellite measurements allow the retrieval of tropospheric NO2 columns (4), providing valuable information on spatial patterns and magnitude of NOx emissions and their trends on a global scale (5–8), where spatial resolution, so far, was limited by the satellites’ footprint of 13 × 24 km2 (9) or more.
On 13 October 2017, the TROPOspheric Monitoring Instrument (TROPOMI) (10, 11) on the European Space Agency’s (ESA’s) Sentinel-5 Precursor (S-5P) mission was launched, with an unprecedented spatial resolution of up to 3.5 × 7 km2 and a high signal-to-noise ratio. A single TROPOMI overpass already reveals the downwind plumes of strong point sources (Fig. 1A). In a temporal average (which is required for robust statistics), however, the NO2 patterns are smeared out (Fig. 1B) due to changing wind patterns, and the benefit of TROPOMI’s high spatial resolution is diminished.
Fig. 1. Tropospheric NO2 column over Riyadh as derived from TROPOMI.
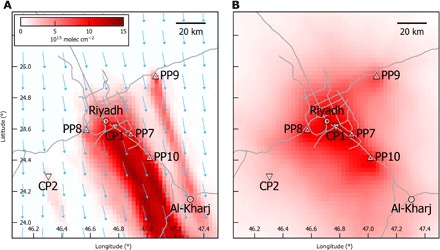
(A) Single overpass on 17 December 2017. Arrows indicate ECMWF wind vectors at 450 m above ground. Gray lines show motorways and trunk roads (20). Symbols mark city centers (o), PPs (Δ), and CPs (∇). See table S1 for plant locations and references. (B) Temporal average for December 2017 to October 2018.
Here, we extract top-down NOx emission maps on high spatial resolution based on TROPOMI NO2 tropospheric columns V combined with wind fields w from the European Center for Medium Range Weather Forecasts (ECMWF) (12). The key for preventing the smearing of V due to wind changes is to average horizontal fluxes, rather than columns, which preserve strong gradients at point sources like power plants (PPs) or cement plants (CPs) in the temporal mean. The NOx flux is given as F = LVw, where L is the ratio of NOx and NO2. According to the continuity equation for steady state, the divergence D of the flux F yields the sources E and sinks S of NOx: D: = ∇(LVw) = E – S.
As the local overpass time of TROPOMI is close to noon (1330 local time), the NOx sinks are dominated by the chemical loss due to reaction of NO2 with OH (2), which can be described by a first-order time constant τ and, thus, can be estimated from the measured column itself: S = LV/τ. Hence, NOx emissions can be calculated as
As the divergence is a linear operator, the temporal mean emissions can be determined from the temporal mean sinks plus the divergence of the temporal mean flux, which in general has a smooth spatial distribution, allowing for the calculation of spatial derivatives.
RESULTS AND DISCUSSION
We demonstrate this procedure for the Saudi Arabian capital Riyadh, where NOx emissions are high and remote from other sources, and observation conditions are favorable due to the generally low cloud cover and high surface albedo. Below, we use τ = 4 ± 1.3 hours, as derived empirically from the NO2 downwind plume evolution for Riyadh (8), and L = 1.32 ± 0.26 (see the Supplementary Materials for discussion of assumptions and uncertainties). Figure 2 displays maps of the sink term S, the divergence D, and the resulting NOx emissions E = D + S in Fig. 2 (A to C, respectively) for almost 1 year of TROPOMI measurements over Riyadh. Intersects of S, D, and E crossing PP9 and PP10 are shown in Fig. 2D.
Fig. 2. NOx budget over Riyadh for December 2017 to October 2018.
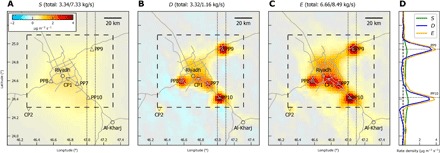
(A) sinks S, (B) divergence D, and (C) top-down NOx emissions E = S + D. Numbers on top give spatial integrals for urban area (dashed rectangle) and greater area (250 × 250 km2). (D) Meridional sections of S, D, and E at 47.05°E (dotted rectangle), crossing PP9 and PP10.
The sink term (Fig. 2A) is proportional to the mean column V as shown in Fig. 1B. The divergence of the NOx flux D (Fig. 2B) reveals several positive spikes, indicating strong localized sources (i.e., the flux is strongly increased over these spots). All of these spikes correspond to the locations of point sources like PPs and/or CPs. In addition, D is enhanced throughout the urban area of Riyadh due to emissions from traffic and other industries. Outside, the divergence becomes negative, since here, the change of the NOx flux is governed by chemical loss. Note that net D cancels out as soon as sources and sinks are in mass balance, i.e., if integrated over larger spatial scales of some hundred kilometers.
Resulting emission patterns E = S + D (Fig. 2C) are dominated by the strong PP peaks of D. The addition of S = V/τ compensates for the negative divergences around the city, resulting in emissions of about zero. This indicates that the assumed lifetime is appropriate. At the city center, D and S contribute about two-thirds and one-thirds to E, respectively, while for PPs, E is by far dominated by D (87% for PP9).
The strong emissions of PP9 and PP10 already lead to quite broad local maxima in temporal mean V (Fig. 1B) and, consequently, in S (Fig. 2, A and D), while they show up as quasi-point sources in D and E with high spatial contrast (Fig. 2, B to D). While changing wind patterns smear out spatial patterns of V in the long-term mean, the divergence method can therefore be understood to deconvolve back the measured columns into underlying emission patterns and accounts for the effects of horizontal transport.
For the urban area (dashed rectangle in Fig. 2), S and D contribute to E about equally, whereas greater area emissions are dominated by S. The total emissions over 250 × 250 km2 are 8.5 kg/s, which is smaller than a previous estimate of 11.4 kg/s derived from the ozone monitoring instrument (OMI) data 2005–2009 (8), but in accordance with a general decrease in NO2 levels over Riyadh in recent years (13). Although total emissions agree very well to bottom-up emissions from the Emission Database for Global Atmospheric Research (EDGAR) (14) for the year 2011, spatial patterns are quite different (fig. S1).
Previous studies derived top-down NOx emissions from satellite measurements of NO2 based on the sink term S alone (5, 6), ignoring horizontal transport effects, which is appropriate on larger spatial scales of a few hundred kilometers. The unique advantage of the high spatial resolution of S-5P/TROPOMI and the presented divergence method, however, is the clear localization of point sources like PP and CP stacks. We quantify the contribution of emissions from point sources to the total Riyadh emissions by iteratively fitting two-dimensional (2D) Gaussians on top of a linear background to the emission map. This algorithm automatically identifies the emissions of PP7 to PP10 and CP1 as the five largest point sources around Riyadh. CP2 is found in addition by applying the peak fitting algorithm to a regional section excluding the Riyadh city center. All point source emissions are above the detection limit of 0.03 kg/s (see the Supplementary Materials). Figure 3 displays the respective point source emissions Eps (Fig. 3A) and the residual city emissions E − Eps caused by traffic and weaker industrial exhausts (Fig. 3B). Such a separation and quantification of point source emissions would not be possible if based on temporal averages of NO2 columns alone (Fig. 1B), but require the high-resolution information gained by the divergence method.
Fig. 3. Separation of top-down emissions in point sources and residual city emissions.
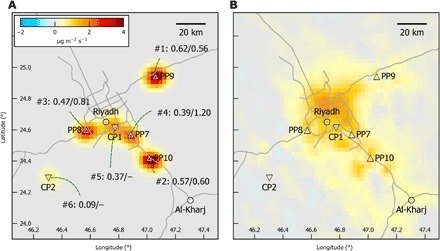
(A) Detected point source peaks Eps, identified as PP7 to P10 and CP1 and CP2. For each point source, a label provides i) the rank within the iterative peak fitting, ii) the total emission rate (in kg/s), and iii) the emission intensity (in g/kWh) resulting from division by PP capacity (table S1). (B) Residual city emissions E − Eps.
Riyadh PPs burn crude oil and, partly, natural gas (table S1). The derived emission intensities, i.e., emissions per capacity, of the order of 1 g/kWh are comparable to values for U.S. coal-fired PPs but far higher than those of modern natural gas combined cycle PPs (15).
In total, Riyadh urban area emissions are 6.6 kg/s, whereby emissions of 2.5 kg/s are released by point sources. Corresponding uncertainties are 47% for S due to uncertainties in V (30%), L (20%), and τ (35%), and 37% for D due to uncertainties in V (30%), L (20%), and wind fields (20%) (see the Supplementary Materials for details on error contributions).
The uncertainty of integrated emissions E = S + D over the Riyadh urban area, where S and D contribute equally, is 42% (as S and D both depend on V and L, errors cannot be added quadratically here). Integrated emissions on larger spatial scales are dominated by S and have uncertainties of about 50%, with the uncertainty of the NOx lifetime being the largest contribution.
Point source emissions estimated by the peak fitting algorithm, however, are based on the strong gradient of the NOx flux right at the source. EPS is thus affected by uncertainties in D (37%) and the peak fitting settings (20%) but not by the NOx lifetime, resulting in an uncertainty of 42%.
Riyadh provides favorable observation conditions due to the high surface albedo and low cloud fractions. We derived top-down emissions for two additional regions with less optimal conditions: South Africa and Germany. The method works there as well, but associated uncertainties are larger (~65% for EPS) and the detection limit for point sources is higher (0.11 kg/s) (see the Supplementary Materials) due to lower sensitivity and lower sample sizes, as observations under cloudy sky conditions are discarded.
Top-down emissions E for the South-African Highveld are displayed in Fig. 4A. The respective maps for S and D are displayed in fig. S2. Several point sources show up corresponding to the location of coal-fired PPs. In addition, a synthetic fuel plant could be identified as a strong point source.
Fig. 4. NOx emissions over the South African Highveld.
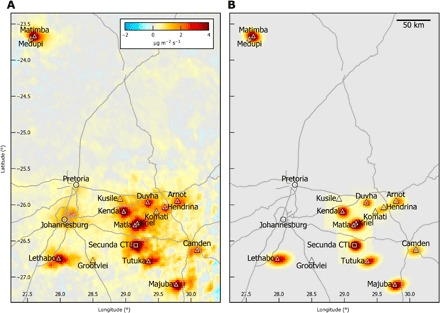
(A) Top-down emissions E averaged for December 2017 to October 2018. Gray lines show motorways and trunk roads. Symbols mark city centers (o), PPs (Δ), and a synthetic fuel plant (□). (B) Fitted point sources Eps. See table S2 for point source locations, references, and derived emissions.
The enlarged scatter of D and E at the southeastern edge is related to increased uncertainties in the wind fields over mountainous terrain. Figure 4B displays the fitted point sources. All PPs with capacities >1.5 GW were automatically identified by the peak fitting routine. The resulting emissions and the PP emission intensities of the order of 1 g/kWh are listed in table S2.
For Germany, only the months of April to October are included to apply the same a priori values for τ and L as for Riyadh and to avoid retrieval complications due to snow. Figure 5A displays the resulting top-down emissions. The respective maps for S and D are shown in fig. S3.
Fig. 5. NOx emissions for Germany.
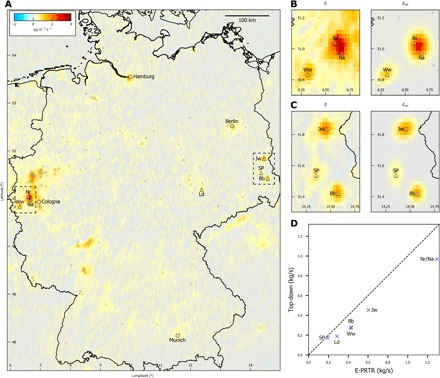
(A) Top-down emissions E averaged for April to October 2018. Large cities (>106 inhabitants) and the lignite-fired PPs (>1 GW) are labeled. Smaller cities (>2 × 10⁵ inhabitants) and the 100 largest point sources in Germany, as listed in E-PRTR, are shown by gray symbols (Δ, PP; ∇, CP; and □, other). Dashed rectangles indicate zoom regions. (B and C) Zooms of top-down emissions (left) and corresponding fitted point sources (right) for western and eastern PPs, respectively. (D) Correlation of fitted point source emissions to bottom-up values from E-PRTR for lignite PPs. See table S3 for details. Nr, Neurath; Na, Niederaußem; Jw, Jänschwalde; Bb, Boxberg; Ww, Weisweiler; Ld, Lippendorf; SP, Schwarze Pumpe.
According to the European Pollutant Release and Transfer Register (E-PRTR) (16), the seven largest lignite-fired PPs are the strongest point sources for NOx over Germany. In addition, the top-down emission map reveals high values over densely populated and industrial areas like the Ruhr area north from Cologne or the Rhine-Main region around Frankfurt (50°N, 8°E to 9°E), matching the accumulation of several smaller point sources reported in E-PRTR.
We apply the peak fitting algorithm to regional sections around the lignite-fired PPs (Fig. 5, B and C) and find a very good correlation of R2 = 0.99 between fitted emissions and E-PRTR (Fig. 5D). Estimated emissions (table S3) are all above the detection limit of 0.11 kg/s but are about 30% lower than the values reported in E-PRTR. This deviation is in accordance with the uncertainty of about 65% but indicates a systematic effect. The derived emission intensities are about 0.2 g/kWh.
As demonstrated, top-down emission maps on high spatial resolution can be derived by combining satellite measurements of tropospheric NO2 columns with wind fields but without the need for chemical transport models as in previous studies (17, 18). This approach can be applied on a global scale, which is particularly beneficial for up-to-date NOx emission inventories for quickly developing countries, where bottom-up inventories are outdated or not available at all. In addition, the high sensitivity of the divergence on point sources allows them to be localized with an accuracy below 2 km, which might also prove helpful for upcoming CO2 monitoring satellite missions and quantify the emissions of point sources with uncertainties of about 40% and a detection limit of 0.03 kg/s under ideal conditions. But even under suboptimal conditions (particularly poorer statistics due to clouds), the divergence reveals point emissions around the world, with uncertainties of about 65% and a detection limit of 0.11 kg/s.
MATERIALS AND METHODS
Satellite data
The TROPOMI instrument on the S-5P satellite provides almost daily global coverage of tropospheric column densities (simply denoted as columns in this study) of NO2 with a spatial resolution of 3.5 × 7 km2 (3.5 × 5.5 km2 from August 2019 onward) with overpasses at about 1330 local time.
Tropospheric NO2 columns were taken from S-5P/TROPOMI L2 offline products (11). Measurements with cloud fraction above 30% or a “qa value” (indicating data quality) below 0.75 were skipped. Daily maps were created by gridding the NO2 columns on a regular latitude-longitude grid with 0.027° spacing corresponding to 3 km in latitudinal direction. For each overpass, the 5th percentile within the considered region was subtracted from the operational tropospheric column to remove biases of the stratospheric estimate and the upper tropospheric background, resulting in the lower tropospheric column V.
Wind data
Wind data were taken from the ECMWF operational analysis (12). The six-hourly output was interpolated linearly to the TROPOMI orbit timestamp, which is typically 1 hour prior to the Riyadh overpass. Wind vectors w = (u, v) were taken from a vertical model level corresponding to an altitude of about 450 m above the ground. For sensitivity studies, also other model levels (about 250 and 730 m above the ground) have been analyzed.
Divergence
Maps of daily zonal and meridional fluxes F = (Fu, Fv) were derived by multiplying gridded V with spatially interpolated wind fields w. Temporal means of F (fig. S4) were used for the calculation of D. Numerical derivatives were calculated as the fourth-order central-finite difference (y−2 − 8y−1 + 8y+1 − y+2)/(12 h) (19), with h being the spacing in x.
Iterative peak fitting
To separate point source emissions from polluted city background, an iterative peak fitting algorithm was applied:
1) For a given map of E, the location of the maximum Pmax = (latmax, lonmax) was determined.
2) Around Pmax, a 2D Gaussian on top of a linear background was fitted.
3) The fitted peak was subtracted from E.
Figure S5 illustrates this procedure in 1D for intersects through PP9 and PP10.
The fitted Gaussian function includes parameters for constant and linear background, shift of the peak position in latitude (lat) and longitude (lon), and width parameters in lat and lon, and allows for free rotation.
The peak position was determined without any a priori knowledge about the location of point sources. In the second step, the fitted peak emissions were associated to the point source with closest match in space between fitted maximum position and a priori location. For Riyadh, the iterative peak fitting yields six point sources, all of which could be matched to a PP/CP, with distances of less than 2 km between fitted and a priori position, i.e., better than the grid spacing of 3 km.
Supplementary Material
Acknowledgments
We thank ESA and the S-5P/TROPOMI level 1 and level 2 teams for the great work on initiating and realizing TROPOMI and for providing tropospheric NO2 columns. V. Kumar (MPI-C Mainz) and A. Richter (University Bremen) are acknowledged for stimulating discussions. Funding: The authors acknowledge that they received no funding in support of this research. Author contributions: S.B. and Z.H. developed the divergence methodology. C.B. processed the TROPOMI L2 data. S.D. processed the ECMWF wind data. F.L. and Y.W. provided input on methodology and interpretation. A.L. and T.W. supervised this study. S.B. performed the analysis and wrote the paper with input from all co-authors. Competing interests: The authors declare that they have no competing interests. Data and materials availability: NO2 tropospheric columns from S-5P/TROPOMI are provided by ESA via the Copernicus Open Access Hub (https://scihub.copernicus.eu/) and the Sentinel-5P Pre-Operations Data Hub (https://s5phub.copernicus.eu/), respectively. ECMWF wind fields are available upon submission. Motorways and trunk roads were provided by OpenStreetMap (https://www.openstreetmap.org). E-PRTR point source emissions are available at http://ftp.eea.europa.eu/www/eprtr/v16/E-PRTR_database_v16_xls.zip. All data needed to evaluate the conclusions in the paper are present in the paper and/or the Supplementary Materials. Additional data related to this paper may be requested from the authors.
SUPPLEMENTARY MATERIALS
Supplementary material for this article is available at http://advances.sciencemag.org/cgi/content/full/5/11/eaax9800/DC1
Supplementary Text
Fig. S1. Bottom-up emissions for Riyadh.
Fig. S2. NOx budget for PPs over the South African Highveld.
Fig. S3. NOx budget for Germany.
Fig. S4. Mean NOx flux over Riyadh.
Fig. S5. Illustration of the iterative peak fitting in 1D.
Fig. S6. Impact of errors in wind fields.
Table S1. Considered point sources around Riyadh.
Table S2. Considered point sources in South Africa.
Table S3. Considered point sources in Germany.
REFERENCES AND NOTES
- 1.U.S. Environmental Protection Agency (EPA), Integrated Science Assessment (ISA) for Oxides of Nitrogen – Health Criteria (Final Report) (Publication EPA/600/R-15/068, EPA, 2016); www.epa.gov/isa/integrated-science-assessment-isa-nitrogen-dioxide-health-criteria.
- 2.Seinfeld J. H., Urban air pollution: State of the Science. Science 243, 745–752 (1989). [DOI] [PubMed] [Google Scholar]
- 3.Bouarar I., Brasseur G., Petersen K., Granier C., Fan Q., Wang X., Wang L., Ji D., Liu Z., Xie Y., Gao W., Elguindi N., Influence of anthropogenic emission inventories on simulations of air quality in China during winter and summer 2010. Atmos. Environ. 198, 236–256 (2019). [Google Scholar]
- 4.A. Richter, T. Wagner, The use of uv, visible and near ir solar back scattered radiation to determine trace gases, in The Remote Sensing of Tropospheric Composition from Space, J. P. Burrows, P. Borrell, U. Platt, R. Guzzi, U. Platt, L. J. Lanzerotti, Eds. (Springer, 2011), pp. 67–121. [Google Scholar]
- 5.Leue C., Wenig M., Wagner T., Klimm O., Platt U., Jähne B., Quantitative analysis of NOx emissions from Global Ozone Monitoring Experiment satellite image sequences. J. Geophys. Res. 106, 5493–5505 (2001). [Google Scholar]
- 6.Martin R. V., Jacob D. J., Chance K., Kurosu T. P., Palmer P. I., Evans M. J., Global inventory of nitrogen oxide emissions constrained by space-based observations of NO2 columns. J. Geophys. Res. 108, 4537 (2003). [Google Scholar]
- 7.Richter A., Burrows J. P., Nüß H., Granier C., Niemeier U., Increase in tropospheric nitrogen dioxide over China observed from space. Nature 437, 129–132 (2005). [DOI] [PubMed] [Google Scholar]
- 8.Beirle S., Boersma K. F., Platt U., Lawrence M. G., Wagner T., Megacity emissions and lifetimes of nitrogen oxides probed from space. Science 333, 1737–1739 (2011). [DOI] [PubMed] [Google Scholar]
- 9.Levelt P., Van den Oord G., Dobber M., Malkki A., Visser H., de Vries J., Stammes P., Lundell J., Saari H., The Ozone Monitoring Instrument. IEEE Trans. Geosci. Remote Sens. 44, 1093–1101 (2006). [Google Scholar]
- 10.Veefkind J. P., Aben I., McMullan K., Förster H., de Vries J., Otter G., Claas J., Eskes H. J., de Haan J. F., Kleipool Q., van Weele M., Hasekamp O., Hoogeveen R., Landgraf J., Snel R., Tol P., Ingmann P., Voors R., Kruizinga B., Vink R., Visser H., Levelt P. F., TROPOMI on the ESA Sentinel-5 Precursor: A GMES mission for global observations of the atmospheric composition for climate, air quality and ozone layer applications. Remote Sens. Environ. 120, 70–83 (2012). [Google Scholar]
- 11.J. H. G. M. van Geffen, H. J. Eskes, K. F. Boersma, J. D. Maasakkers, J. P. Veefkind, “TROPOMI ATBD of the total and tropospheric NO2 data products” (S5P-KNMI-L2-0005-RP, Royal Netherlands Meteorological Institute, 2019); https://sentinel.esa.int/documents/247904/2476257/Sentinel-5P-TROPOMI-ATBD-NO2-data-products.
- 12.ECMWF analysis data. In IFS Documentation CY43R3/45R1 (ECMWF, 2017); www.ecmwf.int/en/forecasts/documentation-and-support/changes-ecmwf-model/ifs-documentation.
- 13.Lelieveld J., Beirle S., Hörmann C., Stenchikov G., Wagner T., Abrupt recent trend changes in atmospheric nitrogen dioxide over the Middle East. Sci. Adv. 1, e1500498 (2015). [DOI] [PMC free article] [PubMed] [Google Scholar]
- 14.Crippa M., Guizzardi D., Muntean M., Schaaf E., Dentener F., van Aardenne J. A., Monni S., Doering U., Olivier J. G. J., Pagliari V., Janssens-Maenhout G., Gridded emissions of air pollutants for the period 1970–2012 within EDGAR v4.3.2. Earth Syst. Sci. Data 10, 1987–2013 (2018). [Google Scholar]
- 15.de Gouw J. A., Parrish D. D., Frost G. J., Trainer M., Reduced emissions of CO2, NOx, and SO2 from U.S. power plants owing to switch from coal to natural gas with combined cycle technology. Earth’s Future 2, 75–82 (2014). [Google Scholar]
- 16.The European Pollutant Release and Transfer Register (E-PRTR) version 16; http://ftp.eea.europa.eu/www/eprtr/v16/E-PRTR_database_v16_xls.zip.
- 17.Mijling B., van der A R. J., Using daily satellite observations to estimate emissions of short-lived air pollutants on a mesoscopic scale. J. Geophys. Res. 117, 10.1029/2012JD017817, (2012). [Google Scholar]
- 18.Kong H., Lin J., Zhang R., Liu M., Weng H., Ni R., Chen L., Wang J., Zhang Q., High-resolution (0.05°×0.05°) NOx emissions in the Yangtze River Delta inferred from OMI. Atmos. Chem. Phys. 19, 12835–12856 (2019). [Google Scholar]
- 19.I. N. Bronstein, K. A. Semendjajew, Taschenbuch der Mathematik (Verlag Harri Deutsch, ed. 20, 1981). [Google Scholar]
- 20.Motorways and trunk roads from Open street map contributors (OpenStreetMap, 2019), retrieved from; https://download.geofabrik.de/asia/gcc-states.html.
- 21.Silvern R. F., Jacob D. J., Mickley L. J., Sulprizio M. P., Travis K. R., Marais E. A., Cohen R. C., Laughner J. L., Choi S., Joiner J., Lamsal L. N., Using satellite observations of tropospheric NO2 columns to infer long-term trends in US NOx emissions: The importance of accounting for the free tropospheric NO2 background. Atmos. Chem. Phys. 19, 8863–8878 (2019). [Google Scholar]
- 22.Boersma K., Eskes H., Brinksma E., Error analysis for tropospheric NO2 retrieval from space. J. Geophys. Res. 109, 10.1029/2003JD003962, (2004). [Google Scholar]
- 23.S. Compernolle, T. Verhoelst, G. Pinardi, J. Granville, J.-C. Lambert, K.-U. Eichmann, S5P MPC VDAF Validation Web Article: Nitrogen Dioxide Column Data (2018); http://mpc-vdaf.tropomi.eu/ProjectDir/reports//pdf/S5P-MPC-VDAF-WVA-L2_NO2_20180904.pdf.
- 24.Valin L. C., Russell A. R., Hudman R. C., Cohen R. C., Effects of model resolution on the interpretation of satellite NO2 observations. Atmos. Chem. Phys. 11, 11647–11655 (2011). [Google Scholar]
- 25.Liu F., Beirle S., Zhang Q., Dörner S., He K., Wagner T., NOx lifetimes and emissions of cities and power plants in polluted background estimated by satellite observations. Atmos. Chem. Phys. 16, 5283–5298 (2016). [Google Scholar]
- 26.Coburn J. J., Assessing wind data from reanalyses for the upper midwest. J. Appl. Meteor. Climatol. 58, 429–446 (2019). [Google Scholar]
- 27.Riyadh Crude Oil-Fired Power Plant (Power Technology, 2016); www.power-technology.com/projects/riyadh/.
- 28.Saudi Arabia Power Plants Database (Global Energy Observatory, 2018); https://datasource.kapsarc.org/explore/dataset/saudi-arabia-power-plants-database0/.
- 29.The global cement report, 2019, Tradeship Publications Ltd., www.cemnet.com/global-cement-report/country/saudi-arabia.
- 30.List of power stations in South Africa; https://en.wikipedia.org/wiki/List_of_power_stations_in_South_Africa.
- 31.Secunda CTL; https://en.wikipedia.org/wiki/Secunda_CTL.
- 32.List of power stations in Germany; https://en.wikipedia.org/wiki/List_of_power_stations_in_Germany.
Associated Data
This section collects any data citations, data availability statements, or supplementary materials included in this article.
Supplementary Materials
Supplementary material for this article is available at http://advances.sciencemag.org/cgi/content/full/5/11/eaax9800/DC1
Supplementary Text
Fig. S1. Bottom-up emissions for Riyadh.
Fig. S2. NOx budget for PPs over the South African Highveld.
Fig. S3. NOx budget for Germany.
Fig. S4. Mean NOx flux over Riyadh.
Fig. S5. Illustration of the iterative peak fitting in 1D.
Fig. S6. Impact of errors in wind fields.
Table S1. Considered point sources around Riyadh.
Table S2. Considered point sources in South Africa.
Table S3. Considered point sources in Germany.


