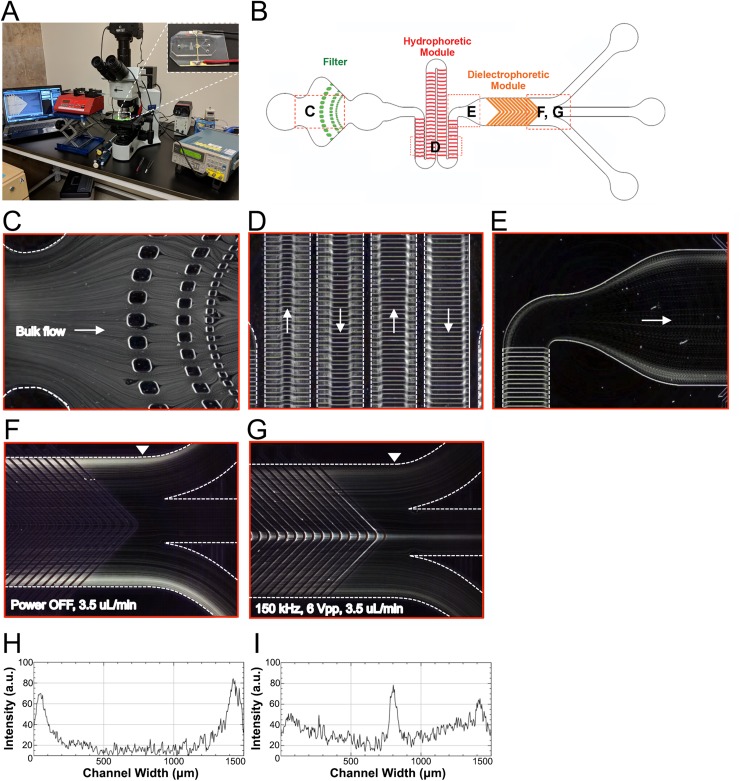
FIG. 3.
Functional analysis of the HOAPES device. (a) For sorting cells, the HOAPES device (inset) is mounted on the stage of an upright microscope to enable visualization of cells in the channel. The device is connected to a function generator for DEP and syringe pump for constant fluid flow. (b) Red dashed boxes on the HOAPES device schematic show the locations where images in (c)–(g) were taken. (c) The trajectories of mouse NSPCs in the HOAPES device were obtained from Z-projections (see the Materials and Methods section). Individual cells easily pass the PDMS pillars of the filter region designed to prevent cell clumps from entering the channel. (d) In the hydrophoretic module, cell trajectories show that cells are gradually directed into 2 streams along the channel edges. Arrows indicate the direction of fluid flow. (e) At the end of the hydrophoretic module, cells are in 2 streams along the channel edges as they enter the DEP module. Arrow indicates the direction of fluid flow. (f) When power to the DEP module is off, the cells remain in 2 streams along the channel edges and exit the two outer channels. (g) When power to the DEP module is on and electrodes are actuated at 150 kHz and 6 Vpp, a subset of cells are focused to the middle of the channel and exit via the inner channel. (h) Plot shows the signal intensity of cell trajectories across the channel width when power to the DEP module is off [image in (f)]. The arrowhead in (f) indicates the region of the channel across which the signal intensity was measured. Two peaks are evident along the channel edges. (i) Plot shows the signal intensity of cell trajectories across the channel width when power to the DEP module is on [(image in (g)]. The arrowhead in (g) indicates the region of the channel across which the signal intensity was measured. A peak is evident in the center of the channel, and the two peaks along the channel edges are lower than those in (h). Flow rate in (c)–(g) was 3.5 μl/min.

