Abstract
Abundances of a range of air pollutants can be inferred from satellite UV-Vis spectroscopy measurements by using the unique absorption signatures of gas species. Here, we implemented several spectral fitting methods to retrieve tropospheric NO2, SO2, and HCHO from the ozone monitoring instrument (OMI), with radiative simulations providing necessary information on the interactions of scattered solar light within the atmosphere. We analyzed the spatial distribution and temporal trends of satellite-observed air pollutants over eastern China during 2005–2017, especially in heavily polluted regions. We found significant decreasing trends in NO2 and SO2 since 2011 over most regions, despite varying temporal features and turning points. In contrast, an overall increasing trend was identified for tropospheric HCHO over these regions in recent years. Furthermore, generalized additive models were implemented to understand the driving forces of air quality trends in China and assess the effectiveness of emission controls. Our results indicated that although meteorological parameters, such as wind, water vapor, solar radiation and temperature, mainly dominated the day-to-day and seasonal fluctuations in air pollutants, anthropogenic emissions played a unique role in the long-term variation in the ambient concentrations of NO2, SO2, and HCHO in the past 13 years. Generally, recent declines in NO2 and SO2 could be attributed to emission reductions due to effective air quality policies, and the opposite trends in HCHO may urge the need to control anthropogenic volatile organic compound (VOC) emissions.
Subject terms: Atmospheric optics, Optical spectroscopy
Air pollution: satellite sees significant trends in China
Satellite-based observations of air pollution in China reveal a recent declining trend in the levels of nitrogen dioxide (NO2) and sulfur dioxide (SO2), but rising levels of formaldehyde (HCHO). Chengxin Zhang and colleagues at the University of Science and Technology of China, with co-workers at other Chinese research centers, analyzed ultraviolet-visible spectroscopy data from the Ozone Monitoring Instrument of NASA’s EOS-Aura satellite. Meteorological effects such as winds, temperature and humidity caused day-to-day and seasonal fluctuations, but human activity appears responsible for long term trends. Declines in NO2 and SO2 levels occurred from 2011, across most regions, and are attributed to effective air quality policies. The rising trend in HCHO levels suggests that new measures may be needed to control the release by human activities of that and other volatile organic compounds.
Introduction
Nitrogen dioxides (NO2), sulfate dioxides (SO2), and formaldehyde (HCHO) are short-lived and reactive trace gases that play important roles in atmospheric chemistry and air pollution1. NO2 and SO2 can be converted into secondary inorganic aerosols, i.e., nitrate and sulfate, respectively, via reactions with OH radicals2. HCHO usually originates from the photochemical reactions of volatile organic compounds (VOCs) and can be used as a proxy for the total reactivity of VOCs3. The sources of VOCs include fire, vegetation and anthropogenic emissions4. VOCs are important precursors of secondary organic aerosols and ozone (O3)5. Anthropogenic emissions from the power, industrial, residential, transportation, and agricultural sectors enhance the concentrations of these gases in the troposphere, especially in the boundary layer, over urban areas.
Spectroscopy techniques greatly advance the comprehensive understanding of air pollution evolution6–9, especially with the broad application of ground-based and space-based passive and active remote sensing. Since the 1990s, numerous space-borne ultraviolet-visible (UV-Vis) spectrometers, e.g., the Global Ozone Monitoring Experiment (GOME)10, SCanning Imaging Absorption SpectroMeter for Atmospheric CHartographY (SCIAMACHY)11, Ozone Monitoring Instrument (OMI)12, and Global Ozone Monitoring Experiment–2 (GOME-2)13,14, have achieved the global monitoring of atmospheric trace gases, including NO2, SO2, HCHO, and O3, by using their unique absorption signatures in a shorter wavelength range (250–500 nm). In principle, the numerical inversion methods of these key atmospheric variables could be achieved by incorporating radiative transfer simulations on the interactions of solar scattered light within the atmosphere15.
With rapid economic growth and urbanization, central and eastern China have been suffering from severe air pollution over the last decade16–18. Anthropogenic pollutant emissions are a primary cause of ambient air pollution. In addition, meteorological factors could also impact air quality through atmospheric processes such as formation, transport, convection and both the dry and wet deposition of air pollutants1. The role of emissions and meteorological conditions in the evolution of air pollution has been investigated for cases such as heavy pollution episodes in winter in Beijing19 and several important international events during which the government has conducted strict emission controls in Beijing and Nanjing20–22. Nevertheless, there still remain a series of unanswered questions, e.g., the separation of meteorological effects from the human-induced variations in air pollution and the evaluation of the effectiveness of emission control measures or air quality policies implemented by the Chinese government, such as the Air Pollution Prevention and Control Action Plan (APPCAP) issued in 201323.
A number of studies have focused on the relative contributions of emissions and meteorological conditions. However, their conclusions were restricted to either small geographical areas or short periods based on limited in situ measurements. Due to the advantage of satellite observations in terms of spatiotemporal coverage, some studies have clearly captured the temporal variability in tropospheric air pollutants over China and attributed the long-term pollutant trends to the variation in anthropogenic emissions such as nitrogen oxides (NOx) and SO224,25. However, to better understand the effects of anthropogenic emissions and emission control measures, the influences of meteorological conditions should be separated from the long-term satellite-observed air quality trends.
In this study, satellite spectroscopic measurements from the OMI were first used to retrieve the tropospheric abundances of NO2, SO2 and HCHO over central and eastern China (20°–45°N, 100°–125°E), and then air quality trends were analyzed based on the derived spatiotemporal data. The OMI was selected due to its high signal-to-noise ratio, fine spatial resolution, stable spectral performance, and most importantly, long temporal coverage26 compared to other satellite sensors of its type, such as GOME-2, SCIAMACHY, etc. Several heavily polluted and densely populated regions were focused on, e.g., Beijing-Tianjin-Hebei (BTH), Changjiang River Delta (YRD), Zhujiang River Delta (PRD), and Sichuan Basin (SCB). These regions have drawn increasing scientific attention to their widespread air pollution in the last decade. Due to the complex interactions and feedbacks between meteorological conditions and air quality19, separating the effects of emission variations on air quality trends from meteorological factors remains challenging. Here, we have implemented generalized additive models (GAMs) to quantitatively assess the impacts of meteorological and anthropogenic variables on air quality variations for typical megacities over these regions. The GAMs make use of penalized smoothing splines, which could address the complex non-linearity existing in air quality and meteorology research27. Contrary to previous studies20–22 relying on the atmospheric chemistry model, this novel statistical method based on long-term satellite observations provides an explicit solution for quantifying natural and anthropogenic impacts and assessing the role of emission control measures on air quality trends.
Results
The spatiotemporal variability in OMI-measured air pollutants
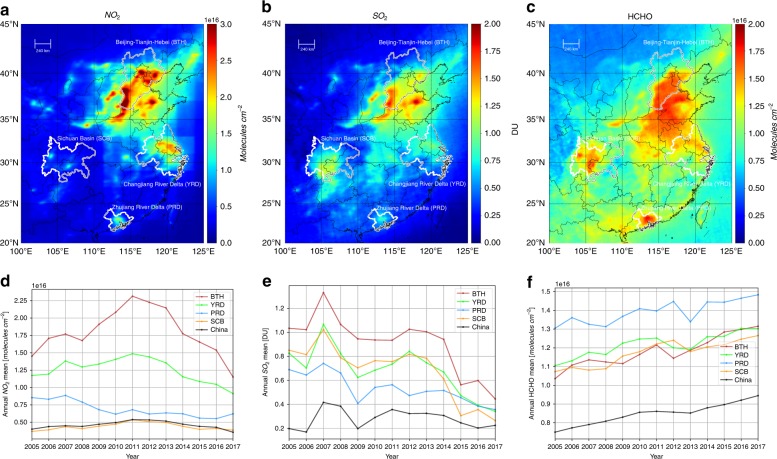
The spatial distributions of the tropospheric VCD retrievals of NO2, SO2, and HCHO during 2005–2017 are presented in Fig. 1a–c, respectively. Extremely high concentrations of air pollutants can be clearly found with a large spatial coverage over typical industrial and densely populated regions in China, e.g., BTH, YRD, PRD, and SCB. Spatially, BTH suffered from the most severe NO2 and SO2 pollution levels compared to other regions. A large hotspot of HCHO pollution can also be seen over these industrial areas, especially in PRD. Based on the VCD variation patterns shown in Fig. 1d–f, we concluded that the interannual variability in OMI-measured pollutants during 2005–2017 over central and eastern China was not monotonically increasing or decreasing but had different temporally varying regimes for individual gas species and regions. In addition, the temporal trends of these pollutants were spatially consistent for the satellite ground pixels within each region (See Fig. S1). Therefore, for each region, we could use the spatial average to analyze the regional trends in air pollution and choose one typical megacity to explore its driving forces regarding air quality trends.
Fig. 1. The spatiotemporal characteristics of OMI-measured pollutant concentrations.
a–c Tropospheric mean VCDs during 2005–2017 for NO2, SO2, and HCHO, respectively. The regional boundaries of BTH, YRD, PRD and SCB are delineated by gray lines. d–f The corresponding annual mean VCDs for NO2, SO2, and HCHO, respectively. Note that the mean values for the four regions and China are shown by different colors
For the tropospheric NO2 column, the increases were estimated as 59.5, 26.7, and 45.2% for the BTH, YRD and SCB regions from 2005 to 2011, followed by significant decreases of 74.1, 45.1, and 33.2% during 2012–2017, respectively. In contrast to other regions, PRD showed a continuous decrease in the NO2 column at an annual rate of 2.1% since 2005. However, the OMI SO2 over most regions showed an overall decrease before the rising peak occurred around 2007, despite a relatively large interannual variation. The average annual concentrations of OMI SO2 decreased by 60.6%, 59.2%, 48.7%, and 69.2% in the BTH, YRD, PRD, and SCB in 2017, respectively, compared to levels in 2005. Unlike primary pollutants such as NO2 and SO2, the HCHO column over central and eastern China showed an overall increasing trend of 13.7–27.0%. Note that these percentage changes are well within the 95% confidence interval (P-value less than 0.05), which were calculated based on the annual concentration relative to the year 2005.
The marginal effect of individual meteorological variables on air pollutants
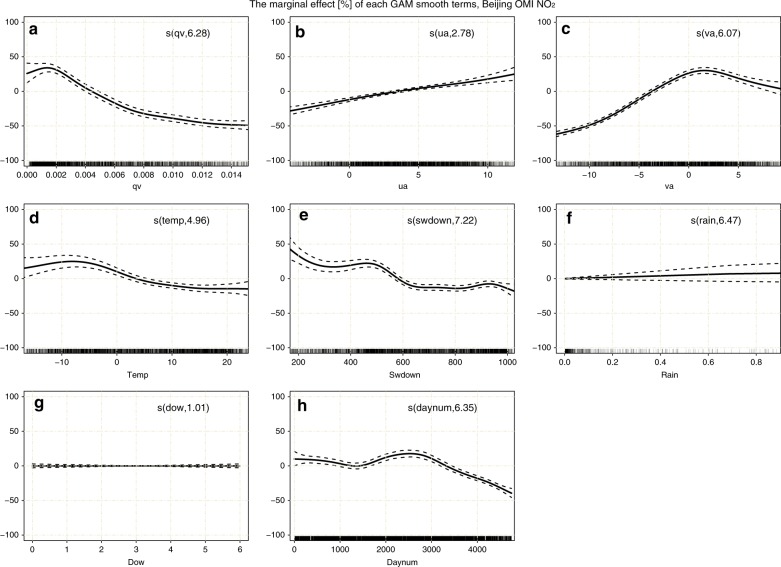
We selected four typical megacities, including Beijing, Shanghai, Guangzhou, and Chengdu (from BTH, YRD, PRD, and SCB, respectively), for the GAM analyses. The marginal effect of the smooth term S(Xi) in the GAMs is calculated as , representing the relative contribution of the individual term to the overall response while other covariates are assumed to remain constant. Figure 2 and Figs. S2–12 illustrate the marginal effect of individual meteorological and temporal covariates, i.e., the water vapor mixing ratio (qv), zonal wind (ua), meridional wind (va), temperature (temp), downward shortwave solar radiation (swdown), precipitation (rain), day number (daynum), and day of the week (dow), for different trace gases and cities, respectively. Note that for each panel in the plots, the estimated degrees of freedom (EDFs) corresponding to the smooth term are noted inside the bracket of the text. An EDF of 1 indicates a linear effect. See the model details in the Materials and Methods section.
Fig. 2. Plots of the marginal effects of individual covariates in the GAM on daily tropospheric NO2 in Beijing.
a–h Covariates of qv, ua, va, temp, swdown, rain, dow, and daynum are shown in the panels. The EDF for the GAM smooth term is noted inside the bracket of the text. Each marginal effect is denoted by a solid line with a 95% confidence interval (dashed lines), and the vertical lines adjacent to the lower x-axis represent the distributions of these covariates
The reaction of water vapor with O (1D) atoms is a major source of tropospheric OH radicals, especially in the lower troposphere, where qv is large2. Therefore, water vapor may affect most reactive atmospheric pollutants through OH oxidation. An overall inverse relationship of tropospheric NO2 or SO2 with qv was found for most cities, which was possibly due to the reaction of the OH radical with NOx or SO2. A positive relationship between HCHO and qv could possibly be related to secondary HCHO formation from the oxidation of VOCs4.
Local favorable wind conditions for air mass transport could have a determinant impact on air pollution levels. From the marginal effects in Beijing, we found that a southerly wind at a speed of 2 m s–1 could increase the tropospheric pollution level of NO2 by ~30%, that of SO2 by ~26%, and that of HCHO by ~4% compared to their overall means during 2005–2017 and that a northerly wind could effectively reduce air pollution levels by considerable amounts (see Figs. 3, S2–3). This finding is consistent with previous conclusions that a southerly wind aggravates haze pollution and that a northerly wind mitigates haze pollution28,29. Similar distinct positive correlations between a westerly wind and primary pollutants were also noticed in Shanghai (see Figs. S4–6). The wind effects indicated that the regional transport of pollutants plays an important role in the air quality of megacities. Compared to primary pollutants, the impact of wind speed on HCHO over these cities was much smaller. This could be explained by the short lifetime of tropospheric HCHO, which prevents the regional transport of its primary emissions30.
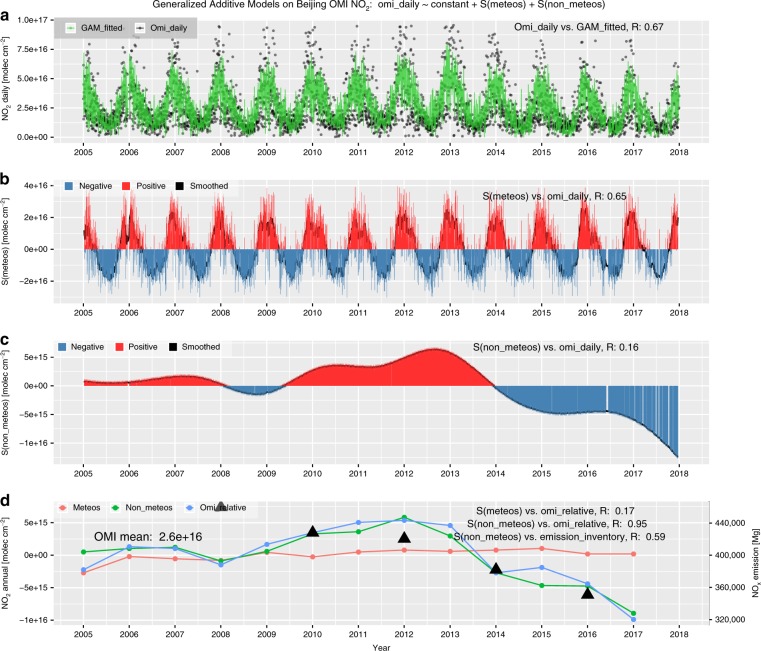
Fig. 3. Time series components by GAMs of the tropospheric NO2 column over Beijing.
a NO2 daily series of both OMI-measured and GAM-fitted data, as indicated by black dots and a green line, respectively. b The bar plot of the daily series of accumulated meteorological smooth terms, i.e., S(meteos), where positive and negative S(meteos) are indicated with red and blue, respectively, while the black solid line denotes the smoothed series using a moving average with a window of 15 days. c same as b but for the non-meteorological terms, i.e., S(non-meteos). d Interannual series of S(meteos), S(non-meteos), and relative NOx variation compared to the overall mean, as shown with red, green, and blue dotted lines, respectively, while the triangular dots denote the MEIC NOx emissions over Beijing, corresponding to the right y-axis
Furthermore, meteorological variables such as temp, swdown, and rain also play important roles in the formation, dispersion, and deposition of tropospheric pollutants1. The aggregated impacts of these variables could partially explain the seasonal variation in air pollutants, as seen by the marginal effect. Specifically, we found that there were almost no reductions in tropospheric NO2, SO2, and HCHO over these Chinese megacities during weekends, as seen by the marginal effect of dow. Such a weekly cycle was observed for developed countries such as the US and Japan31,32. The discrepancies may indicate the differences in the variation patterns of their major emissions.
Discussion
In addition to the marginal effects of particular covariates, the time series accumulations of meteorological and non-meteorological (i.e., temporal) smooth terms are compared for these megacities. Figure 3 presents comparisons of the accumulated daily or annual series of meteorological and non-meteorological smooth terms during GAM modeling on OMI NO2 in Beijing, as indicated by S(meteos) and S(non-meteos), respectively. Similar results were also shown for other gaseous pollutants over these four megacities in Figs. S13–21.
For OMI NO2 over these megacities, it was found that S(meteos) generally agreed well with the daily NO2 variations, with correlation coefficients (R) within 0.45–0.65. However, S(non-meteos) showed a lower frequency of variations and poor correlations with daily OMI NO2 (R = 0.16–0.29). Seasonally, S(meteos) varies between the maximum in winter and minimum in summer, which is consistent with the NO2 concentration. However, for interannual variability, S(non-meteos) generally coincides well with the measured OMI NO2 variations (R = 0.95–0.98), which is much better than S(meteos), with an R smaller than 0.17 (see Figs. 3, S13–15). In addition, the magnitudes of the interannual variations in S(non-meteos) are 2.93–3.94 times larger than those in S(meteos) for these megacities. These statistical findings indicated that synoptic meteorological conditions dominate the short-term scale variability in tropospheric NO2, especially for megacities, with stronger seasonality in the mid-high latitudes, while the long-term or interannual NO2 variations are dominated by non-meteorological causes. Similar regular patterns were also found for SO2 and HCHO.
Given that the S(non-meteos) components have already been largely isolated from the meteorological influences, we further examined the ability of S(non-meteos) as an indicator of the anthropogenic causes of the ambient concentrations of air pollutants. For NO2 in Beijing, an overall high correlation was found between S(non-meteos) and NOx emission inventory data from both bottom-up (R = 0.59, with the MEIC emission inventory33) and top-down (R = 0.72, with the OMI-derived emission inventory34; see Fig. S22) estimates. This suggests that S(non-meteos) could denote the variation in annual NOx emissions by penalized regression splines for temporal covariates during GAM NO2 modeling. For SO2 and HCHO in these megacities, S(non-meteos) also generally correlated well with the emission inventories (see Figs. S13–21). This indicated that S(non-meteos) can be used to present the influence of anthropogenic emissions to some extent. Due to the complicated chemical process of different HCHO species in the atmosphere, the correlation coefficients between S(non-meteos) and VOC emission amounts varied over a large range.
Based on these GAM results, we can conclude that the downward trend in tropospheric NO2 in Beijing during 2012–2017 could be largely explained by the NOx emission reductions due to the strict NOx emission controls in the industrial sector and on vehicles since the APPCAP was issued in 201333,35. Similar sharp decreases in NO2 S(non-meteos) were also found for Chengdu and Shanghai before the increase to its maximum in 2011 and 2012. However, a continuous reduction in NO2 S(non-meteos) occurred in Guangzhou in the PRD since 2007, indicating the effectiveness of stricter and earlier NOx emission controls during the 11th Five-Year-Plan (2006–2010) in Guangdong Province36. Overall, local and nationwide efforts such as the APPCAP and other air quality policies have achieved a considerable reduction in anthropogenic NOx emissions and therefore significantly improved air quality in these cities.
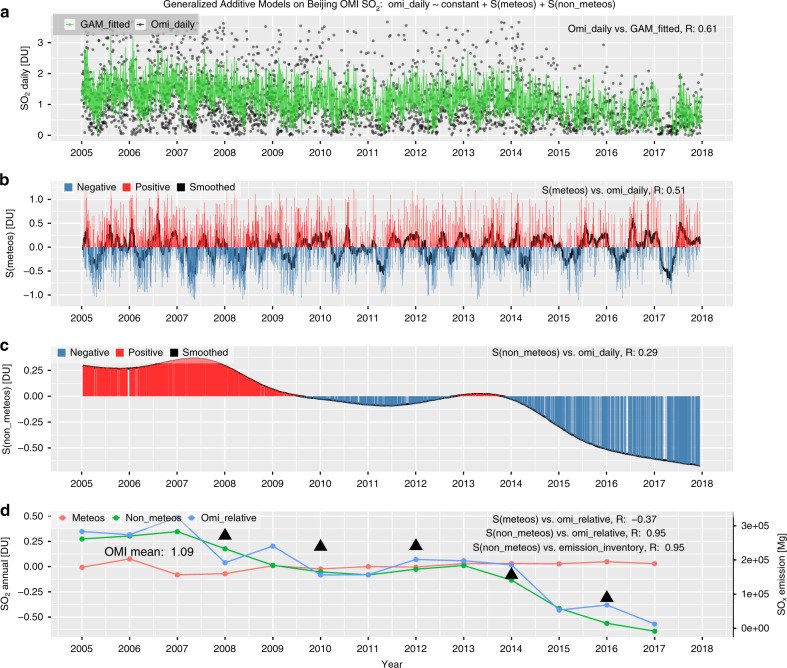
The sharp reductions in both OMI SO2 and S(non-meteos) over these cities were found during 2012–2017 (see Figs. 4, S16–18), which was possibly attributed to a combination of factors, such as the upgraded emission standards published during the 12th Five-Year Plan (2011–2015), deployment of flue gas de-sulfurization at coal-fired power plants, stricter emission controls during the APPCAP, and declines in coal consumption37,38. In addition, a smaller reduction during 2008–2010 was noticed for Beijing, Shanghai, and Guangzhou, which was possibly caused by the economic recession and local emission regulations for important events such as the Beijing 2008 Summer Olympics and the Expo 2010 in Shanghai, China.
Fig. 4. Similar to Fig. 3 but for tropospheric SO2 in Beijing.
a SO daily series of both OMI-measured and GAM-fitted data, as indicated by black dots and a green line, respectively. b The bar plot of the daily series of accumulated meteorological smooth terms, i.e., S(meteos), where positive and negative S(meteos) are indicated with red and blue, respectively, while the black solid line denotes the smoothed series using a moving average with a window of 15 days. c Same as b but for the non-meteorological terms, i.e., S(non-meteos). d Interannual series of S(meteos), S(non-meteos), and relative SO2 variation compared to the overall mean, as shown with red, green, and blue dotted lines, respectively, while the triangular dots denote the MEIC SO2 emissions over Beijing, corresponding to the right y-axis
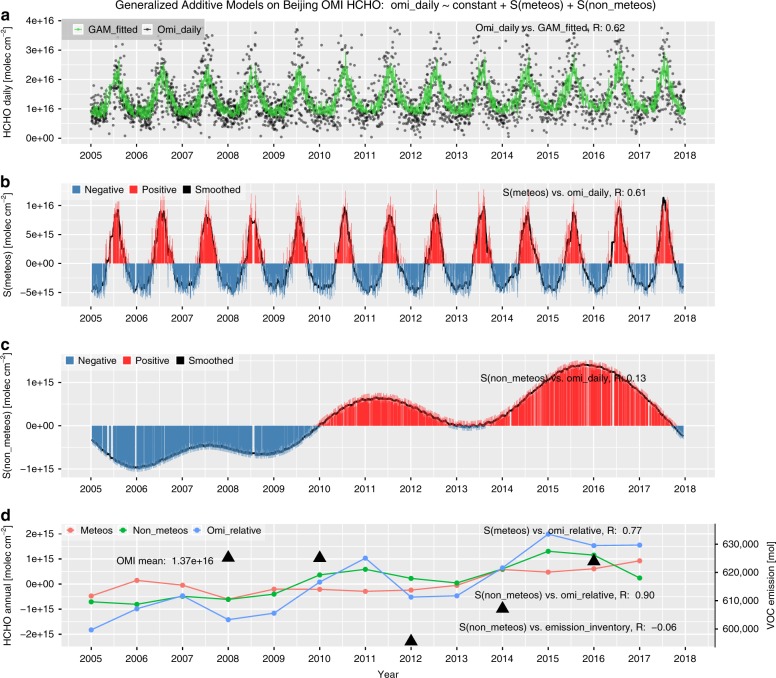
For HCHO, an overall increasing trend was found for these cities, especially during recent years since 2012 or 2013 (see Figs. 5, S19–21). In contrast to NO2 and SO2, which experienced sharp reductions recently, an unexpected HCHO increase was noted during 2013–2017 in Beijing. This could be explained by increases in interannual HCHO S(non-meteos) in the GAMs, which was also evidenced by the VOC emission inventory data33. This finding emphasises the vital role of VOC emission regulations when controlling HCHO pollution in these megacities.
Fig. 5. Similar to Fig. 3 but for tropospheric HCHO in Beijing.
a HCHO daily series of both OMI-measured and GAM-fitted data, as indicated by black dots and a green line, respectively. b The bar plot of the daily series of accumulated meteorological smooth terms, i.e., S(meteos), where positive and negative S(meteos) are indicated with red and blue, respectively, while the black solid line denotes the smoothed series using a moving average with a window of 15 days. c Same as b but for the non-meteorological terms, i.e., S(non-meteos). d Interannual series of S(meteos), S(non-meteos), and relative HCHO variation compared to the overall mean, as shown with red, green, and blue dotted lines, respectively, while the triangular dots denote the MEIC VOCs emissions over Beijing, corresponding to the right y-axis
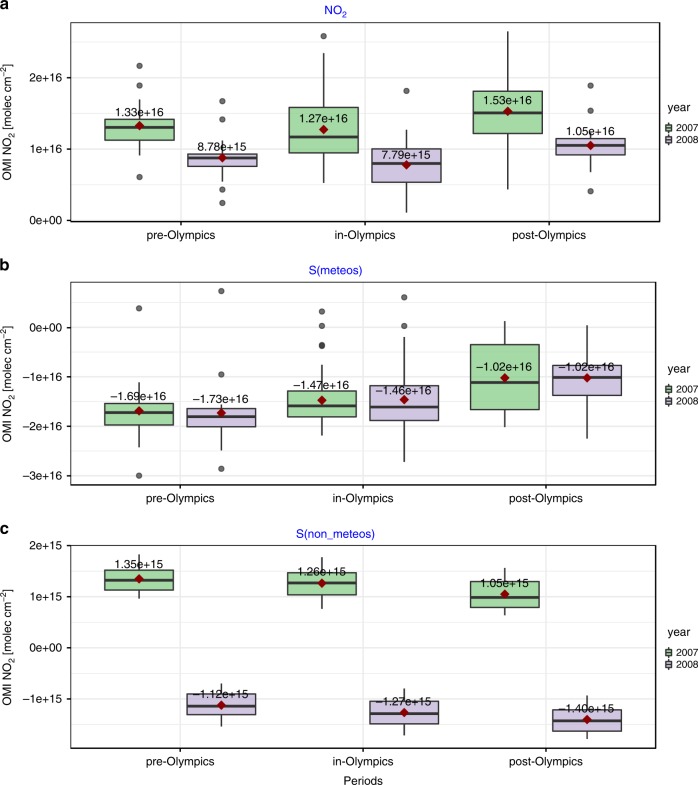
Apart from interpreting the long-term air quality trends, we also investigated the short-term impact of emissions change and synoptic meteorology on air quality changes. For example, we compared the measured concentrations, S(non-meteos) and S(meteos) of NO2 for the periods before, during, and after the Beijing 2008 Summer Olympics (see Fig. 6). The NO2 concentration significantly decreased compared with the same periods during the previous year, and such reductions could be largely attributed to the decrease in S(non-meteos), i.e., emission reductions due to regulations in the industrial and vehicle sectors. Compared to the same period in 2007, NO2 VCDs and S(non-meteos) during the Beijing Olympics decreased by 4.9 × 10¹⁵ and 2.5 × 10¹⁵ molecules cm–2 (with P-values of the two sample T-tests less than 0.05), respectively, while S(meteos) decreased by 0.1 × 10¹⁵ molecules cm–2 (with a P-value of 0.2). Similar reductions in S(non-meteos) for other trace gases and those for the Guangzhou 2010 Asian Games are shown in Figs. S23–27. We can conclude that emission reductions play a dominant role during air pollution, controlling air quality during these important events, despite unfavorable meteorological conditions.
Fig. 6. The box plots of period-averaged components of GAM NO2 modeling before, during, and after the Beijing Summer Olympics in 2008.
The GAM components, such as OMI NO2, S(meteos), and S(non-meteos), are presented in a, b, and c, respectively. Within each box plot, the lower and upper bounds correspond to the 25th and 75th quartiles, while the solid line represents the median; the top and bottom whiskers extend from the hinges to the largest values by no more than 1.5* IQR (interquartile range) from the hinges. The mean values are noted by red square points with numbers. The black points outside the whisker are outliers
In summary, the recent declines in primary pollutants such as NO2 and SO2 could be attributed to reductions in NOx and SO2 emissions due to the effective emission regulations and other air quality policies, especially after the APPCAP was implemented in 2013. In contrast to primary pollutants, the opposite trends in HCHO during recent years may encourage the need to control the anthropogenic emission sources of VOCs. Moreover, the variations in these important aerosol precursors significantly affected the temporal trends in fine particles (PM2.5). For example, a slight decrease in PM2.5 during 2006–2012 was indicated by satellite aerosol optical depth data and surface observations39,40 and was possibly caused by the onset of SO2 emissions control around 2007. The following sharp decrease in PM2.5 concentration during 2012–2017 could be possibly caused by the trend reversal in NO2 in 2011 and the effective emission reductions in other aerosol precursors, such as SO2 and NH3 (ammonia), due to the APPCAP41. This study provides novel insight into natural and human factors affecting air quality evolution over eastern China and will be further extended by satellite spectral measurements with higher spatial resolution from newly launched space-borne instruments, such as TROPOMI42 and EMI43.
Materials and methods
Satellite UV-Vis spectroscopy
The OMI is a nadir viewing push-broom spectrometer onboard NASA’s EOS Aura spacecraft in a low-earth polar orbit, measuring the entire solar spectrum from 270 to 540 nm at a moderate resolution of ~0.5 nm12. The OMI generally shows stable performance in radiometric and spectral calibrations since its launch in 2005, providing continuous spectroscopic measurements for Earth’s atmospheric components during its entire mission time26.
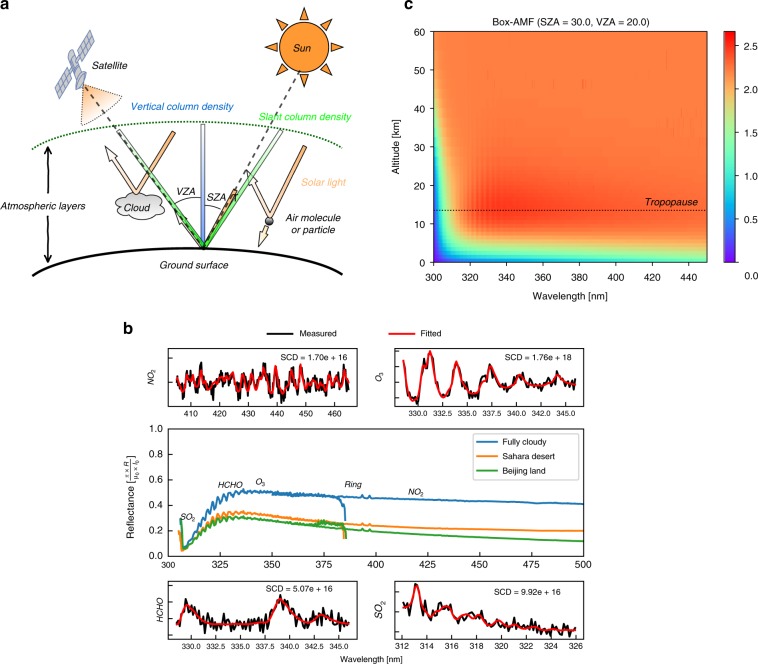
Figure 7a illustrates a typical observing geometry of a space-borne UV-Vis spectrometer that receives solar photons backscattered by air molecules or particles and reflected by surfaces and clouds. By numerically modeling the measured satellite spectra, information on the abundances of trace gases and particles and surface conditions can be effectively obtained. In the UV-Vis range, thermal emissions can be ignored, and the scattering of trace gases spectrally varies much slower than the absorption, as shown from the top-of-atmosphere reflectance spectra for different surface types in Fig. 7b. Therefore, the absorption of trace gases with high-frequency structures could be well distinguished in the observed spectra.
Fig. 7. Illustration of the satellite spectroscopy principle of trace gas retrieval.
a The viewing geometry of a typical satellite UV-Vis instrument and atmospheric radiation transfer processes, including absorption, reflection, and scattering. The definitions of the satellite solar zenith angle (SZA) and viewing zenith angle (VZA) and the slant column density (SCD) and vertical column density (VCD) of trace gases are noted. b An example of OMI-measured top-of-atmosphere reflectance in the UV2 and VIS1 channels is shown in the middle panel under different surface conditions, and the DOAS fitting of the SCDs of NO2, O3, HCHO and SO2 at different wavelength ranges are shown in four surrounding panels. c The altitude-resolved box AMF as a function of spectral wavelength. The tropopause height is denoted with a dotted line. The box AMF was calculated by the VLIDORT model for a satellite nadir viewing geometry of SZA = 30°; VZA = 20°; surface albedo of 0.075; and typical atmospheric profiles of pressure, temperature, O3 and NO2 from the U.S. Standard Atmosphere for mid-latitude summer
The atmospheric components can be retrieved from the satellite measurements in a simplified way by solving the Beer-Lambert’s law equation on radiative transfer. However, some inverse problems are usually ill-posed, which is mainly due to nonlinear effects from instrument calibration errors and the ring effect. Typically, several algorithms are developed to resolve these problems, including nonlinear least-square fitting, principal component analysis, optimal estimation (OE), and neural networks. Figure 7b gives an example of OMI spectral fitting of the slant column densities (SCDs) for NO2, HCHO, and SO2 using the state-of-the-art Differential Optical Absorption Spectroscopy (DOAS) technique44.
The absorption of the target trace gas in measured atmospheric radiation depends not only on the gas abundance but also on the average length of the path that a photon travels through in the atmosphere. Thus, numerical simulations by the atmospheric radiative transfer model (RTM) are needed to calculate the effective photon transfer path compared to a single vertical path, i.e., the so-called air mass factor (AMF), which converts the SCDs into vertical column densities (VCDs). The AMF is usually formulated by the integral of the vertical profile of the target gas weighted by altitude-dependent scattering weights. The uncertainty in AMF calculations is one of the dominant error sources for tropospheric trace gas retrievals45 (see the illustration of the SCD, VCD and altitude-dependent AMF in Fig. 7a, c). In addition, more realistic considerations in the radiative simulation of satellite-measured spectra, e.g., the ring effect, polarization and surface reflectance anisotropy, could effectively improve the accuracy and precision of trace gas retrievals, especially for weak absorbers such as SO2 and HCHO.
Description of trace gas retrieval
The tropospheric retrieval of NO2 and HCHO followed a two-step approach, in which the spectral fitting of SCDs and the AMF calculations with the RTM were separated44. For SO2, an OE method was implemented by iteratively minimizing the differences between the measured and simulated spectra and between the retrieved and a priori state vectors using the RTM as the forward model46,47. The main algorithm improvements include the use of local-updated a priori information from the regional chemical transport model, direct RTM calculations instead of interpolations by a look-up table, and optimized configuration parameters such as instrument slit functions and gas cross-sections48.
The algorithm details for the NO2, SO2, and HCHO retrievals are provided in the Supplementary Information. Note that the data used in this study were screened first by cloud fraction, retrieval error and related quality flags for each satellite ground pixel (see Supplementary Information). Compared with the operational OMI trace gas products, our trace gas retrievals showed improved consistencies with independent ground-based measurements from MAX-DOAS and LiDAR over eastern China49.
The GAMs
To further quantify the impact factors for air quality trends, a statistical fitting approach based on GAMs27 was implemented. GAMs make use of penalized smoothing splines, which address the complex non-linearity existing in air quality research. Meteorological variables were obtained from the NCEP FNL global meteorological dataset and then simulated at a horizontal resolution of ~20 km by using the WRF (Weather Research and Forecasting) model.
The GAM associated with daily series of pollutant concentrations can be written with the following equation:
where y is the daily pollutant concentration, β is the constant mean of the response, S(Xi) is the smoothing function term of the ith component of n total covariates, and ε is the fitting residual. Here, the covariates Xi included meteorological variables such as zonal wind (ua), meridional wind (va), water vapor mixing ratio (qv), downward shortwave solar radiation at the surface (swdown), precipitation (rain), and temperature (temp), as well as other temporal variables such as the day number (daynum) and day of the week (dow), to account for the short-term temporal persistence and control for temporal autocorrelation in the residuals. Note that ua, va, qv, and temp are selected at a pressure level of 850 hPa (~1.5 km altitude), representing the lower troposphere, which is where most air pollutants are located.
Supplementary information
Acknowledgements
This research was supported by grants from the National Natural Science Foundation of China (Nos. 41722501, 91544212, 51778596, 41575021, 41875043, and 41977184), the National Key Research and Development Program of China (Nos. 2018YFC0213104, 2017YFC0210002, and 2016YFC0203302), the Strategic Priority Research Program of the Chinese Academy of Sciences (No. XDA23020301), the National Key Project for Causes and Control of Heavy Air Pollution (Nos. DQGG0102 and DQGG0205), and the Major Projects of High Resolution Earth Observation Systems of National Science and Technology (05-Y30B01-9001-19/20-1).
Author's contributions
C.Z. performed the data analysis and wrote the paper. C.L. designed the experimental setup and supervised the research. Q.H. and C.Z. contributed to the interpretation and helped improve the paper. W.S., C.X., and Y.Z. contributed partially to the analysis of the satellite trace gas retrievals. S.W. and J.L. contributed to the writing of this paper.
Data availability
The OMI Level 1 data are available on NASA’s webpage at https://disc.gsfc.nasa.gov/datasets?source=Aura%20OMI&processingLevel=1B. Meteorological datasets are available from the NCEP FNL webpage at https://rda.ucar.edu/datasets/ds083.2/. The MEIC emission inventory data are available from http://www.meicmodel.org/. The OMI trace gas data used in this study can be requested from the corresponding author (chliu81@ustc.edu.cn).
Conflict of interest
The authors declare that they have no conflict of interest.
Footnotes
These authors contributed equally: Chengxin Zhang, Cheng Liu
Contributor Information
Cheng Liu, Email: chliu81@ustc.edu.cn.
Qihou Hu, Email: qhhu@aiofm.ac.cn.
Zhaonan Cai, Email: caizhaonan@mail.iap.ac.cn.
Supplementary information
Supplementary information is available for this paper at 10.1038/s41377-019-0210-6.
References
- 1.Seinfeld, J. H. & Pandis, S. N. Atmospheric Chemistry and Physics: from Air Pollution to Climate Change (John Wiley & Sons, Hoboken, 2016).
- 2.Atkinson R. Atmospheric chemistry of VOCs and NOx. Atmos. Environ. 2000;34:2063–2101. doi: 10.1016/S1352-2310(99)00460-4. [DOI] [Google Scholar]
- 3.Schroeder JR, et al. New insights into the column CH2O/NO2 ratio as an indicator of near-surface ozone sensitivity. J. Geophys. Res. 2017;122:8885–8907. [Google Scholar]
- 4.Wang C, et al. Sources and potential photochemical roles of formaldehyde in an urban atmosphere in South China. J. Geophys. Res. 2017;122:11934–11947. doi: 10.1002/2017jd027266. [DOI] [Google Scholar]
- 5.Huang RJ, et al. High secondary aerosol contribution to particulate pollution during haze events in China. Nature. 2014;514:218–222. doi: 10.1038/nature13774. [DOI] [PubMed] [Google Scholar]
- 6.Armante R, et al. Evaluation of spectroscopic databases through radiative transfer simulations compared to observations. Application to the validation of GEISA 2015 with IASI and TCCON. J. Mol. Spectrosc. 2016;327:180–192. doi: 10.1016/j.jms.2016.04.004. [DOI] [Google Scholar]
- 7.Gordon IE, et al. The HITRAN2016 molecular spectroscopic database. J. Quant. Spectrosc. Radiat. Transf. 2017;203:3–69. doi: 10.1016/j.jqsrt.2017.06.038. [DOI] [Google Scholar]
- 8.Zhu MW, et al. The impact of various HITRAN molecular spectroscopic databases on infrared radiative transfer simulation. J. Quant. Spectrosc. Radiat. Transf. 2019;234:55–63. doi: 10.1016/j.jqsrt.2019.04.031. [DOI] [Google Scholar]
- 9.Chance K, Kurucz RL. An improved high-resolution solar reference spectrum for earth’s atmosphere measurements in the ultraviolet, visible, and near infrared. J. Quant. Spectrosc. Radiat. Transf. 2010;111:1289–1295. doi: 10.1016/j.jqsrt.2010.01.036. [DOI] [Google Scholar]
- 10.Burrows JP, et al. The global ozone monitoring experiment (GOME): mission concept and first scientific results. J. Atmos. Sci. 1999;56:151–175. doi: 10.1175/1520-0469(1999)056<0151:TGOMEG>2.0.CO;2. [DOI] [Google Scholar]
- 11.Bovensmann H, et al. SCIAMACHY: mission objectives and measurement modes. J. Atmos. Sci. 1999;56:127–150. doi: 10.1175/1520-0469(1999)056<0127:SMOAMM>2.0.CO;2. [DOI] [Google Scholar]
- 12.Levelt PF, et al. The ozone monitoring instrument. IEEE Trans. Geosci. Remote Sens. 2006;44:1093–1101. doi: 10.1109/TGRS.2006.872333. [DOI] [Google Scholar]
- 13.Callies J, et al. GOME-2-Metop’s second-generation sensor for operational ozone monitoring. ESA Bull. 2000;102:28–36. [Google Scholar]
- 14.Munro, R. et al. GOME-2 on MetOp. In Proceedings of the 2006 EUMETSAT Meteorological Satellite Conference. (Helsinki, Finland, 2006).
- 15.Abad, G. G. et al. Five decades observing Earth’s atmospheric trace gases using ultraviolet and visible backscatter solar radiation from space. J. Quant. Spectr. Radiat. Transfer (in press), 10.1016/j.jqsrt.2019.04.030.
- 16.Chen SF, et al. Inter-annual variation of the spring haze pollution over the North China Plain: roles of atmospheric circulation and sea surface temperature. Int. J. Climatol. 2019;39:783–798. doi: 10.1002/joc.5842. [DOI] [Google Scholar]
- 17.Li ZQ, et al. Aerosol and boundary-layer interactions and impact on air quality. Natl Sci. Rev. 2017;4:810–833. doi: 10.1093/nsr/nwx117. [DOI] [Google Scholar]
- 18.Li J, Li CC, Zhao CS. Different trends in extreme and median surface aerosol extinction coefficients over China inferred from quality-controlled visibility data. Atmos. Chem. Phys. 2018;18:3289–3298. doi: 10.5194/acp-18-3289-2018. [DOI] [Google Scholar]
- 19.Zhong JT, et al. Feedback effects of boundary-layer meteorological factors on cumulative explosive growth of PM2.5 during winter heavy pollution episodes in Beijing from 2013 to 2016. Atmos. Chem. Phys. 2018;18:247–258. doi: 10.5194/acp-18-247-2018. [DOI] [Google Scholar]
- 20.Huang Q, et al. Impacts of emission reduction and meteorological conditions on air quality improvement during the 2014 Youth Olympic Games in Nanjing, China. Atmos. Chem. Phys. 2017;17:13457–13471. doi: 10.5194/acp-17-13457-2017. [DOI] [Google Scholar]
- 21.Liang PF, et al. The role of meteorological conditions and pollution control strategies in reducing air pollution in Beijing during APEC 2014 and Victory Parade 2015. Atmos. Chem. Phys. 2017;17:13921–13940. doi: 10.5194/acp-17-13921-2017. [DOI] [Google Scholar]
- 22.Xu W, et al. Air quality improvement in a megacity: implications from 2015 Beijing Parade Blue pollution control actions. Atmos. Chem. Phys. 2017;17:31–46. doi: 10.5194/acp-17-31-2017. [DOI] [Google Scholar]
- 23.Huang J, et al. Health impact of China’s air pollution prevention and control action plan: an analysis of national air quality monitoring and mortality data. Lancet Planet. Health. 2018;2:e313–e323. doi: 10.1016/S2542-5196(18)30141-4. [DOI] [PubMed] [Google Scholar]
- 24.Van Der A, et al. Cleaning up the air: effectiveness of air quality policy for SO2 and NOx emissions in China. Atmos. Chem. Phys. 2017;17:1775–1789. doi: 10.5194/acp-17-1775-2017. [DOI] [Google Scholar]
- 25.De Foy B, Lu ZF, Streets DG. Satellite NO2 retrievals suggest China has exceeded its NOx reduction goals from the twelfth Five-Year Plan. Sci. Rep. 2016;6:35912. doi: 10.1038/srep35912. [DOI] [PMC free article] [PubMed] [Google Scholar]
- 26.Schenkeveld VME, et al. In-flight performance of the ozone monitoring instrument. Atmos. Meas. Tech. 2017;10:1957–1986. doi: 10.5194/amt-10-1957-2017. [DOI] [PMC free article] [PubMed] [Google Scholar]
- 27.Wood SN. Stable and efficient multiple smoothing parameter estimation for generalized additive models. J. Am. Stat. Assoc. 2004;99:673–686. doi: 10.1198/016214504000000980. [DOI] [Google Scholar]
- 28.Zheng GJ, et al. Exploring the severe winter haze in Beijing: the impact of synoptic weather, regional transport and heterogeneous reactions. Atmos. Chem. Phys. 2015;15:2969–2983. doi: 10.5194/acp-15-2969-2015. [DOI] [Google Scholar]
- 29.An ZS, et al. Severe haze in northern China: a synergy of anthropogenic emissions and atmospheric processes. Proc. Natl Acad. Sci. USA. 2019;116:8657–8666. doi: 10.1073/pnas.1900125116. [DOI] [PMC free article] [PubMed] [Google Scholar]
- 30.Anderson DC, et al. Formaldehyde in the tropical western Pacific: chemical sources and sinks, convective transport, and representation in CAM-Chem and the CCMI models. J. Geophys. Res. 2017;122:11201–11226. doi: 10.1002/2017JA024474. [DOI] [PMC free article] [PubMed] [Google Scholar]
- 31.Kanaya Y, et al. Long-term MAX-DOAS network observations of NO2 in Russia and Asia (MADRAS) during the period 2007–2012: instrumentation, elucidation of climatology, and comparisons with OMI satellite observations and global model simulations. Atmos. Chem. Phys. 2014;14:7909–7927. doi: 10.5194/acp-14-7909-2014. [DOI] [Google Scholar]
- 32.Russell AR, Valin LC, Cohen RC. Trends in OMI NO2 observations over the United States: effects of emission control technology and the economic recession. Atmos. Chem. Phys. 2012;12:12197–12209. doi: 10.5194/acp-12-12197-2012. [DOI] [Google Scholar]
- 33.Zheng B, et al. Trends in China’s anthropogenic emissions since 2010 as the consequence of clean air actions. Atmos. Chem. Phys. 2018;18:14095–14111. doi: 10.5194/acp-18-14095-2018. [DOI] [Google Scholar]
- 34.Ding JY, et al. Intercomparison of NOx emission inventories over East Asia. Atmos. Chem. Phys. 2017;17:10125–10141. doi: 10.5194/acp-17-10125-2017. [DOI] [Google Scholar]
- 35.Liu F, et al. Recent reduction in NOx emissions over China: synthesis of satellite observations and emission inventories. Environ. Res. Lett. 2016;11:114002. doi: 10.1088/1748-9326/11/11/114002. [DOI] [Google Scholar]
- 36.Zhong LJ, et al. Science-policy interplay: Air quality management in the Pearl River Delta region and Hong Kong. Atmos. Environ. 2013;76:3–10. doi: 10.1016/j.atmosenv.2013.03.012. [DOI] [Google Scholar]
- 37.Ling ZL, et al. OMI-measured increasing SO2 emissions due to energy industry expansion and relocation in northwestern China. Atmos. Chem. Phys. 2017;17:9115–9131. doi: 10.5194/acp-17-9115-2017. [DOI] [Google Scholar]
- 38.Wang T, et al. Spatial and temporal changes in SO2 regimes over China in the recent decade and the driving mechanism. Atmos. Chem. Phys. 2018;18:18063–18078. doi: 10.5194/acp-18-18063-2018. [DOI] [Google Scholar]
- 39.Bai KX, et al. Spatiotemporal trend analysis for fine particulate matter concentrations in China using high-resolution satellite-derived and ground-measured PM2.5 data. J. Environ. Manag. 2019;233:530–542. doi: 10.1016/j.jenvman.2018.12.071. [DOI] [PubMed] [Google Scholar]
- 40.Tao J, et al. A review of current knowledge concerning PM2.5 chemical composition, aerosol optical properties and their relationships across China. Atmos. Chem. Phys. 2017;17:9485–9518. doi: 10.5194/acp-17-9485-2017. [DOI] [Google Scholar]
- 41.Zhai SX, et al. Fine particulate matter (PM2.5) trends in China, 2013–2018: separating contributions from anthropogenic emissions and meteorology. Atmos. Chem. Phys. 2019;19:11031–11041. doi: 10.5194/acp-19-11031-2019. [DOI] [Google Scholar]
- 42.Veefkind JP, et al. TROPOMI on the ESA Sentinel-5 Precursor: a GMES mission for global observations of the atmospheric composition for climate, air quality and ozone layer applications. Remote Sens. Environ. 2012;120:70–83. doi: 10.1016/j.rse.2011.09.027. [DOI] [Google Scholar]
- 43.Zhang CX, et al. Preflight evaluation of the performance of the Chinese environmental trace gas monitoring instrument (EMI) by spectral analyses of nitrogen dioxide. IEEE Trans. Geosci. Remote Sens. 2018;56:3323–3332. doi: 10.1109/TGRS.2018.2798038. [DOI] [Google Scholar]
- 44.Platt U, Stutz J, Platt U, Stutz J. Spectroscopy. Berlin, Heidelberg: Springer; 2008. Differential absorption spectroscopy. In Differential Optical Absorption; pp. 135–174. [Google Scholar]
- 45.Lorente A, et al. Structural uncertainty in air mass factor calculation for NO2 and HCHO satellite retrievals. Atmos. Meas. Tech. 2017;10:759–782. doi: 10.5194/amt-10-759-2017. [DOI] [Google Scholar]
- 46.Liu X, et al. Ozone profile retrievals from the ozone monitoring instrument. Atmos. Chem. Phys. 2010;10:2521–2537. doi: 10.5194/acp-10-2521-2010. [DOI] [Google Scholar]
- 47.Nowlan CR, et al. Retrievals of sulfur dioxide from the Global Ozone Monitoring Experiment 2 (GOME-2) using an optimal estimation approach: algorithm and initial validation. J. Geophys. Res. 2011;116:D18301. doi: 10.1029/2011JD015808. [DOI] [Google Scholar]
- 48.Liu C, et al. Characterization and verification of ACAM slit functions for trace-gas retrievals during the 2011 DISCOVER-AQ flight campaign. Atmos. Meas. Tech. 2015;8:751–759. doi: 10.5194/amt-8-751-2015. [DOI] [Google Scholar]
- 49.Tan W, et al. Tropospheric NO2, SO2, and HCHO over the East China Sea, using ship-based MAX-DOAS observations and comparison with OMI and OMPS satellite data. Atmos. Chem. Phys. 2018;18:15387–15402. doi: 10.5194/acp-18-15387-2018. [DOI] [Google Scholar]
Associated Data
This section collects any data citations, data availability statements, or supplementary materials included in this article.
Supplementary Materials
Data Availability Statement
The OMI Level 1 data are available on NASA’s webpage at https://disc.gsfc.nasa.gov/datasets?source=Aura%20OMI&processingLevel=1B. Meteorological datasets are available from the NCEP FNL webpage at https://rda.ucar.edu/datasets/ds083.2/. The MEIC emission inventory data are available from http://www.meicmodel.org/. The OMI trace gas data used in this study can be requested from the corresponding author (chliu81@ustc.edu.cn).


