

Abstract
Macrophysiological analyses are useful to predict current and future range limits and improve our understanding of endotherm macroecology, but such analyses too often rely on oversimplifications of endothermic thermoregulatory and energetic physiology, which lessens their applicability. We detail some of the major issues with macrophysiological analyses based on the classic Scholander–Irving model of endotherm energetics in the hope that it will encourage other research teams to more appropriately integrate physiology into macroecological analyses.
In light of the rapidly changing climate, there is an urgent need to develop a mechanistic understanding of how physiological functioning mediates ecological patterns. Recently, there has been a spate of papers using analyses that scale up from a standard physiological model, the Scholander–Irving model, to make predictions about range constraints on endothermic vertebrates (Buckley, Khaliq, Swanson, & Hof, 2018; Fristoe et al., 2015; Khaliq, Böhning‐Gaese, Prinzinger, Pfenninger, & Hof, 2017; Khaliq, Hof, Prinzinger, Böhning‐Gaese, & Pfenninger, 2014). Here, we argue that oversimplifications of the Scholander–Irving model and the use of questionable datasets lead to questionable macrophysiological analyses. Many of these problems have been addressed elsewhere, directly and indirectly (e.g., McKechnie, Coe, Gerson, & Wolf, 2017; Mitchell et al., 2018), although the focus has largely been on the applicability of the Scholander–Irving model to warm environmental temperatures, which are often seen as more relevant to climate change. However, one specific aspect of the Scholander–Irving model, the assumption that energy expenditure of an endotherm below the thermoneutral zone (TNZ) can be described by basic Newtonian physics, has been used incorrectly in several papers. While not the only paper based on this assumption, the recent work by Buckley et al. (2018) reinvigorated discussions among physiologists about improper interpretations of the Scholander–Irving model. Our concerns are not new and have been voiced repeatedly in the past (Calder & Schmidt‐Nielsen, 1967; King, 1964; Tracy, 1972), but many of these ideas seem to have been buried by time. Our goal here is to bring these concerns back to the forefront in the context of modern large‐scale macrophysiological analyses, using the work of Buckley et al. (2018) as an example where relevant. We detail these ideas below, but King (1964) provided a scathing, yet technically accurate summary of our position over five decades ago: “The convenience of the Newtonian model as a heuristic or pedagogical device is readily apparent; but its use as an analytical instrument to reveal relatively small interspecific or seasonal adaptations in metabolism is a practice which is beset by many uncertainties, and which occasionally appears to encourage a Procrustean fitting of data.”
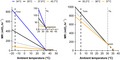
In practice, endothermic vertebrates pose significant challenges in large‐scale ecological analyses because the relationship between environmental conditions and functional energetics is mediated by complex metabolic and thermoregulatory control (Levesque, Nowack, & Stawski, 2016). At the heart of the issue is the reliance on the Scholander–Irving model (Scholander, Hock, Walters, Johnson, & Irving, 1950), a classic descriptive model of the relationship between ambient temperature and metabolic rate in strict homeotherms (i.e., species that maintain their body temperature within a somewhat narrow, although undefined range). Under this model, homeothermic endotherms are assumed to maintain a constant basal metabolic rate within the TNZ, a constant body temperature (T b), and a constant thermal conductance. At ambient temperatures below the lower critical temperature (T lc, the lower boundary of the TNZ), metabolic rate increases to compensate for increased heat loss and to maintain constant T b. Importantly, these relationships vary with many factors, including season, so values measured during summer are inappropriate for analyses of cold tolerance during winter. While the Scholander–Irving model is important for descriptive analyses of energetic function in homeothermic endotherms, its direct application to modeling environmental temperature thresholds for most endotherms is questionable (Levesque et al., 2016; Mitchell et al., 2018; Porter & Kearney, 2009). To generalize across large geographic scales, many analyses of endothermic energetics rely on a series of simplifying—and often unjustified—assumptions (reviewed by Mitchell et al., 2018). These simplifying assumptions are common, but an overreliance on them has inhibited a mechanistic understanding of global patterns in endothermic physiology. Relevant to the current discussion, the Scholander–Irving model predicts that a regression describing the relationship between metabolic rate and ambient temperatures below the T lc extrapolates to an ambient temperature equal to T b, if metabolic heat production was to reach zero (Scholander et al., 1950). This idea essentially requires that heat balance in endotherms follows Newton's laws of cooling, which may be a reasonable simplification in a small number of homeothermic species (usually mammals, but not birds), but is clearly not universal (King, 1964; McNab, 1979). There are numerous problems, both biological and computational, with this approach. First, a line fit through metabolic rate data rarely predicts T b accurately, often overestimating it by as much as 10°C (Calder & Schmidt‐Nielsen, 1967; McNab, 1979). As a simple example, we calculated T b using the relationship between metabolic rate and T lc for the rock pocket mouse (Chaetodipus intermedius), one of the species included in Buckley et al. (2018). In the source paper (Bradley, Yousef, & Scott, 1975), T b is estimated at ~35°C and metabolic data are provided for two periods: January and April. By extrapolating the metabolic rate line to zero on the y‐axis, T b is estimated at 37.9°C in January and 45.7°C in April (Figure 1). Clearly, the April value is unrealistic for a mammal. The inverse assumption that T b can be used to predict metabolic rate is also problematic. For example, a difference in estimate of only 1°C (the black line vs. the gray line on the left panel of Figure 1) for the T b of the four‐toed hedgehog (Atelerix albiventris) would lead to a difference in the metabolic rate at the cold range boundary (MRCRB) described by Buckley et al. (2018) of ~12%.
Figure 1.
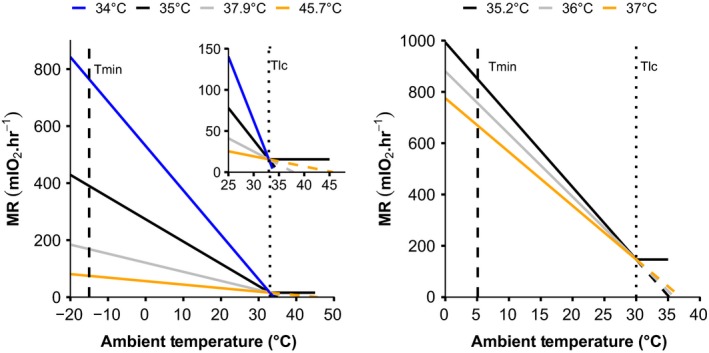
Demonstration of the inherent limitations of using body temperature (T b) and the lower critical temperature (T lc) of the thermal neutral zone to calculate thermal conductance (C) when T b and T lc are poorly defined. Buckley et al. (2018) analyzed metabolic expansibility, which is the metabolic rate at the range boundary (MRRB) divided by basal metabolic rate (BMR). MRRB, and therefore ME, changes drastically depending on assumptions of T b and T lc used to calculate C. Data are for a rock mouse (Chaetodipus intermedius, left; Bradley et al., 1975) and a hedgehog (Atelerix albiventris, right; McNab, 1980). In each case, black lines represent the T b value used by Buckley et al and the various other lines represent plausible assumptions about T b, assuming T lc is constant. Dashed lines represent the extrapolation of T b from the MR line assuming the animal is perfectly following Newton's Laws of Cooling. The inset in (a) is an expanded view encapsulating the T lc and T b of the rock mouse
The Scholander–Irving model was groundbreaking in 1950 and has proven to be useful in shaping our basic understanding of endothermic thermoregulation (Somero, 2013). However, this model requires that (a) thermal conductance below the TNZ is constant, (b) that endotherms maintain a relatively constant T b, and (c) that T lc can be estimated at a single value. The idea of a constant thermal conductance has long been discounted (Tracy, 1972) and has repeatedly been shown to be unrealistic (e.g., Calder & Schmidt‐Nielsen, 1967; Noakes, Smit, Wolf, & McKechnie, 2013). Large‐scale analyses assuming Newtonian cooling are on shaky theoretical footing if the assumption of constant thermal conductance is violated (King, 1964). Scholander et al. (1950) also assume that most mammals maintain T b within ±1°C. While the data are not strictly analogous, such homeothermy likely occurs in <30% of mammals with quality T b data collected during winter (Boyles et al., 2013). Even strictly homeothermic humans show a decrease of ~1°C during sleep (Wright, Badia, Myers, Plenzler, & Hakel, 1997) and T b of marsupials and monotremes can be lowered by >8°C during normothermic resting. Further, describing endothermic T b is surprisingly difficult, and the most commonly used metric, mean T b, is usually a poor descriptor of regulated endothermic T b (Boyles, 2019; Hetem, Maloney, Fuller, & Mitchell, 2016). Finally, T lc is often difficult to delineate at a single temperature using standard respirometry techniques, because no clear “breakpoint” in metabolic rate exists for many species (McNab, 1995), and T lc may change seasonally (Kobbe, Nowack, & Dausmann, 2014). Even ignoring these theoretical concerns, extreme care must be taken in extrapolating from such variable and hard‐to‐describe values.
If one begins with the assumption the Scholander–Irving model is static and easily fit for all endotherms, data quality issues are nearly inevitable. Here, we use the dataset of Buckley et al. (2018) as an example to demonstrate how poor assumptions can be manifested in poor data quality. Specifically, we traced T b and T lc data for a subset of their dataset back to the original sources. As with previous critiques of the upper critical temperature in similar datasets (McKechnie et al., 2017), we found considerable variability in the quality of the data used (Table 1). For example, many of the values presented were simply one value within the range of T b or T lc listed in the paper, but there was little consistency in how the value was chosen. This error stems from the assumption that endotherms maintain single, constant T bs. Likewise, many older papers calculated T lc by eyeballing lines through metabolic data and estimating the intersection with basal metabolic rate. Therefore, the values are approximations (in many cases, they are different than what we would estimate from the same data). This error stems from the assumption of a single, unchanging T lc. Two of us (JGB and DLL) independently judged the quality of the T b and T lc included in the first 20 mammal species included by Buckley et al. (2018) (excluding species with partial data and including only one species from a genus; Table 1). Of those 20 datasets, we classified five as appropriate for inclusion in the analysis (i.e., data generally followed the Scholander–Irving model, and T b variation was relatively low). Note that even among these “appropriate” datasets, data for three of these five species were collected on zoo animals and may therefore not represent wild animals. We classified nine as marginal or questionable for inclusion in the dataset (i.e., T b varied by 3°C or T lc was difficult to determine). Ultimately, we classified six as inappropriate for inclusion (i.e., there were clear violations of the Scholander–Irving model or the citation was incorrect and impossible to track). Importantly, authors of several of the original papers commented that either T b or T lc was difficult or impossible to establish for several of these species (e.g., Arctictis binturong, McNab, 1995). Such datasets are too often compiled by ignoring biologically important variation and shoehorning incompatible data into a highly conceptualized model (King, 1964).
Table 1.
Evaluation of data quality of the first 20 mammal species included in the analysis of Buckley et al. (2018)
| Species | T b | T lc | Original source | Comments | n | Wild/Zoo/Lab | Data quality |
|---|---|---|---|---|---|---|---|
| Abrothrix andinus | 39.3 | 26.8 | Bozinovic and Rosenmann (1988) | T b calculated working backwards estimates of MR. Actual measured T b differs (and has a range) | 8 | Wild | Questionable |
| Ailurus fulgens | 37.6 | 25 | McNab (1988) | McNab argues that they do not follow standard homeotherm energetics; Scholander‐Irving (S‐I) model likely a bad model for this species | 2 | Zoo | Questionable |
| Akodon azarae | 37.7 | 30 | Dalby and Heath (1976) | T b continues to drop with T a, suggesting the S‐I model might be inappropriate | 8 | Lab | Questionable |
| Ammospermophilus leucurus | 37.2 | 31 | Dawson (1955) | T b used was measured at T a below T lc presented; Range was 35.6–38.1°C, and taken during active period instead of the inactive period; animals were excitable and did not cope well with captivity | 12 | Wild | Questionable |
| Anoura caudifer | 36.3 | 26 | McNab (1969) | T b in fig. 10 range from roughly 33 to 42°C with c.v. of 4.0% around the mean. T lc was not referenced in the original paper, probably estimated from fig. 10. | Unknown | Wild | Questionable |
| Aplodontia rufa | 38 | 26.5 | McNab (1979) | Appears to follow the S‐I model. There is some minor variation in T b | 3 | Wild | Good |
| Apodemus mystacinus | 38.3 | 28 | Haim, Rubal, and Harari (1993) | Appears to follow the S‐I model. Relatively low variation in T b | 6 | Wild | Good |
| Arctictis binturong | 36 | 27 | McNab (1995) | McNab argues the core temperature is variable (~32–41°C) and decreases with ambient temperature ; McNab also says “the zone of thermoneutrality…was especially difficult to define” | 2 | Zoo | Questionable |
| Arctogalidia trivirgata | 36.2 | 19 | McNab (1995) | The S‐I model is inappropriate for this species and T lc is impossible to define with the presented data. McNab says “the variability in rate of metabolism made the zone of thermoneutrality difficult to define with clarity” | 4 | Zoo | Poor |
| Artibeus concolor | 35 | 29 | McNab (1969) | Paper lists T b of 35.3°C with a c.v. of 4.1%. No reference to T lc, so probably estimated from fig. 17, and we would estimate it lower (probably about 28°C). | ? | Wild | Questionable |
| Atelerix albiventris | 35.2 | 30 | McNab (1980) | S‐I model is probably appropriate, given the data presented herein | 2 | Zoo | Good |
| Baiomys taylori | 36 | 29 | Hudson (1965) | Original paper gives a wide range for T b (32–36°C) and mentions T lc at 29°C in the summary and 30–33°C in the text (but does not define how it was measured) | 10 | Lab | Poor |
| Blarina brevicauda | 38 | 25 | Neal and Lustick (1973) | Thermoneutral zone analyzed as the range within 95% confidence intervals, but the authors say metabolic rate increases below 30°C. T b measured in separate experiments | 12 | Wild | Questionable |
| Cabassous centralis | 33.6 | 27.5 | McNab (1980) | S‐I model is probably appropriate, given the data presented herein | 3 | Zoo | Good |
| Caluromys derbianus | 34 | 26.36 | McNab (1978) | Data were presented for 1 wild animal and 3 larger animals from a zoo. T b is from the zoo animals (wild individual was 36°C). T lc is given as a value somewhere between the zoo and wild individuals and is not mentioned in the paper | 4 | Wild/Zoo | Poor |
| Canis latrans | 36 | 22 | Golightly and Ohmart (1983) | T b is difficult to determine in the original paper. Data come from a desert population. The original authors mention that animals near the northern edge of the range (which is far more relevant in the current study) have T lc of −10°C (Shield, 2009) | 3 | Wild | Poor |
| Cannomys badius | 36 | 26.74 | McNab (1979) | Original paper lists T lc at 27°C. Otherwise, S‐I model is probably appropriate, given the data presented herein | 5 | Zoo | Good |
| Carollia perspicillata | 36.6 | 29 | McNab (1969) | Paper lists T b of 36.4°C with a c.v. of 2.8%. T lc probably estimated from fig. 11 and we would estimate it lower (probably about 28°C from fig. 11) | Unknown | Wild | Questionable |
| Cercartetus nanus | 34.9 | 31 | Unknown | The citation given is incorrect, and we were unable to track the values back to a paper on this species | Unknown | Unknown | Poor |
| Cercopithecus mitis | 37 | 5 | Müller, Kamau, and Maloiy (1983) | T b given as 36–38.5°C in the original paper, but otherwise unclear where the presented value comes from; one individual maintained T b of around 37°C during the active period; 5°C is given as the approximate T lc. 5°C was the lowest T a measured, so it is impossible to determine T lc | 2 | Zoo | Poor |
Finally, even if one accepts the assumptions of constant T b, thermal conductance, and T lc, there are analytical concerns with using these values to make predictions of organismal responses to conditions far beyond the measured values. For example, one could use these values to estimate energetic expenditure at temperatures below the range empirically measured or to estimate range boundaries (Buckley et al., 2018; Root, 1988). However, such extrapolations are highly sensitive to data quality because they often extend far beyond the range of empirically measured data. Such extrapolations mean that small errors in estimating T b or T lc (which we reiterate are very hard to estimate and rarely a single value) can lead to large errors in the estimated metabolic rates at cold temperatures. Again, we return to the dataset of Buckley et al. (2018) to demonstrate the scope of the possible error in extrapolating far beyond the known data. In some species, the metabolic rate at the range boundary (MRRB) may vary by an order of magnitude depending on the chosen T b value (Figure 1). At the extreme, a 1°C change in the T b value chosen for these extrapolations can lead to differences of over 400% in calculated metabolic expansibility values for some species (although the median difference for all mammals included in the Buckley et al. dataset is 10%). Unfortunately, it is difficult to predict how these errors will be manifested in the interpretations of data. On one hand, we might predict that errors will be largest in high latitude species because the minimum environmental temperature is far below T lc (i.e., the extrapolation is more extreme). On the other hand, the calculated thermal conductance value varies strongly when T lc and T b are close together, which is most likely to occur in tropical and subtropical species. The results of these analyses often seem to corroborate previous analyses using similar methodologies, but as King (1964) and others have recognized, oversimplifying assumptions of the Scholander–Irving model might result in overly simplified and generic results.
Although we strongly encourage the continued integration of physiological ecology and macroecology, we contend that oversimplification of physiological principles can lead to unreliable analyses. In addition, data quality is of utmost important in these analyses, especially in cases where analyses are highly sensitive to variance in input variables. Understanding the thermophysiology of endotherms relies on recognizing a number of caveats which have unfortunately not been widely adopted by nonspecialists (Mitchell et al., 2018). While we recognize the importance of broader macroscale analyses, such studies would benefit from closer collaborations between macroecologists and physiological ecologists as each could help the other better understand the hidden nuances in their respective analyses and move toward a more comprehensive understanding of global patterns.
CONFLICT OF INTEREST
None declared.
AUTHOR CONTRIBUTIONS
JGB and DLL conducted the literature review and analyses. All authors contributed to writing the manuscript.
ACKNOWLEDGMENTS
We thank many unnamed colleagues for discussing the ideas in this commentary and focusing our argument. After JGB and DLL, author order was determined by world football rankings.
DATA AVAILABILITY STATEMENT
No original data were collected for this paper. Data used in the analysis can be found associated with Buckley et al. (2018).
REFERENCES
- Boyles, J. G. (2019). A brief introduction to methods for describing body temperature in endotherms. Physiological and Biochemical Zoology, 92, 365–372. 10.1086/703420 [DOI] [PubMed] [Google Scholar]
- Boyles, J. G. , Thompson, A. B. , McKechnie, A. E. , Malan, E. , Humphries, M. M. , & Careau, V. (2013). A global heterothermic continuum in mammals. Global Ecology and Biogeography, 22, 1029–1039. 10.1111/geb.12077 [DOI] [Google Scholar]
- Bozinovic, F. , & Rosenmann, M. (1988). Comparative energetics of South American cricetid rodents. Comparative Biochemistry and Physiology Part A, 91A, 195–202. 10.1016/0300-9629(88)91616-7 [DOI] [PubMed] [Google Scholar]
- Bradley, W. G. , Yousef, M. K. , & Scott, I. M. (1975). Physiological studies on the rock pocket mouse, Perognathus intermedius . Comparative Biochemistry and Physiology Part A, 50A, 331–337. 10.1016/0300-9629(75)90022-5 [DOI] [PubMed] [Google Scholar]
- Buckley, L. B. , Khaliq, I. , Swanson, D. L. , & Hof, C. (2018). Does metabolism constrain bird and mammal ranges and predict shifts in response to climate change? Ecology and Evolution, 8, 12375–12385. 10.1002/ece3.4537 [DOI] [PMC free article] [PubMed] [Google Scholar]
- Calder, W. A. , & Schmidt‐Nielsen, K. (1967). Temperature regulation and evaporation in the pigeon and the roadrunner. American Journal of Physiology, 213, 883–889. 10.1152/ajplegacy.1967.213.4.883 [DOI] [PubMed] [Google Scholar]
- Dalby, P. L. , & Heath, A. G. (1976). Oxygen consumption and body temperature of the Argentine field mouse, Akodon azarae, in relation to ambient temperature. Journal of Thermal Biology, 1, 177–179. 10.1016/0306-4565(76)90010-3 [DOI] [Google Scholar]
- Dawson, W. R. (1955). The relation of oxygen consumption to temperature in desert rodents. Journal of Mammalogy, 36(4), 543–553. 10.2307/1375808 [DOI] [Google Scholar]
- Fristoe, T. S. , Burger, J. R. , Balk, M. A. , Khaliq, I. , Hof, C. , & Brown, J. H. (2015). Metabolic heat production and thermal conductance are mass‐independent adaptations to thermal environment in birds and mammals. Proceedings of the National Academy of Sciences of the United States of America, 112(52), 15934–15939. 10.1073/pnas.1521662112 [DOI] [PMC free article] [PubMed] [Google Scholar]
- Golightly, R. T. Jr , & Ohmart, R. D. (1983). Metabolism and body temperature of two desert canids: Coyotes and kit foxes. Journal of Mammalogy, 64(4), 624–635. 10.2307/1380518 [DOI] [Google Scholar]
- Haim, A. , Rubal, A. , & Harari, J. (1993). Comparative thermoregulatory adaptations of field mice of the genus Apodemus to habitat challenges. Journal of Comparative Physiology B, 163(7), 602–607. 10.1007/BF00302120 [DOI] [PubMed] [Google Scholar]
- Hetem, R. S. , Maloney, S. K. , Fuller, A. , & Mitchell, D. (2016). Heterothermy in large mammals: Inevitable or implemented? Biological Reviews, 91, 187–205. 10.1111/brv.12166 [DOI] [PubMed] [Google Scholar]
- Hudson, J. W. (1965). Temperature regulation and torpidity in the pygmy mouse, Baiomys taylori . Physiological Zoology, 38(3), 243–254. 10.1086/physzool.38.3.30152836 [DOI] [Google Scholar]
- Khaliq, I. , Böhning‐Gaese, K. , Prinzinger, R. , Pfenninger, M. , & Hof, C. (2017). The influence of thermal tolerances on geographical ranges of endotherms. Global Ecology and Biogeography, 26(6), 650–668. 10.1111/geb.12575 [DOI] [Google Scholar]
- Khaliq, I. , Hof, C. , Prinzinger, R. , Böhning‐Gaese, K. , & Pfenninger, M. (2014). Global variation in thermal tolerances and vulnerability of endotherms to climate change. Proceedings of the Royal Society B: Biological Sciences, 281(1789), 20141097 10.1098/rspb.2014.1097 [DOI] [PMC free article] [PubMed] [Google Scholar]
- King, J. R. (1964). Oxygen consumption and body temperature in relation to ambient temperature in the White‐Crowned Sparrow. Comparative Biochemistry and Physiology, 12, 13–24. 10.1016/0010-406X(64)90044-1 [DOI] [PubMed] [Google Scholar]
- Kobbe, S. , Nowack, J. , & Dausmann, K. H. (2014). Torpor is not the only option: Seasonal variations of the thermoneutral zone in a small primate. Journal of Comparative Physiology B, 184, 789–797. 10.1007/s00360-014-0834-z [DOI] [PubMed] [Google Scholar]
- Levesque, D. L. , Nowack, J. , & Stawski, C. (2016). Modelling mammalian energetics: The heterothermy problem. Climate Change Responses, 3, 7 10.1186/s40665-016-0022-3 [DOI] [Google Scholar]
- McKechnie, A. E. , Coe, B. H. , Gerson, A. R. , & Wolf, B. O. (2017). Data quality problems undermine analyses of endotherm upper critical temperatures. Journal of Biogeography, 44, 2424–2426. 10.1111/jbi.12941 [DOI] [Google Scholar]
- McNab, B. K. (1969). The economics of temperature regulation in neotropical bats. Comparative Biochemistry and Physiology, 31, 227–268. [DOI] [PubMed] [Google Scholar]
- McNab, B. K. (1978). The comparative energetics of neotropical marsupials. Journal of Comparative Physiology B, 125(2), 115–128. 10.1007/BF00686747 [DOI] [Google Scholar]
- McNab, B. K. (1979). The influence of body size on the energetics and distribution of fossorial and burrowing mammals. Ecology, 60, 1010–1021. 10.2307/1936869 [DOI] [Google Scholar]
- McNab, B. K. (1980). Energetics and the limits to a temperate distribution in armadillos. Journal of Mammalogy, 61(4), 606–627. 10.2307/1380307 [DOI] [Google Scholar]
- McNab, B. K. (1988). Energy conservation in a tree‐kangaroo (Dendrolagus matschiei) and the red panda (Ailurus fulgens). Physiological Zoology, 61, 280–292. 10.1086/physzool.61.3.30161241 [DOI] [Google Scholar]
- McNab, B. K. (1995). Expenditure and conservation in frugivorous and mixed‐diet carnivorans. Journal of Mammalogy, 76, 206–222. [Google Scholar]
- Mitchell, D. , Snelling, E. P. , Hetem, R. S. , Maloney, S. K. , Strauss, W. M. , & Fuller, A. (2018). Revisiting concepts of thermal physiology: Predicting responses of mammals to climate change. Journal of Animal Ecology, 87, 956–973. 10.1111/1365-2656.12818 [DOI] [PubMed] [Google Scholar]
- Müller, E. , Kamau, J. , & Maloiy, G. (1983). A comparative study of basal metabolism and thermoregulation in a folivorous (Colobus guereza) and an omnivorous (Cercopithecus mitis) primate species. Comparative Biochemistry and Physiology Part A, 74(2), 319–322. 10.1016/0300-9629(83)90608-4 [DOI] [PubMed] [Google Scholar]
- Neal, C. M. , & Lustick, S. I. (1973). Energetics and evaporative water loss in the short‐tailed shrew Blarina brevicauda . Physiological Zoology, 46(3), 180–185. 10.1086/physzool.46.3.30155600 [DOI] [Google Scholar]
- Noakes, M. J. , Smit, B. , Wolf, B. O. , & McKechnie, A. E. (2013). Thermoregulation in African Green Pigeons (Treron calvus) and a re‐analysis of insular effects on basal metabolic rate and heterothermy in columbid birds. Journal of Comparative Physiology B, 183, 969–982. 10.1007/s00360-013-0763-2 [DOI] [PubMed] [Google Scholar]
- Porter, W. P. , & Kearney, M. (2009). Size, shape, and the thermal niche of endotherms. Proceedings of the National Academy of Sciences of the United States of America, 106(Supplement 2), 19666–19672. 10.1073/pnas.0907321106 [DOI] [PMC free article] [PubMed] [Google Scholar]
- Root, T. (1988). Energy constraints on avian distributions and abundances. Ecology, 69, 330–339. 10.2307/1940431 [DOI] [Google Scholar]
- Scholander, P. F. , Hock, R. , Walters, V. , Johnson, F. , & Irving, L. (1950). Heat regulation in some arctic and tropical mammals and birds. Biological Bulletin, 99, 237–258. 10.2307/1538741 [DOI] [PubMed] [Google Scholar]
- Shield, J. (2009). Acclimation and energy metabolism of the dingo, Cards dingo and the coyote, Canis latrans. Journal of Zoology, 168(4), 483–501. [Google Scholar]
- Somero, G. N. (2013). A 1950s classic of thermal adaptation to cold. Journal of Experimental Biology, 216, 1759–1761. 10.1242/jeb.076398 [DOI] [PubMed] [Google Scholar]
- Tracy, C. R. (1972). Newton's Law: Its application for expressing heat losses from homeotherms. BioScience, 22, 656–659. 10.2307/1296267 [DOI] [Google Scholar]
- Wright, K. P. Jr , Badia, P. , Myers, B. L. , Plenzler, S. C. , & Hakel, M. (1997). Caffeine and light effects on nighttime melatonin and temperature levels in sleep‐deprived humans. Brain Research, 747, 78–84. 10.1016/S0006-8993(96)01268-1 [DOI] [PubMed] [Google Scholar]
Associated Data
This section collects any data citations, data availability statements, or supplementary materials included in this article.
Data Availability Statement
No original data were collected for this paper. Data used in the analysis can be found associated with Buckley et al. (2018).