



Abstract
Introduction
A large number of peer-reviewed studies, with various methodologies and populations, have addressed the effects of food insecurity (FIS) on mental health conditions such as depression, anxiety, and sleep disorders. There are currently, however, no published systematic assessments or meta-analyses of this literature.
Methods
A systematic search of the literature was conducted in PubMed, PsycInfo, Embase, Scopus, and Web of Science. Cross-sectional studies assessing the association between food insecurity and depression, anxiety, or sleep disorders were identified. For each of the three health outcomes, we extracted (or calculated when possible) the following effect sizes: odds ratio (OR), Hedges’ g, Pearson correlation coefficients r, or bivariate coefficients. Then, for each mental health-outcome/effect-size pair, the available studies were combined using the random effect model. Heterogeneity, publication bias, and subgroup dependence, for each meta-analysis, were also assessed.
Results
Fifty-seven studies provided cross-sectional data on the relationship between FIS and depression (n = 169,433), 13 on anxiety and psychological distress (n = 91,957), and 8 studies provided data on sleep disorders (n = 85,788). Meta-analysis showed that FIS is associated with an increased risk of testing positive for depression OR = 2.74 [95% CI 2.52–2.97, n = 135,500, Q(df = 41) = 69, I2 = 40%], anxiety OR = 2.41 [95% CI 1.81–3.22, n = 51,541, Q(df = 3) = 8, I2 = 63%], and sleep disorders OR = 1.80 [95% CI 1.51–2.15, n = 84,800, Q(df = 5) = 13, I2 = 62%]. The highest risks were found for depression and anxiety which had statistically similar values. The results were robust to covariates and population groups.
Discussion
This systematic review and meta-analysis demonstrates a strong association between FIS and depression, anxiety, and sleep disorders, for which more longitudinal studies addressing effect sizes are warranted to further study causation.
Electronic supplementary material
The online version of this article (10.1007/s11606-019-05202-4) contains supplementary material, which is available to authorized users.
KEY WORDS: food insecurity, health disparities, social determinants of health, depression, anxiety, sleep disorders, systematic review, meta-analysis
INTRODUCTION
Depression and anxiety are leading causes of morbidity in the USA, with significant health and economic impacts. They are also associated with other comorbid conditions such as cardiovascular disease, obesity, and diabetes.1–3 Similarly, sleep disorders have strong associations with depression and anxiety, also leading to significant morbidity over time.4
A large body of research has shown that socioeconomic status (SES) in the USA has a significant influence on the health outcomes of populations.5–8 An important component of SES is household food security—the basic ability to purchase food with nutritional value for oneself and/or one’s family.9 Food insecurity (FIS) is complex, with varying levels of severity, ranging from uncertainty in obtaining food to inability to eat sufficient calories.10, 11 Various questionnaires, with evolving validity, have been developed over the last 30 years to study this complex issue,10, 12, 13 such as the US Household Food Security Survey Module, which contains questions that assess a range of conditions and behaviors due to insufficient availability of food throughout the previous 12 months. Considerable research using these surveys has demonstrated that FIS is prevalent in many subgroups of the US population,14 findings that in turn have resulted in significant efforts to determine the effects of FIS on health outcomes.
Although there have been several reviews on the influence of FIS on various health outcomes,15, 16 to date, there have been few comprehensive systematic reviews in this area.15–17 Previous reviews had methodological limitations, including absent subgroup data and individual/group bias analyses. Furthermore, previous reviews also failed to address the association between FIS and mental health outcomes.15–17
We therefore conducted a meta-analytic investigation to determine the magnitude, characteristics, and consistency of the relationship between screening positive for FIS and screening positive for depression, anxiety, and sleep disorders. Confirmation of this association would support follow-up screening for depression, anxiety, and sleep disorders in patients screening positive for FIS, and vice versa, which could improve the care provided to marginalized populations.
METHODS
Overall Approach
This report focuses on subjects from the general population or any specific subgroups, with an exposure to FIS and the risk for depression, anxiety, and sleep disorders when compared to subjects without FIS. Here, we define depression as participants’ feelings of sadness and loss of interest or pleasure in life activities during a given amount of time; anxiety as excessive worry occurring on most days for at least 6 months; and sleep disorders as excessive changes in sleep latency, duration, or interruptions. Patients meeting these definitions were identified by standardized screening questionnaires, where responses could be coded for comparative analysis.
Search Strategy
PubMed, PsycINFO, Scopus, Web of Science, and Embase databases were searched for articles up to 15 December 2018. Subsets of these databases have been shown to be sufficient for previous mental health meta-analyses.18–21 The search targeted US studies that investigated the association of food insecurity with depression, anxiety, and sleep disorders. Search terms for these concepts were tailored for each database and are presented in the S1 Supplemental Documents in their entirety. Filters used such as “journal articles,” “USA,” and others were also specified. Duplicates were removed using the commercial software RefWorks.
Study Eligibility Criteria and Selection
Three authors independently examined each abstract to determine if the article (i) contained primary quantitative data about adults in the USA; (ii) measured food security/insecurity; (iii) assessed a mental health outcome such as depression, anxiety, or sleep disorders; and (iv) compared the health outcome directly to food security and not through a third variable. For the latter criterion, the raters were instructed to examine the text of the manuscript if the information was not clear from the abstract. Interrater reliability was analyzed using the group Fleiss kappa and Cohen kappa permutated through different raters.22
Data Collection Process and Data Items
Two authors participated in the data extraction. The S2 Supplement Document shows how the data was organized. Data extraction initially involved retrieval of the study design and the sample size. As some manuscripts presented multiple data, special care was taken to extract the sample size and study design for that particular comparison (i.e., a study may have been designed as case–-control for BMI outcomes but not for depression). For each data, we also retrieved population characteristics, methods of measuring FIS, and methods of measuring the mental health outcome.
The effect sizes investigated in this study were the logarithm of the odd ratios (OR), standardized mean differences (specifically Hedges’ g), Pearson correlation coefficients (r), and bivariate coefficients β. One of the authors first extracted the effect sizes that were directly presented in the manuscript and took note of where they were discussed. Also extracted were the adjusted odds ratios (AOR) if presented by the authors.
For manuscripts that did not present any of the aforementioned effect sizes, when there were enough primary data to calculate the effect sizes were determined. Hedges’ g values were calculated by retrieving averages and standard deviations of continuous variables in populations with different levels of FIS. We chose Hedges’ g over other options, such as Cohen’s d, because the former is designed to correct for biases from small sample sizes.23, 24 For odd ratios, we extracted the number of subjects with different outcomes at different FIS exposures. The bivariate coefficient β was extracted if the Pearson correlation coefficient (r) was not presented. The β coefficient was then converted to r using the approximation by Peterson et al.25
For studies that divided food insecurity into different levels, the primary data were pooled from different levels to calculate one effect size. If effect sizes were presented for different levels, and the primary data were not, the effect sizes were combined using the random effects model. Finally, instances in which none of the effect sizes or enough primary data were presented in manuscripts were noted.
Longitudinal cohort studies for which baseline data could not be extracted were separated for future work and are noted in the S2 Supplemental Document. The decision to exclude these studies was due to the large volume of cross-sectional data. In addition, combining cross-sectional and time-dependent data presents methodological and theoretical challenges that are beyond the scope of this study.26, 27
We performed a critical analysis of the articles by using the 20 questions in the Appraisal tool for Cross-Sectional Studies (AXIS tool). Additional information on this is in the S3 Supplemental Document.28
Summary Measures and Synthesis of Results by Meta-analysis
Summary measures were calculated for the aforementioned effect sizes. Meta-analyses were performed for effect sizes available in more than three comparable studies, using the metafor package in R based on the random effects (RE) size model. Unlike the fixed effects (FE) approximation, the RE model does not assume that the sampled populations have identical probability distributions. Instead, it assumes that the samples have means that are normally distributed. Unless indicated otherwise, all results were calculated using the DerSimonian–Laird estimator.29 For meta-analyses of OR, we used the logarithm as the effect size. For the Pearson correlation coefficient, we transformed them first by using Fisher’s r-to-Z.30 For each meta-analysis, heterogeneity across studies was calculated by first calculating the total variance (Q), the degrees of freedom (df), and the I2 statistic.31 These statistical methods were cited in previous systematic reviews.18–20, 32–34 For each meta-analysis, possible publication bias was calculated by the Begg and Mazumdar rank correlation test for funnel plot asymmetry as well as Kendall’s tau in Egger’s regression test.35
Subgroup Analysis
When enough data was available, subgroup heterogeneity was assessed by dividing subgroups based on gender, age, and confounder assessment. These subgroups were chosen based on previous meta-analysis studies on mental health outcomes.19, 32, 36 The R package metafor was used for all meta-analysis.37
RESULTS
Search Results
A flow diagram of the search and study selection process is shown in Figure 1. The search was developed by the authors. A total of 770 manuscripts were found in the database searches and screened. All articles were in English. Forty-three of the manuscripts were unanimously approved, while 661 were unanimously excluded. The interrater Fleiss kappa was 0.68 [0.63, 0.72]38; and the permutated kappas had no statistical difference between pairs of raters.22 The reviewers met to discuss the 66 disagreements and approved 44 more articles. Therefore, a total of 87 articles met the eligibility criteria. Three papers had data that was reported in a subsequent manuscript and there were 17 longitudinal depression cohort studies for which we could not extract cross-sectional data.
Figure 1.

Flow diagram for the search and study selection processes.
Study Characteristics
The characteristics of each study including the population information, study design, size, measurement method for mental health outcome, and the effect sizes are presented in Tables S1–8 of the S2 Supplemental Document. Each table indicates where in the manuscript the original information was located and whether we calculated the effect sizes ourselves by extracting primary data. Manuscripts for which we could not extract nor calculate effect sizes were noted. Information related to the longitudinal depression cohort studies is presented in Tables S2–9.
Altogether, there were 57 studies that provided cross-sectional data on the relationship between FIS and depression (n = 169,433), 13 studies with data on anxiety and psychological distress (n = 91,957), and 8 studies with data on sleep disorders (n = 85,788). Four depression studies and two sleep studies had overlapping data; the most recent study in pairs of overlapping studies was kept.39–44 Most studies had a wide age range, while only a few studies provided data on age-specific groups: five studies on 50+-year-old adults and six on young adults/college freshmen. There were no male-inclusive studies, while ten studies provided women-specific data. Other specific groups included HIV+ patients, veterans, and Hispanics. The major results of the meta-analyeses are summarized in Table 1.
Table 1.
Major Results from the Seven Meta-analyses
| Meta-analysis | Number of studies and sample size | RE result | I2 (%) |
|---|---|---|---|
| Depression, OR | 42 (n = 135,500) | 2.74 [2.52, 2.97] | 40 |
| Anxiety, OR | 4 (n = 51,541) | 2.41 [1.81, 3.22] | 63 |
| Distress, OR | 5 (n = 39,439) | 2.28 [1.14, 4.56] | 97 |
| Sleep disorder, OR | 6 (n = 84,800) | 1.80 [1.51, 2.15] | 62 |
| Depression, Hedges’ g | 13 (n = 5837) | 0.63 [0.54, 0.71] | 36 |
| Anxiety, g | 3 (n = 825) | 0.50 [0.34, 0.66] | 0 |
| Sleep duration/quality, g | 2 (n = 988) | − 0.44 [− 0.78, − 0.09] | 66 |
| Depression, Pearson coefficient r | 3 (n = 28,706) | 0.29 [0.18, 0.39] | 93 |
Results of Individual Studies and Synthesis of Results
Depression
Depression was measured using several validated scales including the Burnam Depression Scale (BDS) (n = 183), Center for Disease Control Healthy Days Measure (CDC-HDM) (n = 1956), Center for Epidemiological Studies Depression Scale (CESD) (n = 8439), Composite International Diagnostic Interview (CIDI) (n = 4347), Geriatric Depression Scale (GDS) (n = 938), Patient Health Questionnaire (PHQ) (n = 70,575), and others.
Among the studies with sufficient odds ratio data (42 studies, n = 135,550) (Fig. 2), the OR was 2.74 [95% CI 2.52–2.97, Q(df = 41) = 69, I2 = 40%].40, 41, 45–84 One study was divided into two groups for the meta-analysis.76 Thirteen studies (n = 5837) (Fig. 3) provided sufficient data to calculate a corrected standardized mean difference of g = 0.63 [95% CI 0.54–0.71, Q(df = 12) = 19, I2 = 36%].47, 70, 85–95 As for the three studies (n = 28,706) with sufficient data to determine the Pearson’s correlation coefficient r,96–98 the results were r = 0.29 [95% CI 0.18–0.39, Q(df = 2) = 28, I2 = 93%] (S2 Supplemental Document, Fig. S2–1).
Figure 2.
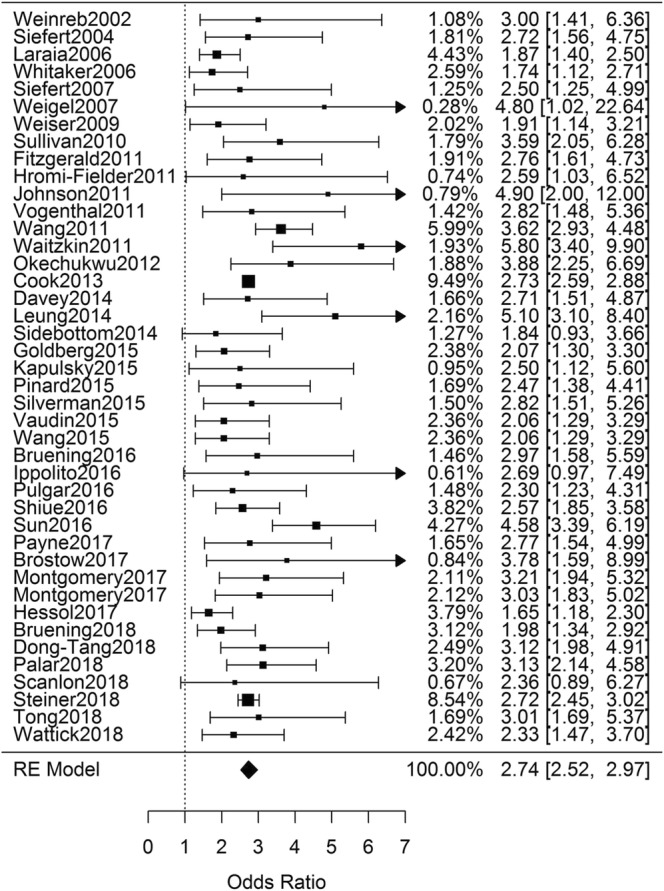
Statistical summary and forest plot of OR for the association between FIS and depression.
Figure 3.
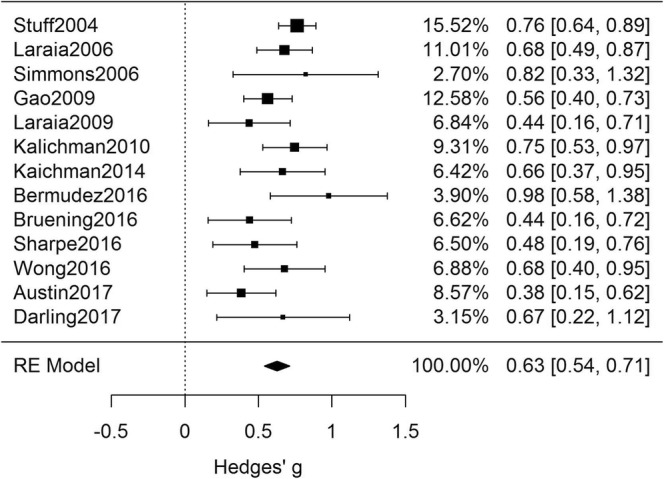
Statistical summary and forest plot of Hedges’ g for the association between FIS and depression.
Anxiety and Psychological Distress
The most common scale (or subset of) for measuring anxiety and psychological distress were the 7-item anxiety scale (GAD-7) (n = 50,321) and the Kessler scale (n = 37,389), respectively. Other commonly used scales included the caretaker portion of the Child Behavior Check List (CBCL) (n = 724) and the Short Form 12-item Health Survey (n = 683). Four studies (n = 51,541) (Fig. 4) provided sufficient data to calculate an odds ratio of 2.41 [95% CI 1.81–3.22, Q(df = 3) = 8, I2 = 63%],39, 52, 77, 82 while three (n = 825) (Fig. 5) yielded a Hedges’ g = 0.50 [95% CI 0.34–0.66, Q(df = 2) = 1.2, I2 = 0%].47, 95 For psychological distress, five studies (n = 39,439) (Fig. 6) were combined and produced an odds ratio of 2.28 [95% CI 1.14–4.56, Q(df = 4) = 150, I2 = 97%].99–103
Figure 4.
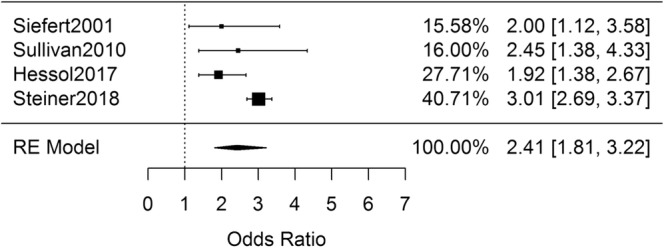
Statistical summary and forest plot of OR for the association between FIS and anxiety.
Figure 5.
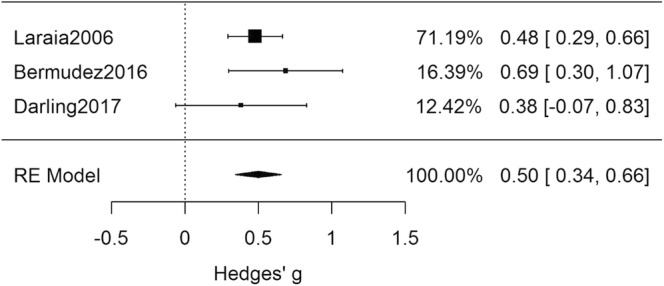
Statistical summary and forest plot of Hedges’ g for the association between FIS and anxiety.
Figure 6.
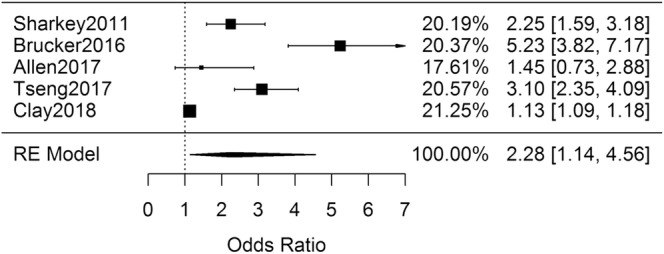
Statistical summary and forest plot of OR for the association between FIS and psychological distress.
Sleep Disorders
Sleep disorders were mostly measured using various custom questions about difficulties falling or maintaining sleep (n = 11,577) and insufficient sleep (n = 73,243).52, 104–108 Combining the six studies (n = 84,800) (Fig. 7) with sufficient data to calculate the OR of sleep disorders yielded an OR = 1.80 [95% CI 1.51–2.15, Q(df = 5) = 13, I2 = 62%]. Two studies (n = 988) (Fig. 8) with data about sleep duration and quality were combined to calculate the standardized mean difference, g = − 0.44 [95% CI (− 0.78)–(− 0.09), Q(df = 1) = 3, I2 = 66%].107
Figure 7.
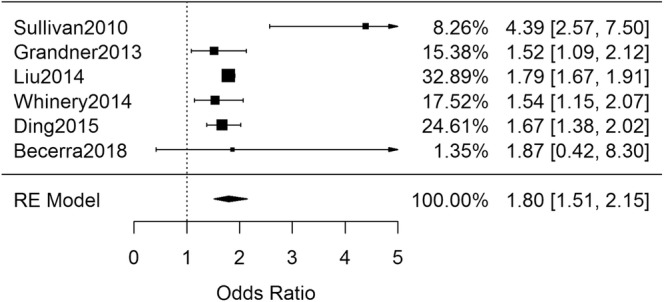
Statistical summary and forest plot of OR for the association between FIS and sleep disorders.
Figure 8.
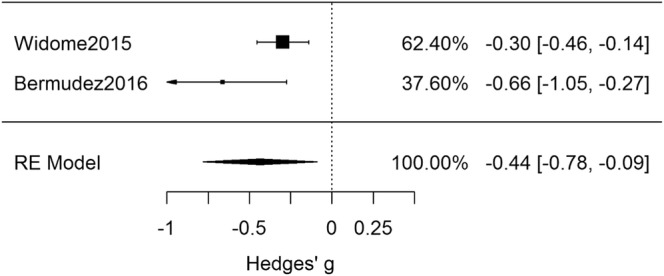
Statistical summary and forest plot of g for the association between FIS and sleep disorders.
Further Analyses
Risk of Bias Across Studies
Among the 42 studies reporting the odds of depression with FIS, there was no evidence of bias using either funnel plots or statistical tests (Begg’s p = 0.45, Egger’s p = 0.3). Similar results were obtained for the assessment of depression using Hedges’ g (Begg’s p = 1.0, Egger’s p = 0.88). The other five major meta-analyses had fewer than six studies and would therefore provide very low statistical power for the Begg’s and Egger’s publication bias tests109, 110 (see the S3 Supplemental Document).
Subgroup Analysis
Table 2 shows the results for meta-analysis of subgroups for ORDep. Subgroup analyses of studies that adjusted the odds ratio (AOR) in terms of covariates yielded a combined result that did not differ significantly from the OR for all manuscripts. Similarly, analysis of the studies that did not correct for covariates did not differ either. Studies involving only women had results lower than the total. Studies involving Hispanics had the highest OR and senior citizens had the lowest. However, the 95% confidence interval of all subgroups contained the average found for all studies.
Table 2.
Subgroup Analysis for the Depression Studies with Reported (or Calculable) OR
| Group | Number of studies | OR depression | I2 (%) |
|---|---|---|---|
| All manuscripts | 42 (n = 135,500) | 2.74 [2.52, 2.97] | 40 |
| Women | 10 (n = 7805) | 2.34 [2.00, 2.74] | 0 |
| Hispanics | 6 (n = 1331) | 3.21 [2.27, 4.54] | 28 |
| Seniors | 4 (n = 2395) | 2.42 [1.55, 3.78] | 58 |
| HIV positive | 4 (n = 3124) | 2.40 [1.51, 3.81] | 83 |
| Veterans | 3 (n = 5046) | 3.03 [2.02, 4.54] | 57 |
| Reported AOR | 21 (n = 58,053) | 2.46 [2.20, 2.76] | 26 |
| Did not report AOR | 21 (n = 77,497) | 3.00 [2.64, 3.41] | 45 |
DISCUSSION
These large standardized meta-analyses show that FIS is associated with an increased risk of depression, anxiety, and sleep disorders. For physicians caring for diverse or marginalized populations of patients, individuals screening positive for FIS may warrant follow-up screening for depression, anxiety, and sleep disorders. Similarly, for patients manifesting evidence of depression, anxiety, and sleep disorders, it may be appropriate to assess for the presence of FIS, especially given the link between nutrition and emotional well-being.
The evidence for the FIS–depression association is perhaps the most significant, with 57 studies and 169,433 participants. The studies spanned several populations such as college freshmen, seniors, veterans, HIV+ individuals, low-income caretakers, and the general population. This is among the largest pool of participants for a meta-analysis of mental health outcomes.18, 32, 111, 112
Subgroup analysis suggests the association between FIS and depression was smaller for women; unfortunately, there were not enough men-only studies for subgroup analysis and so the comparison was done with respect to all-gender studies. The results also showed that the FIS/depression association was consistent for veterans, seniors, HIV+ individuals, and Latinos. Furthermore, the agreement between studies with or without covariate analysis suggests that covariates are not responsible.97
The similarity between the increased risks for depression and anxiety was also remarkable. This suggests that anxiety and depression from FIS may be interconnected in their mechanism or predisposing factors. Also interesting, however, was that the risk of sleep disorders was smaller than the former two, although there were too few studies on sleep disorders to be definitive.
Analysis of the studies by the g effect size also showed a significant and considerable association. (g = 0.63 for depression and g = 0.50 for anxiety). In Cohen’s scale, this corresponds to a medium-to-large effect size; although it should be noted that this scale is subjective. Cohen himself, and several following authors, have pointed out that relevant comparisons are more important than the suggested scale.113 As more authors report effect sizes, we can develop better scales to assess the effects of certain variables on outcome measures.
Another useful characteristic of the g effect size is that it allows the Z-score interpretation of results. An effect size of 0.63 means that we expect the average FIS individual to have a depression score higher than 75% of food-secure individuals. Similarly, the average FIS individual would be expected to have an anxiety score higher than 69%. The effect sizes are consistent for different depression screening scales, and even subscales. This is beneficial because it may be difficult to choose cutoff scores for a smaller subset of the original scale. Finally, for sleep, the g of − 0.44 corroborates a smaller association to FIS than that of depression and anxiety.
Several limitations are noted. First, this analysis focused only on cross-sectional studies, and therefore, our results and conclusions cannot speak to causation.
Second, we only included studies about populations in the USA. As this work represents the initial analysis of this literature, we believe it was necessary to have this restriction given that poverty and markers of it such as FIS are contextual, varying in meaning and impact from one country to another. Situations in which individuals may be able to eat three meals per day, with high caloric content but poor nutritional quality, may be more prevalent in the USA compared to other countries where individuals are unable to purchase enough food to meet basic caloric needs. Therefore, limiting this review to studies conducted in the USA minimized the confounding influence of varying contextual definitions of FIS. Despite this, we were still able to assemble a large number of studies for our analysis. The diversity of the US population offered numerous opportunities for subgroup analyses.
Third, caution should be exercised in interpreting the significance of the effect sizes g and r, as there are an insufficient number of published studies on the effect of other SES markers on depression, anxiety, and sleep disorders. The standard definitions of “small” or “large” effect sizes were originally proposed with the suggestion to carefully consider context.114 Therefore, it is difficult to state if these effect sizes are large or small given the paucity of other data on other makers of SES for comparison. It may be that other components of low SES have a stronger association with depression, anxiety, and sleep disorders. Fourth, we did not register the project in a protocol database. As this is becoming the norm, all future systematic reviews in this topic, including from the authors, should follow this emerging guideline.
Finally, it should be noted that “depression” was identified by questionnaires assessing symptoms of depression. This analysis does not speak to associations with clinical diagnoses of depression made by a healthcare provider such as major depressive episodes, dysthymic disorders, bipolar episodes, or even substance-induced mood or adjustment disorders.
CONCLUSIONS
This systematic review and meta-analysis demonstrates a strong association of FIS with depression, anxiety, and sleep disorders, that provides further rationale for the screening of patients for FIS.
Electronic Supplementary Material
(PDF 90 kb)
(PDF 758 kb)
(PDF 382 kb)
Acknowledgments
We would like to thank Lanair Lett, Gilberto Vila Arroyo, and Sara Zhou for their very helpful comments.
Funding Information
The authors are grateful for the support provided by the Program for Diversity and Inclusion at the Perelman School of Medicine at the University of Pennsylvania. DJA and AT would like to thank the Gamble Scholarship and the Perelman Scholarship for support.
Compliance with Ethical Standards
Conflict of Interest
All authors declare that they do not have a conflict of interest.
Footnotes
Publisher’s Note
Springer Nature remains neutral with regard to jurisdictional claims in published maps and institutional affiliations.
References
- 1.Stunkard AJ, Faith MS, Allison KC. Depression and obesity. Biol. Psychiatry. 2003;54:330–337. doi: 10.1016/s0006-3223(03)00608-5. [DOI] [PubMed] [Google Scholar]
- 2.Suls J, Bunde J. Anger, anxiety, and depression as risk factors for cardiovascular disease: the problems and implications of overlapping affective dispositions. Psychol. Bull. 2005;131:260. doi: 10.1037/0033-2909.131.2.260. [DOI] [PubMed] [Google Scholar]
- 3.Nichols CE. Time Ni Hota Hai: time poverty and food security in the Kumaon hills, India. Gend. Place Cult. 2016;23:1404–1419. [Google Scholar]
- 4.Wallander M-A, Johansson S, Ruigómez A, Rodríguez LAG, Jones R. Morbidity associated with sleep disorders in primary care: a longitudinal cohort study. Prim. Care Companion J. Clin. Psychiatry. 2007;9:338. doi: 10.4088/pcc.v09n0502. [DOI] [PMC free article] [PubMed] [Google Scholar]
- 5.Adler NE, Ostrove JM. Socioeconomic status and health: what we know and what we don’t. Ann. N. Y. Acad. Sci. 1999;896:3–15. doi: 10.1111/j.1749-6632.1999.tb08101.x. [DOI] [PubMed] [Google Scholar]
- 6.Adler NE, et al. Socioeconomic status and health: the challenge of the gradient. Am. Psychol. 1994;49:15. doi: 10.1037//0003-066x.49.1.15. [DOI] [PubMed] [Google Scholar]
- 7.Williams DR, Priest N, Anderson NB. Understanding associations among race, socioeconomic status, and health: patterns and prospects. Health Psychol. 2016;35:407. doi: 10.1037/hea0000242. [DOI] [PMC free article] [PubMed] [Google Scholar]
- 8.Fitzpatrick T, et al. Looking beyond income and education: socioeconomic status gradients among future high-cost users of health care. Am. J. Prev. Med. 2015;49:161–171. doi: 10.1016/j.amepre.2015.02.018. [DOI] [PubMed] [Google Scholar]
- 9.Maxwell, S. & Smith, M. Household food security: a conceptual review. Househ. Food Secur. Concepts Indic. Meas. 1–72 (1992).
- 10.Frongillo EA., Jr Validation of measures of food insecurity and hunger. J. Nutr. 1999;129:506S–509S. doi: 10.1093/jn/129.2.506S. [DOI] [PubMed] [Google Scholar]
- 11.Pinstrup-Andersen P. Food security: definition and measurement. Food Secur. 2009;1:5–7. [Google Scholar]
- 12.Kendall A, Olson CM, Frongillo EA., Jr Validation of the Radimer/Cornell measures of hunger and food insecurity. J. Nutr. 1995;125:2793–2801. doi: 10.1093/jn/125.11.2793. [DOI] [PubMed] [Google Scholar]
- 13.Webb P, et al. Measuring household food insecurity: why it’s so important and yet so difficult to do. J. Nutr. 2006;136:1404S–1408S. doi: 10.1093/jn/136.5.1404S. [DOI] [PubMed] [Google Scholar]
- 14.Chilton M, Rose D. A rights-based approach to food insecurity in the United States. Am. J. Public Health. 2009;99:1203–1211. doi: 10.2105/AJPH.2007.130229. [DOI] [PMC free article] [PubMed] [Google Scholar]
- 15.Gundersen C, Ziliak JP. Food insecurity and health outcomes. Health Aff. (Millwood) 2015;34:1830–1839. doi: 10.1377/hlthaff.2015.0645. [DOI] [PubMed] [Google Scholar]
- 16.Compton MT. Food insecurity as a social determinant of mental health. Psychiatr. Ann. 2014;44:46–51. [Google Scholar]
- 17.Weaver LJ, Fasel CB. A systematic review of the literature on the relationships between chronic diseases and food insecurity. Food Nutr. Sci. 2018;9:519. [Google Scholar]
- 18.De Groot M, Anderson R, Freedland KE, Clouse RE, Lustman PJ. Association of depression and diabetes complications: a meta-analysis. Psychosom. Med. 2001;63:619–630. doi: 10.1097/00006842-200107000-00015. [DOI] [PubMed] [Google Scholar]
- 19.Howren MB, Lamkin DM, Suls J. Associations of depression with C-reactive protein, IL-1, and IL-6: a meta-analysis. Psychosom. Med. 2009;71:171–186. doi: 10.1097/PSY.0b013e3181907c1b. [DOI] [PubMed] [Google Scholar]
- 20.Black CN, Bot M, Scheffer PG, Cuijpers P, Penninx BW. Is depression associated with increased oxidative stress? A systematic review and meta-analysis. Psychoneuroendocrinology. 2015;51:164–175. doi: 10.1016/j.psyneuen.2014.09.025. [DOI] [PubMed] [Google Scholar]
- 21.Passos IC, et al. Inflammatory markers in post-traumatic stress disorder: a systematic review, meta-analysis, and meta-regression. Lancet Psychiatry. 2015;2:1002–1012. doi: 10.1016/S2215-0366(15)00309-0. [DOI] [PubMed] [Google Scholar]
- 22.Arenas, D. J. Inter-Rater Software for analysis of inter-rater reliability by permutating pairs of multiple users. ArXiv Prepr. ArXiv180905731 (2018).
- 23.Brunoni AR, Vanderhasselt M-A. Working memory improvement with non-invasive brain stimulation of the dorsolateral prefrontal cortex: a systematic review and meta-analysis. Brain Cogn. 2014;86:1–9. doi: 10.1016/j.bandc.2014.01.008. [DOI] [PubMed] [Google Scholar]
- 24.Hedges LV. Distribution theory for Glass’s estimator of effect size and related estimators. J. Educ. Stat. 1981;6:107–128. [Google Scholar]
- 25.Peterson RA, Brown SP. On the use of beta coefficients in meta-analysis. J. Appl. Psychol. 2005;90:175. doi: 10.1037/0021-9010.90.1.175. [DOI] [PubMed] [Google Scholar]
- 26.Morris SB, DeShon RP. Combining effect size estimates in meta-analysis with repeated measures and independent-groups designs. Psychol. Methods. 2002;7:105. doi: 10.1037/1082-989x.7.1.105. [DOI] [PubMed] [Google Scholar]
- 27.Roth Philip L., Le Huy, Oh In-Sue, Van Iddekinge Chad H., Bobko Philip. Using beta coefficients to impute missing correlations in meta-analysis research: Reasons for caution. Journal of Applied Psychology. 2018;103(6):644–658. doi: 10.1037/apl0000293. [DOI] [PubMed] [Google Scholar]
- 28.Downes MJ, Brennan ML, Williams HC, Dean RS. Development of a critical appraisal tool to assess the quality of cross-sectional studies (AXIS) BMJ Open. 2016;6:e011458. doi: 10.1136/bmjopen-2016-011458. [DOI] [PMC free article] [PubMed] [Google Scholar]
- 29.IntHout J, Ioannidis JP, Borm GF. The Hartung-Knapp-Sidik-Jonkman method for random effects meta-analysis is straightforward and considerably outperforms the standard DerSimonian-Laird method. BMC Med. Res. Methodol. 2014;14:25. doi: 10.1186/1471-2288-14-25. [DOI] [PMC free article] [PubMed] [Google Scholar]
- 30.Silver NC, Dunlap WP. Averaging correlation coefficients: should Fisher’s z transformation be used? J. Appl. Psychol. 1987;72:146. [Google Scholar]
- 31.Higgins JP, Thompson SG. Quantifying heterogeneity in a meta-analysis. Stat. Med. 2002;21:1539–1558. doi: 10.1002/sim.1186. [DOI] [PubMed] [Google Scholar]
- 32.Anglin RE, Samaan Z, Walter SD, McDonald SD. Vitamin D deficiency and depression in adults: systematic review and meta-analysis. Br. J. Psychiatry. 2013;202:100–107. doi: 10.1192/bjp.bp.111.106666. [DOI] [PubMed] [Google Scholar]
- 33.Bohlmeijer E, Prenger R, Taal E, Cuijpers P. The effects of mindfulness-based stress reduction therapy on mental health of adults with a chronic medical disease: a meta-analysis. J. Psychosom. Res. 2010;68:539–544. doi: 10.1016/j.jpsychores.2009.10.005. [DOI] [PubMed] [Google Scholar]
- 34.Demnitz N, et al. A systematic review and meta-analysis of cross-sectional studies examining the relationship between mobility and cognition in healthy older adults. Gait Posture. 2016;50:164–174. doi: 10.1016/j.gaitpost.2016.08.028. [DOI] [PMC free article] [PubMed] [Google Scholar]
- 35.Begg CB, Mazumdar M. Operating characteristics of a rank correlation test for publication bias. Biometrics. 1994;50:1088–1101. [PubMed] [Google Scholar]
- 36.Gariepy G, Nitka D, Schmitz N. The association between obesity and anxiety disorders in the population: a systematic review and meta-analysis. Int. J. Obes. 2010;34:407. doi: 10.1038/ijo.2009.252. [DOI] [PubMed] [Google Scholar]
- 37.Viechtbauer, W. Conducting meta-analyses in R with the metafor package. J. Stat. Softw. 36, (2010).
- 38.Fleiss JL, Nee JC, Landis JR. Large sample variance of kappa in the case of different sets of raters. Psychol. Bull. 1979;86:974. [Google Scholar]
- 39.Siefert K, Heflin CM, Corcoran ME, Williams DR. Food insufficiency and the physical and mental health of low-income women. Women Health. 2001;32:159–177. doi: 10.1300/J013v32n01_08. [DOI] [PubMed] [Google Scholar]
- 40.Siefert K, Heflin CM, Corcoran ME, Williams DR. Food insufficiency and physical and mental health in a longitudinal survey of welfare recipients. J. Health Soc. Behav. 2004;45:171–186. doi: 10.1177/002214650404500204. [DOI] [PubMed] [Google Scholar]
- 41.Dong KR, Tang AM, Stopka TJ, Beckwith CG, Must A. Food acquisition methods and correlates of food insecurity in adults on probation in Rhode Island. PloS One. 2018;13:e0198598. doi: 10.1371/journal.pone.0198598. [DOI] [PMC free article] [PubMed] [Google Scholar]
- 42.Dong KR, Must A, Tang AM, Stopka TJ, Beckwith CG. Food insecurity, morbidities, and substance use in adults on probation in Rhode Island. J. Urban Health Bull. N. Y. Acad. Med. 2018;95:564–575. doi: 10.1007/s11524-018-0290-2. [DOI] [PMC free article] [PubMed] [Google Scholar]
- 43.Widome R, Jensen A, Bangerter A, Fu SS. Food insecurity among veterans of the US wars in Iraq and Afghanistan. Public Health Nutr. 2014;18:844–849. doi: 10.1017/S136898001400072X. [DOI] [PMC free article] [PubMed] [Google Scholar]
- 44.Widome R, Jensen A, Fu SS. Socioeconomic disparities in sleep duration among veterans of the US wars in Iraq and Afghanistan. Am. J. Public Health. 2015;105:e70–e74. doi: 10.2105/AJPH.2014.302375. [DOI] [PMC free article] [PubMed] [Google Scholar]
- 45.Weinreb L, et al. Hunger: its impact on children’s health and mental health. Pediatrics. 2002;110:e41–e41. doi: 10.1542/peds.110.4.e41. [DOI] [PubMed] [Google Scholar]
- 46.Sharkey JR. Risk and presence of food insufficiency are associated with low nutrient intakes and multimorbidity among homebound older women who receive home-delivered meals. J. Nutr. 2003;133:3485–3491. doi: 10.1093/jn/133.11.3485. [DOI] [PubMed] [Google Scholar]
- 47.Laraia BA, Siega-Riz AM, Gundersen C, Dole N. Psychosocial factors and socioeconomic indicators are associated with household food insecurity among pregnant women. J. Nutr. 2006;136:177–182. doi: 10.1093/jn/136.1.177. [DOI] [PubMed] [Google Scholar]
- 48.Whitaker RC, Orzol SM. Obesity among US urban preschool children: relationships to race, ethnicity, and socioeconomic status. Arch. Pediatr. Adolesc. Med. 2006;160:578–584. doi: 10.1001/archpedi.160.6.578. [DOI] [PubMed] [Google Scholar]
- 49.Siefert K, Finlayson TL, Williams DR, Delva J, Ismail AI. Modifiable risk and protective factors for depressive symptoms in low-income African American mothers. Am. J. Orthopsychiatry. 2007;77:113–123. doi: 10.1037/0002-9432.77.1.113. [DOI] [PubMed] [Google Scholar]
- 50.Weigel MM, Armijos RX, Hall YP, Ramirez Y, Orozco R. The household food insecurity and health outcomes of US–Mexico border migrant and seasonal farmworkers. J. Immigr. Minor. Health. 2007;9:157–169. doi: 10.1007/s10903-006-9026-6. [DOI] [PubMed] [Google Scholar]
- 51.Weiser SD, et al. Food insecurity is associated with incomplete HIV RNA suppression among homeless and marginally housed HIV-infected individuals in San Francisco. J. Gen. Intern. Med. 2009;24:14–20. doi: 10.1007/s11606-008-0824-5. [DOI] [PMC free article] [PubMed] [Google Scholar]
- 52.Sullivan AF, Clark S, Pallin DJ, Camargo CA. Food security, health, and medication expenditures of emergency department patients. J. Emerg. Med. 2010;38:524–528. doi: 10.1016/j.jemermed.2008.11.027. [DOI] [PMC free article] [PubMed] [Google Scholar]
- 53.Fitzgerald N, Hromi-Fiedler A, Segura-Pérez S, Pérez-Escamilla R. Food insecurity is related to increased risk of type 2 diabetes among Latinas. Ethn. Dis. 2011;21:328. [PMC free article] [PubMed] [Google Scholar]
- 54.Hromi-Fiedler A, Bermúdez-Millán A, Segura-Pérez S, Pérez-Escamilla R. Household food insecurity is associated with depressive symptoms among low-income pregnant Latinas. Matern. Child. Nutr. 2011;7:421–430. doi: 10.1111/j.1740-8709.2010.00266.x. [DOI] [PMC free article] [PubMed] [Google Scholar]
- 55.Johnson CM, Sharkey JR, Dean WR. Indicators of material hardship and depressive symptoms among homebound older adults living in North Carolina. J. Nutr. Gerontol. Geriatr. 2011;30:154–168. doi: 10.1080/21551197.2011.566527. [DOI] [PubMed] [Google Scholar]
- 56.Vogenthaler NS, et al. Depressive symptoms and food insufficiency among HIV-infected crack users in Atlanta and Miami. AIDS Behav. 2011;15:1520–1526. doi: 10.1007/s10461-010-9668-1. [DOI] [PMC free article] [PubMed] [Google Scholar]
- 57.Wang EA, et al. Food insecurity is associated with poor virologic response among HIV-infected patients receiving antiretroviral medications. J. Gen. Intern. Med. 2011;26:1012–1018. doi: 10.1007/s11606-011-1723-8. [DOI] [PMC free article] [PubMed] [Google Scholar]
- 58.Waitzkin H, et al. Promotoras as mental health practitioners in primary care: a multi-method study of an intervention to address contextual sources of depression. J. Community Health. 2011;36:316–331. doi: 10.1007/s10900-010-9313-y. [DOI] [PMC free article] [PubMed] [Google Scholar]
- 59.Okechukwu CA, El Ayadi AM, Tamers SL, Sabbath EL, Berkman L. Household food insufficiency, financial strain, work-family spillover, and depressive symptoms in the working class: the Work, Family, and Health Network study. Am. J. Public Health. 2012;102:126–133. doi: 10.2105/AJPH.2011.300323. [DOI] [PMC free article] [PubMed] [Google Scholar]
- 60.Cook JT, et al. Are food insecurity’s health impacts underestimated in the US population? Marginal food security also predicts adverse health outcomes in young US children and mothers. Adv. Nutr. 2013;4:51–61. doi: 10.3945/an.112.003228. [DOI] [PMC free article] [PubMed] [Google Scholar]
- 61.Daveyâ-Rothwell MA, Flamm LJ, Kassa HT, Latkin CA. Food insecurity and depressive symptoms: comparison of drug using and nondrug-using women at risk for HIV. J. Community Psychol. 2014;42:469–478. doi: 10.1002/jcop.21622. [DOI] [PMC free article] [PubMed] [Google Scholar]
- 62.Leung CW, Epel ES, Willett WC, Rimm EB, Laraia BA. Household food insecurity is positively associated with depression among low-income supplemental nutrition assistance program participants and income-eligible nonparticipants. J. Nutr. 2014;145:622–627. doi: 10.3945/jn.114.199414. [DOI] [PubMed] [Google Scholar]
- 63.Sidebottom AC, Hellerstedt WL, Harrison PA, Hennrikus D. An examination of prenatal and postpartum depressive symptoms among women served by urban community health centers. Arch. Womens Ment. Health. 2014;17:27–40. doi: 10.1007/s00737-013-0378-3. [DOI] [PubMed] [Google Scholar]
- 64.Goldberg SL, Mawn BE. Predictors of food insecurity among older adults in the United States. Public Health Nurs. Boston Mass. 2015;32:397–407. doi: 10.1111/phn.12173. [DOI] [PubMed] [Google Scholar]
- 65.Kapulsky L, Tang AM, Forrester JE. Food insecurity, depression, and social support in HIV-infected Hispanic individuals. J. Immigr. Minor. Health. 2015;17:408–413. doi: 10.1007/s10903-014-0076-x. [DOI] [PMC free article] [PubMed] [Google Scholar]
- 66.Pinard, C. A., Calloway, E. E., Fricke, H. E. & Yaroch, A. L. A cross-sectional exploration of food security, depression, and CHAOS in low-income households with children. J. Appl. Res. Child. 6, 1–12 (2015).
- 67.Silverman J, et al. The relationship between food insecurity and depression, diabetes distress and medication adherence among low-income patients with poorly-controlled diabetes. J. Gen. Intern. Med. 2015;30:1476–1480. doi: 10.1007/s11606-015-3351-1. [DOI] [PMC free article] [PubMed] [Google Scholar]
- 68.Vaudin A, Sahyoun NR. Food anxiety is associated with poor health status among recently hospital-discharged older adults. J. Nutr. Gerontol. Geriatr. 2015;34:245–262. doi: 10.1080/21551197.2015.1035825. [DOI] [PubMed] [Google Scholar]
- 69.Wang EA, et al. Food insecurity and health: data from the Veterans Aging Cohort Study. Public Health Rep. Wash. DC. 2015;1974(130):261–268. doi: 10.1177/003335491513000313. [DOI] [PMC free article] [PubMed] [Google Scholar]
- 70.Bruening M, Brennhofer S, van Woerden I, Todd M, Laska M. Factors related to the high rates of food insecurity among diverse, urban college freshmen. J. Acad. Nutr. Diet. 2016;116:1450–1457. doi: 10.1016/j.jand.2016.04.004. [DOI] [PMC free article] [PubMed] [Google Scholar]
- 71.Ippolito MM, et al. Food insecurity and diabetes self-management among food pantry clients. Public Health Nutr. 2017;20:183–189. doi: 10.1017/S1368980016001786. [DOI] [PMC free article] [PubMed] [Google Scholar]
- 72.Pulgar CA, et al. Economic hardship and depression among women in Latino farmworker families. J. Immigr. Minor. Health. 2016;18:497–504. doi: 10.1007/s10903-015-0229-6. [DOI] [PMC free article] [PubMed] [Google Scholar]
- 73.Shiue I. People with diabetes, respiratory, liver or mental disorders, higher urinary antimony, bisphenol A, or pesticides had higher food insecurity: USA NHANES, 2005-2006. Environ. Sci. Pollut. Res. Int. 2016;23:198–205. doi: 10.1007/s11356-015-5677-y. [DOI] [PubMed] [Google Scholar]
- 74.Sun J, et al. Childhood adversity and adult reports of food insecurity among households with children. Am. J. Prev. Med. 2016;50:561–572. doi: 10.1016/j.amepre.2015.09.024. [DOI] [PubMed] [Google Scholar]
- 75.Brostow DP, Gunzburger E, Thomas KS. Food insecurity among veterans: findings from the health and retirement study. J. Nutr. Health Aging. 2017;21:1358–1364. doi: 10.1007/s12603-017-0910-7. [DOI] [PubMed] [Google Scholar]
- 76.Montgomery J, Lu J, Ratliff S, Mezuk B. Food insecurity and depression among adults with diabetes: results from the National Health and Nutrition Examination Survey (NHANES) Diabetes Educ. 2017;43:260–271. doi: 10.1177/0145721717699890. [DOI] [PMC free article] [PubMed] [Google Scholar]
- 77.Hessol NA, Zepf R, Zobell E, Weiser SD, John MD. Food insecurity and aging outcomes in older adults living with HIV. AIDS Behav. 2017;21:3506–3514. doi: 10.1007/s10461-017-1838-y. [DOI] [PubMed] [Google Scholar]
- 78.Payne-Sturges, D. C., Tjaden, A., Caldeira, K. M., Vincent, K. B. & Arria, A. M. Student hunger on campus: food insecurity among college students and implications for academic institutions. Am. J. Health Promot. 32, 349–354 (2017). [DOI] [PMC free article] [PubMed]
- 79.Bruening, M., van Woerden, I., Todd, M. & Laska, M. N. Hungry to learn: the prevalence and effects of food insecurity on health behaviors and outcomes over time among a diverse sample of university freshmen. Int. J. Behav. Nutr. Phys. Act. 15, 9 (2018). [DOI] [PMC free article] [PubMed]
- 80.Palar K, et al. Food insecurity, internalized stigma, and depressive symptoms among women living with HIV in the United States. AIDS Behav. 2018;22:3869–3878. doi: 10.1007/s10461-018-2164-8. [DOI] [PMC free article] [PubMed] [Google Scholar]
- 81.Scanlon FA, et al. Depression, executive dysfunction, and prior economic and social vulnerability associations in incarcerated African American men. J. Correct. Health Care Off. J. Natl. Comm. Correct. Health Care. 2018;24:295–308. doi: 10.1177/1078345818782440. [DOI] [PMC free article] [PubMed] [Google Scholar]
- 82.Steiner JF, et al. Food insecurity in older adults in an integrated health care system. J. Am. Geriatr. Soc. 2018;66:1017–1024. doi: 10.1111/jgs.15285. [DOI] [PubMed] [Google Scholar]
- 83.Tong M, Tieu L, Lee C T, Ponath C, Guzman D, Kushel M. Factors associated with food insecurity among older homeless adults: results from the HOPE HOME study. Journal of Public Health. 2018;41(2):240–249. doi: 10.1093/pubmed/fdy063. [DOI] [PMC free article] [PubMed] [Google Scholar]
- 84.Wattick, R. A., Hagedorn, R. L. & Olfert, M. D. Relationship between diet and mental health in a young adult Appalachian college population. Nutrients. 10(8), (2018). [DOI] [PMC free article] [PubMed]
- 85.Stuff JE, et al. Household food insecurity is associated with adult health status. J. Nutr. 2004;134:2330–2335. doi: 10.1093/jn/134.9.2330. [DOI] [PubMed] [Google Scholar]
- 86.Simmons LA, Modesitt SC, Brody AC, Leggin AB. Food insecurity among cancer patients in Kentucky: a pilot study. J. Oncol. Pract. 2006;2:274–279. doi: 10.1200/jop.2006.2.6.274. [DOI] [PMC free article] [PubMed] [Google Scholar]
- 87.Laraia BA, Borja JB, Bentley ME. Grandmothers, fathers, and depressive symptoms are associated with food insecurity among low-income first-time African-American mothers in North Carolina. J. Am. Diet. Assoc. 2009;109:1042–1047. doi: 10.1016/j.jada.2009.03.005. [DOI] [PMC free article] [PubMed] [Google Scholar]
- 88.Kalichman SC, et al. Health and treatment implications of food insufficiency among people living with HIV/AIDS, Atlanta, Georgia. J. Urban Health Bull. N. Y. Acad. Med. 2010;87:631–641. doi: 10.1007/s11524-010-9446-4. [DOI] [PMC free article] [PubMed] [Google Scholar]
- 89.Kalichman SC, et al. Food insecurity and antiretroviral adherence among HIV positive adults who drink alcohol. J. Behav. Med. 2014;37:1009–1018. doi: 10.1007/s10865-013-9536-3. [DOI] [PMC free article] [PubMed] [Google Scholar]
- 90.Gao X, Scott T, Falcon LM, Wilde PE, Tucker KL. Food insecurity and cognitive function in Puerto Rican adults. Am. J. Clin. Nutr. 2009;89:1197–1203. doi: 10.3945/ajcn.2008.26941. [DOI] [PMC free article] [PubMed] [Google Scholar]
- 91.Bermudez-Millan A, et al. Psychological distress mediates the association between food insecurity and suboptimal sleep quality in Latinos with type 2 diabetes mellitus. J. Nutr. 2016;146:2051–2057. doi: 10.3945/jn.116.231365. [DOI] [PMC free article] [PubMed] [Google Scholar]
- 92.Sharpe PA, Whitaker K, Alia KA, Wilcox S, Hutto B. Dietary intake, behaviors and psychosocial factors among women from food-secure and food-insecure households in the United States. Ethn. Dis. 2016;26:139–146. doi: 10.18865/ed.26.2.139. [DOI] [PMC free article] [PubMed] [Google Scholar]
- 93.Wong JC, et al. Food insecurity is associated with subsequent cognitive decline in the Boston Puerto Rican Health Study–3. J. Nutr. 2016;146:1740–1745. doi: 10.3945/jn.115.228700. [DOI] [PMC free article] [PubMed] [Google Scholar]
- 94.Austin AE, Smith MV. Examining material hardship in mothers: associations of diaper need and food insufficiency with maternal depressive symptoms. Health Equity. 2017;1:127–133. doi: 10.1089/heq.2016.0023. [DOI] [PMC free article] [PubMed] [Google Scholar]
- 95.Darling KE, Fahrenkamp AJ, Wilson SM, D’Auria AL, Sato AF. Physical and mental health outcomes associated with prior food insecurity among young adults. J. Health Psychol. 2017;22:572–581. doi: 10.1177/1359105315609087. [DOI] [PubMed] [Google Scholar]
- 96.Harrison PA, Sidebottom AC. Systematic prenatal screening for psychosocial risks. J. Health Care Poor Underserved. 2008;19:258–276. doi: 10.1353/hpu.2008.0003. [DOI] [PubMed] [Google Scholar]
- 97.Black MM, et al. WIC participation and attenuation of stress-related child health risks of household food insecurity and caregiver depressive symptoms. Arch. Pediatr. Adolesc. Med. 2012;166:444–451. doi: 10.1001/archpediatrics.2012.1. [DOI] [PubMed] [Google Scholar]
- 98.Jung, S. E., Kim, S., Bishop, A. & Hermann, J. Poor nutritional status among low-income older adults: examining the interconnection between self-care capacity, food insecurity, and depression. J. Acad. Nutr. Diet. Jun 16. pii: S2212–2672(18)30513–6 (2018). [DOI] [PubMed]
- 99.Sharkey JR, Johnson CM, Dean WR. Relationship of household food insecurity to health-related quality of life in a large sample of rural and urban women. Women Health. 2011;51:442–460. doi: 10.1080/03630242.2011.584367. [DOI] [PMC free article] [PubMed] [Google Scholar]
- 100.Brucker DL. Food security among young adults with disabilities in the United States: findings from the National Health Interview Survey. Disabil. Health J. 2016;9:298–305. doi: 10.1016/j.dhjo.2015.10.003. [DOI] [PubMed] [Google Scholar]
- 101.Allen NL, Becerra BJ, Becerra MB. Associations between food insecurity and the severity of psychological distress among African-Americans. Ethn. Health. 2018;23:511–520. doi: 10.1080/13557858.2017.1280139. [DOI] [PubMed] [Google Scholar]
- 102.Tseng KK, Park SH, Shearston JA, Lee L, Weitzman M. Parental psychological distress and family food insecurity: sad dads in hungry homes. J. Dev. Behav. Pediatr. JDBP. 2017;38:611–618. doi: 10.1097/DBP.0000000000000481. [DOI] [PubMed] [Google Scholar]
- 103.Clay Lauren, Papas Mia, Gill Kimberly, Abramson David. Factors Associated with Continued Food Insecurity among Households Recovering from Hurricane Katrina. International Journal of Environmental Research and Public Health. 2018;15(8):1647. doi: 10.3390/ijerph15081647. [DOI] [PMC free article] [PubMed] [Google Scholar]
- 104.Grandner MA, et al. Sleep symptoms, race/ethnicity, and socioeconomic position. J. Clin. Sleep Med. JCSM Off. Publ. Am. Acad. Sleep Med. 2013;9:897. doi: 10.5664/jcsm.2990. [DOI] [PMC free article] [PubMed] [Google Scholar]
- 105.Liu Y, Njai RS, Greenlund KJ, Chapman DP, Croft JB. Relationships between housing and food insecurity, frequent mental distress, and insufficient sleep among adults in 12 US States, 2009. Prev. Chronic. Dis. 2014;11:E37. doi: 10.5888/pcd11.130334. [DOI] [PMC free article] [PubMed] [Google Scholar]
- 106.Whinnery J, Jackson N, Rattanaumpawan P, Grandner MA. Short and long sleep duration associated with race/ethnicity, sociodemographics, and socioeconomic position. Sleep. 2014;37:601–611. doi: 10.5665/sleep.3508. [DOI] [PMC free article] [PubMed] [Google Scholar]
- 107.Ding M, Keiley MK, Garza KB, Duffy PA, Zizza CA. Food insecurity is associated with poor sleep outcomes among US adults. J. Nutr. 2015;145:615–621. doi: 10.3945/jn.114.199919. [DOI] [PubMed] [Google Scholar]
- 108.Becerra, M. B., Bol, B. S., Granados, R. & Hassija, C. Sleepless in school: the role of social determinants of sleep health among college students. J. Am. Coll. Health. 29, 1–7 (2018). [DOI] [PubMed]
- 109.Sterne JA, Gavaghan D, Egger M. Publication and related bias in meta-analysis: power of statistical tests and prevalence in the literature. J. Clin. Epidemiol. 2000;53:1119–1129. doi: 10.1016/s0895-4356(00)00242-0. [DOI] [PubMed] [Google Scholar]
- 110.Deeks JJ, Macaskill P, Irwig L. The performance of tests of publication bias and other sample size effects in systematic reviews of diagnostic test accuracy was assessed. J. Clin. Epidemiol. 2005;58:882–893. doi: 10.1016/j.jclinepi.2005.01.016. [DOI] [PubMed] [Google Scholar]
- 111.Nelson JM, Harwood H. Learning disabilities and anxiety: a meta-analysis. J. Learn. Disabil. 2011;44:3–17. doi: 10.1177/0022219409359939. [DOI] [PubMed] [Google Scholar]
- 112.Rock PL, Roiser JP, Riedel WJ, Blackwell AD. Cognitive impairment in depression: a systematic review and meta-analysis. Psychol. Med. 2014;44:2029–2040. doi: 10.1017/S0033291713002535. [DOI] [PubMed] [Google Scholar]
- 113.Cohen J. Statistical Power Analysis for the Behavioural Sciences. Hillsdale: Erlbaum; 1988. [Google Scholar]
- 114.Sullivan GM, Feinn R. Using effect size—or why the P value is not enough. J. Grad. Med. Educ. 2012;4:279–282. doi: 10.4300/JGME-D-12-00156.1. [DOI] [PMC free article] [PubMed] [Google Scholar]
Associated Data
This section collects any data citations, data availability statements, or supplementary materials included in this article.
Supplementary Materials
(PDF 90 kb)
(PDF 758 kb)
(PDF 382 kb)