Abstract
Background and Objective
Liver cancer is a common malignant tumor with few poor diagnostic and prognostic markers, which greatly shortens the potential life span of patients. The RNA-binding protein la ribonucleoprotein 4B (LARP4B) has a la motif (lam) that is important in the process of cancer. We aimed to explore the role of LARP4B in the diagnosis and prognosis of liver cancer.
Methods
The Cancer Genome Atlas (TCGA) database was searched to detect LARP4B gene expression in liver cancer. The clinical relevance and diagnostic ability of LARP4B were evaluated by a chi-squared test and a receiver operating characteristic (ROC) curve, respectively. Survival and risk factors of patients with liver cancer were assessed by survival analysis and univariate/multivariate Cox regression model. Additionally, we carried out gene set enrichment analysis (GSEA) to identify LARP4B-related signaling pathways in liver cancer.
Results
LARP4B mRNA was highly expressed in liver cancer tissues and was correlated with survival status. The chi-squared test showed that LARP4B had clinical relevance, while ROC curves showed that LARP4B had good diagnostic ability. Survival analysis showed that liver cancer patients with high LARP4B expression had shorter overall/relapse-free survival. The univariate/multivariate Cox regression model indicated that high LARP4B expression may be an independent risk factor for the prognosis of liver cancer patients. Finally, we found that genes involved in the G2M checkpoint, E2F targets, and mitotic spindle were differentially enriched in the high LARP4B-expression phenotype.
Conclusions
LARP4B is a potential independent biomarker for diagnosis and prognosis in liver cancer patients.
1. Introduction
Liver cancer is one of the most common malignant tumors in the world [1]. It has a high degree of malignancy, strong invasion and metastasis, and poor prognosis and poses a serious threat to health [2]. Although the number of tumor markers used in the diagnosis and prognosis of related cancers has increased, none have the high recognition, sensitivity, and specificity required to evaluate the condition, efficacy, and prognosis of liver cancer [3, 4]. There is an urgent need to identify biomarkers with diagnostic and prognostic accuracy.
La ribonucleoprotein 4B (LARP4B) is a member of the La-related protein (LARP) family [5]. LARP4B protein is an RNA-binding protein containing lanthanum and adjacent RNA recognition motifs (RRMs) [6], which allow it to participate in posttranscriptional control of RNA and play an important role in translation [7, 8]. LARP4B is involved in the progression of many cancers [9]. In gliomas, for example, LARP4B inhibits tumor progression [10]. However, its role in liver cancer has not been explored.
To assess the potential clinical role of LARP4B in liver cancer, we probed TCGA database for the mRNA expression of LARP4B in liver cancer patients. Chi-squared testing was used to assess clinical relevance, ROC curves were used to estimate diagnostic capability, and overall/relapse-free survival analyses were conducted to examine the impact of LARP4B on patients with liver cancer. Univariate/multivariate Cox regression models were used to identify risk factors associated with liver cancer. We also carried out GSEA about the LARP4B-related signaling pathways.
2. Materials and Methods
2.1. Data Source
We obtained currently available clinical and RNA sequence data about normal and liver cancer tissues from TCGA (https://cancergenome.nih.gov/). No ethical permission was required because all of the data used in this paper were made available for research.
2.2. Data Mining and Statistical Analyses
We used the R software environment (version 3.6.1) for data mining [11]. Boxplots of clinical features were drawn with the ggplot2 package [12]. The ROC curve was drawn by pROC [13], which is based on a series of different binary classifications (demarcation value or determination threshold), plotting the true positive rate (sensitivity) as the ordinate and the false positive rate (1-specificity) as the abscissa. Among them, the area under the ROC curve (AUC) is used to measure the diagnostic performance. The chi-squared test was used to identify possible clinical correlations between clinical features and LARP4B expression. We also used survival packages to plot survival curves, and a logarithmic rank test to check survival bias [14]. Univariate and multivariate Cox models were used to distinguish risk factors associated with liver cancer [15].
2.3. GSEA
GSEA is used to classify gene probes based on related biological pathways published in authoritative journals and coexpression data obtained from experiments. To determine correlation, a series of operations are carried out to determine whether the probes can reveal a distribution pattern of genes related to the phenotype of interest [16]. In this research, we used the gene set of “h.all.v6.2.symbols.gmt” from the Molecular Signatures Database to perform GSEA in GSEA 3.0 software. Through the analysis of 1,000 permutations, we obtained the standardized enrichment fraction and calculated a normalized enrichment score.
3. Results
3.1. Data Overview
The LARP4B expression level and clinical features of the TCGA liver cancer cohort include gender, age, histologic type and grade, sample type, T/N/M classification, radiation therapy, residual tumor, vital status, stage, and relapse (Table 1).
Table 1.
Demographic and clinical characteristics of the TCGA-LIHC cohort.
| Characteristics | Number of cases (%) |
|---|---|
| Age | |
| <55 | 117 (31.45) |
| ≥55 | 255 (68.55) |
| NA | 1 (0) |
| Gender | |
| Female | 121 (32.44) |
| Male | 252 (67.56) |
| Histological type | |
| Fibrolamellar carcinoma | 3 (0.8) |
| Hepatocellular carcinoma | 363 (97.32) |
| Hepatocholangiocarcinoma (mixed) | 7 (1.88) |
| Histologic grade | |
| NA | 5 (1.34) |
| G1 | 55 (14.75) |
| G2 | 178 (47.72) |
| G3 | 123 (32.98) |
| G4 | 12 (3.22) |
| Stage | |
| NA | 24 (6.43) |
| I | 172 (46.11) |
| II | 87 (23.32) |
| III | 85 (22.79) |
| IV | 5 (1.34) |
| T classification | |
| NA | 2 (0.54) |
| T1 | 182 (48.79) |
| T2 | 95 (25.47) |
| T3 | 80 (21.45) |
| T4 | 13 (3.49) |
| TX | 1 (0.27) |
| N classification | |
| NA | 1 (0.27) |
| N0 | 253 (67.83) |
| N1 | 4 (1.07) |
| NX | 115 (30.83) |
| M classification | |
| M0 | 267 (71.58) |
| M1 | 4 (1.07) |
| MX | 102 (27.35) |
| Radiation therapy | |
| NA | 25 (6.7) |
| No | 340 (91.15) |
| Yes | 8 (2.14) |
| Residual tumor | |
| NA | 7 (1.88) |
| R0 | 326 (87.4) |
| R1 | 17 (4.56) |
| R2 | 1 (0.27) |
| RX | 22 (5.9) |
| Vital status | |
| Deceased | 130 (34.85) |
| Living | 243 (65.15) |
| Sample type | |
| Primary tumor | 371 (99.46) |
| Recurrent tumor | 2 (0.54) |
| LARP4B | |
| High | 253 (67.83) |
| Low | 120 (32.17) |
Abbreviation: NA: not available.
3.2. LARP4B Expression in Normal and Liver Cancer Tissues
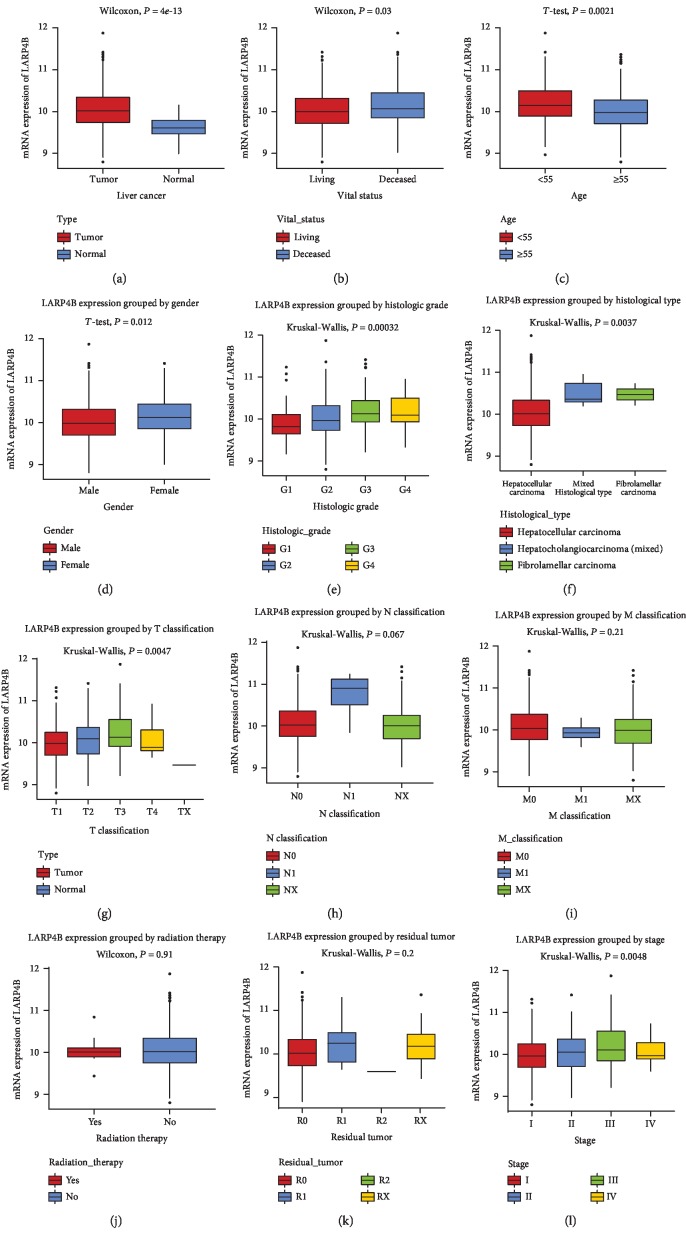
Boxplots showed higher LARP4B mRNA expression in liver cancer tissues compared with normal liver tissues (P = 4e‐13; Figure 1). Furthermore, there were significant differences in LARP4B expression with regard to vital status (P = 0.03), stage (P = 0.0046), gender (P = 0.012), age (P = 0.0021), histologic grade (P = 0.00032), type (P = 0.0037), and T classification (P = 0.047).
Figure 1.
Boxplots showing LARP4B expression according to clinical stage and tissue type.
3.3. Diagnostic Capability of LARP4B in Liver Cancer
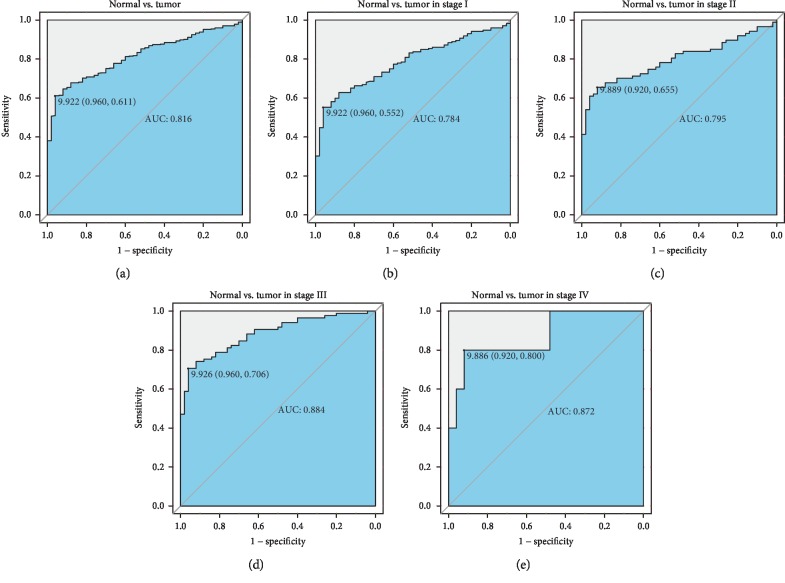
ROC curves revealed that AUC was 0.816, indicating that LARP4B might have considerable diagnostic ability (Figure 2(a)). This result was confirmed in subsequent subgroup analysis of the different stages (AUC: 0.784, 0.795, 0.884, and 0.872 for stage I, stage II, stage III, and stage IV, respectively; Figures 2(b)–2(e)).
Figure 2.
ROC curves of LARP4B expression in the TCGA-LIHC cohort. Normal liver vs. liver tumor samples (a). Normal liver vs. stage I (b), stage II (c), stage III (d), and stage IV (e) liver tumor samples. AUC: area under the curve; LIHC: liver hepatocellular carcinoma; ROC: receiver operating characteristic curve.
3.4. High LARP4B Expression Was Relevant to Clinical Features of Liver Cancer
As shown in Table 2, the expression of LARP4B was clearly related to age (P = 0.0274), gender (P = 0.0256), vital status (P = 0.0301), and histologic grade (P = 0.0003) of liver cancer patients.
Table 2.
Correlation between the expression of LARP4B and the clinic pathologic characteristics in liver cancer.
| Clinical characteristics | Variable | No. of patients | LARP4B expression | X 2 | P | |||
|---|---|---|---|---|---|---|---|---|
| High | % | Low | % | |||||
| Age | <55 | 117 | 89 | 35.32 | 28 | 23.33 | 4.8736 | 0.0273 |
| ≥55 | 255 | 163 | 64.68 | 92 | 76.67 | |||
| Gender | Female | 121 | 92 | 36.36 | 29 | 24.17 | 4.9824 | 0.0256 |
| Male | 252 | 161 | 63.64 | 91 | 75.83 | |||
| Histological type | Fibrolamellar carcinoma | 3 | 3 | 1.19 | 0 | 0 | 4.8737 | 0.0874 |
| Hepatocellular carcinoma | 363 | 243 | 96.05 | 120 | 100 | |||
| Hepatocholangiocarcinoma (mixed) | 7 | 7 | 2.77 | 0 | 0 | |||
| Histologic grade | G1 | 55 | 27 | 10.8 | 28 | 23.73 | 18.9592 | 0.0003 |
| G2 | 178 | 115 | 46 | 63 | 53.39 | |||
| G3 | 123 | 98 | 39.2 | 25 | 21.19 | |||
| G4 | 12 | 10 | 4 | 2 | 1.69 | |||
| Stage | I | 172 | 108 | 45.96 | 64 | 56.14 | 4.4368 | 0.218 |
| II | 87 | 59 | 25.11 | 28 | 24.56 | |||
| III | 85 | 64 | 27.23 | 21 | 18.42 | |||
| IV | 5 | 4 | 1.7 | 1 | 0.88 | |||
| T classification | T1 | 182 | 117 | 46.25 | 65 | 55.08 | 6.9572 | 0.1382 |
| T2 | 95 | 66 | 26.09 | 29 | 24.58 | |||
| T3 | 80 | 62 | 24.51 | 18 | 15.25 | |||
| T4 | 13 | 8 | 3.16 | 5 | 4.24 | |||
| TX | 1 | 0 | 0 | 1 | 0.85 | |||
| N classification | N0 | 253 | 174 | 69.05 | 79 | 65.83 | 2.6345 | 0.2679 |
| N1 | 4 | 4 | 1.59 | 0 | 0 | |||
| NX | 115 | 74 | 29.37 | 41 | 34.17 | |||
| M classification | M0 | 267 | 188 | 74.31 | 79 | 65.83 | 3.2303 | 0.1989 |
| M1 | 4 | 3 | 1.19 | 1 | 0.83 | |||
| MX | 102 | 62 | 24.51 | 40 | 33.33 | |||
| Radiation therapy | No | 340 | 233 | 97.08 | 107 | 99.07 | 0.5773 | 0.4474 |
| Yes | 8 | 7 | 2.92 | 1 | 0.93 | |||
| Residual tumor | R0 | 326 | 223 | 88.49 | 103 | 90.35 | 2.9922 | 0.3928 |
| R1 | 17 | 12 | 4.76 | 5 | 4.39 | |||
| R2 | 1 | 0 | 0 | 1 | 0.88 | |||
| RX | 22 | 17 | 6.75 | 5 | 4.39 | |||
| Sample type | Primary tumor | 371 | 252 | 99.6 | 119 | 99.17 | 0 | 1 |
| Recurrent tumor | 2 | 1 | 0.4 | 1 | 0.83 | |||
| Vital status | Deceased | 130 | 98 | 38.74 | 32 | 26.67 | 4.7032 | 0.0301 |
| Living | 243 | 155 | 61.26 | 88 | 73.33 | |||
3.5. Increased LARP4B Expression Was Related to Poor Overall Survival in Liver Cancer
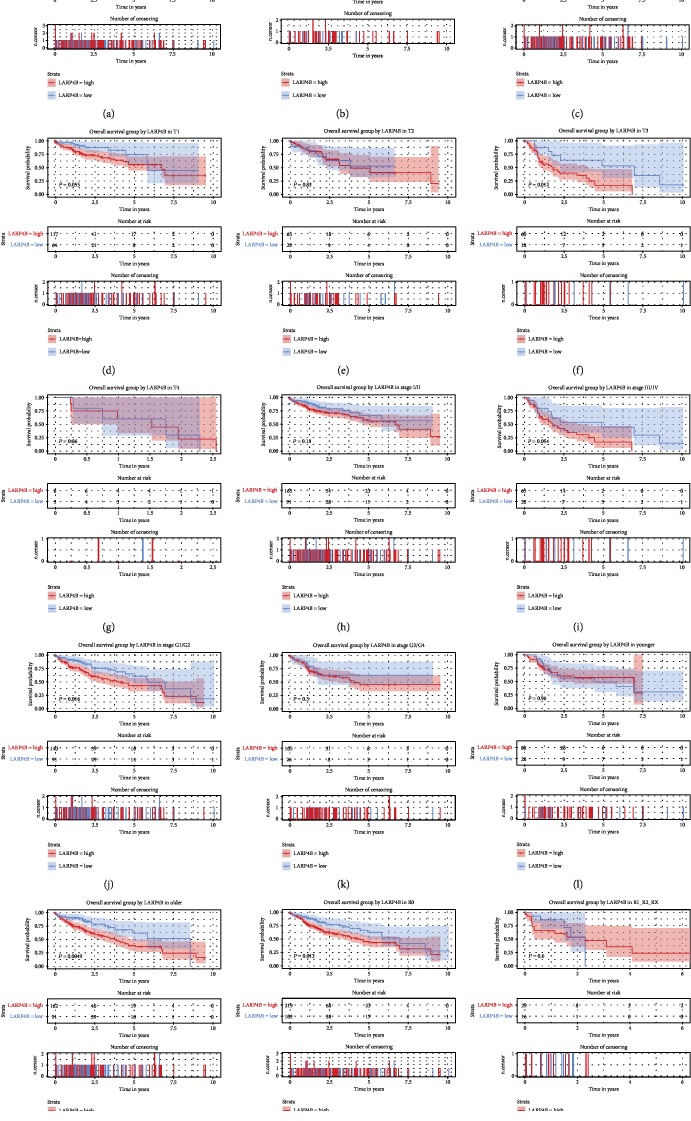
As shown in Figure 3, the high expression of LARP4B in patients was correlated with poor overall survival (P = 0.0095). Subgroup analysis showed that LARP4B expression had significant prognostic value in liver cancer patients who were older (P = 0.0049), T3 (P = 0.012), G1/G2 (P = 0.016), male (P = 0.01), and R0 (P = 0.013).
Figure 3.
Effect of LARP4B expression on overall survival in subgroups of patients with liver cancer. Kaplan-Meier curves of overall survival analysis (a) and subgroup analysis of gender (female and male) (b, c), T classification (T1/T2/T3/T4) (d–g), clinical stage (I/II and III/IV) (h, i), histologic grade (G1/G2 and G3/G4) (j, k), age (younger and older) (l, m), and lymph node dissection (R0 and R1/R2/RX) (n, o).
A univariate Cox model revealed that residual tumor, stage, T classification, and LARP4B expression represented potential survival-related variables. A multivariate Cox model suggested that a high LARP4B expression was a potential independent risk factor for patient's overall survival with liver cancer (95% confidence interval (CI) 1.1–2.46, P = 0.016, hazard ratio (HR) = 1.64; Table 3).
Table 3.
Summary of univariate and multivariate Cox regression analyses of overall survival duration.
| Parameters | Univariate analysis | Multivariate analysis | ||||
|---|---|---|---|---|---|---|
| Hazard ratio | 95% CI (lower~upper) | P value | Hazard ratio | 95% CI (lower-upper) | P value | |
| Age | 1 | 0.69-1.45 | 0.997 | |||
| Gender | 0.8 | 0.56-1.14 | 0.22 | |||
| Histological type | 0.99 | 0.27-3.66 | 0.986 | |||
| Histologic grade | 1.04 | 0.84-1.3 | 0.698 | |||
| Stage | 1.38 | 1.15-1.66 | 0.001 | 0.87 | 0.7-1.08 | 0.203 |
| T classification | 1.66 | 1.39-1.99 | 0 | 1.85 | 1.46-2.34 | 0 |
| N classification | 0.73 | 0.51-1.05 | 0.086 | |||
| M classification | 0.72 | 0.49-1.04 | 0.077 | |||
| Radiation therapy | 0.51 | 0.26-1.03 | 0.06 | |||
| Residual tumor | 1.42 | 1.13-1.8 | 0.003 | 1.39 | 1.08-1.78 | 0.01 |
| LARP4B | 1.69 | 1.13-2.52 | 0.01 | 1.64 | 1.1-2.46 | 0.016 |
3.6. Increased LARP4B Expression Was Related to Poor Relapse-Free Survival in Liver Cancer
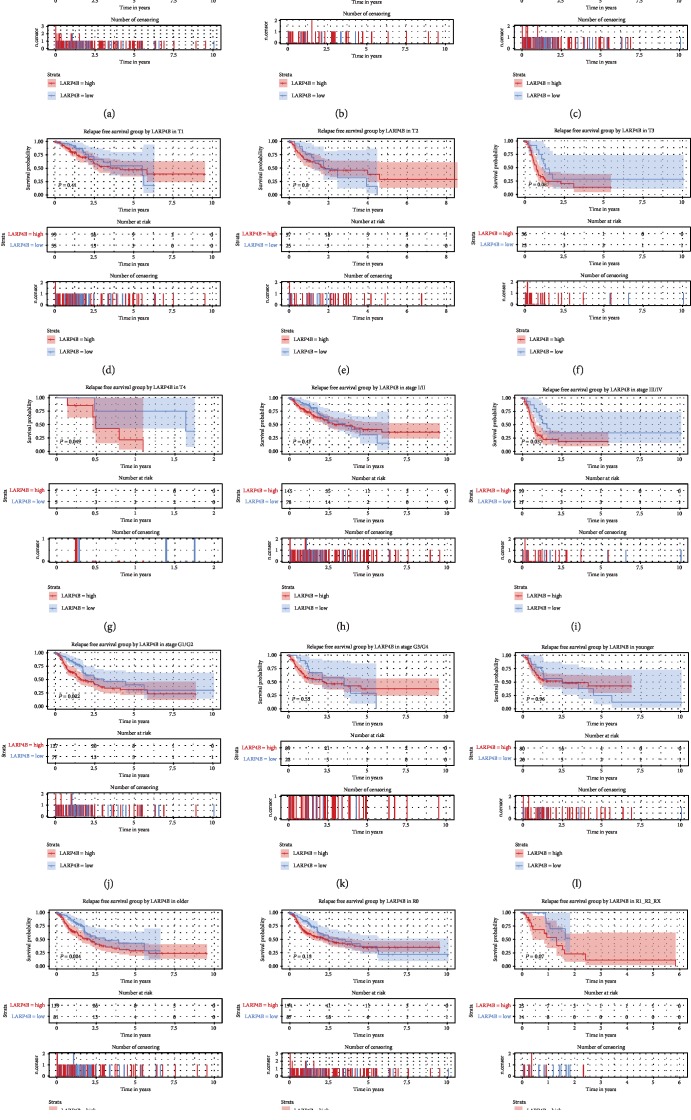
As shown in Figure 4, there was a high expression of LARP4B in patients with relapse-free survival (P = 0.044). Subgroup analysis showed that LARP4B expression had a prognostic value in liver cancer patients who were T4 (P = 0.049), male (P = 0.014), stage III/IV (P = 0.037), G1/G2 (P = 0.022), and older (P = 0.024).
Figure 4.
Effect of LARP4B expression on relapse-free survival in subgroups of patients with liver cancer. Kaplan-Meier curves of overall survival analysis (a) and subgroup analysis of gender (female and male) (b, c), T classification (T1/T2/T3/T4) (d–g), clinical stage (I/II and III/IV) (h, i), histologic grade (G1/G2 and G3/G4) (j, k), age (younger and older) (l, m), and lymph node dissection (R0 and R1/R2/RX) (n, o).
A univariate Cox model showed that residual tumor, stage, T classification, and LARP4B expression represented potential relapse-free survival-related variables. A multivariate Cox model suggested that a high LARP4B expression was a potential independent risk factor for relapse-free survival in liver cancer patients (95% CI 1–2.13, P = 0.048, HR = 1.46; Table 4).
Table 4.
Summary of univariate and multivariate Cox regression analyses of relapse-free survival duration.
| Parameters | Univariate analysis | Multivariate analysis | ||||
|---|---|---|---|---|---|---|
| Hazard ratio | 95% CI (lower~upper) | P value | Hazard ratio | 95% CI (lower~upper) | P value | |
| Age | 0.9 | 0.63-1.28 | 0.55 | |||
| Gender | 0.99 | 0.7-1.41 | 0.966 | |||
| Histological type | 2.02 | 0.66-6.24 | 0.22 | |||
| Histologic grade | 0.98 | 0.8-1.21 | 0.883 | |||
| Stage | 1.66 | 1.38-1.99 | 0 | 1.12 | 0.87-1.44 | 0.392 |
| T classification | 1.78 | 1.49-2.12 | 0 | 1.67 | 1.28-2.17 | 0 |
| N classification | 0.97 | 0.67-1.4 | 0.874 | |||
| M classification | 1.17 | 0.79-1.74 | 0.432 | |||
| Radiation therapy | 0.74 | 0.26-2.16 | 0.584 | |||
| Residual tumor | 1.28 | 1.01-1.61 | 0.042 | 1.31 | 1.03-1.67 | 0.026 |
| LARP4B | 1.46 | 1.01-2.11 | 0.045 | 1.46 | 1-2.13 | 0.048 |
3.7. LARP4B-Related Signaling Pathway
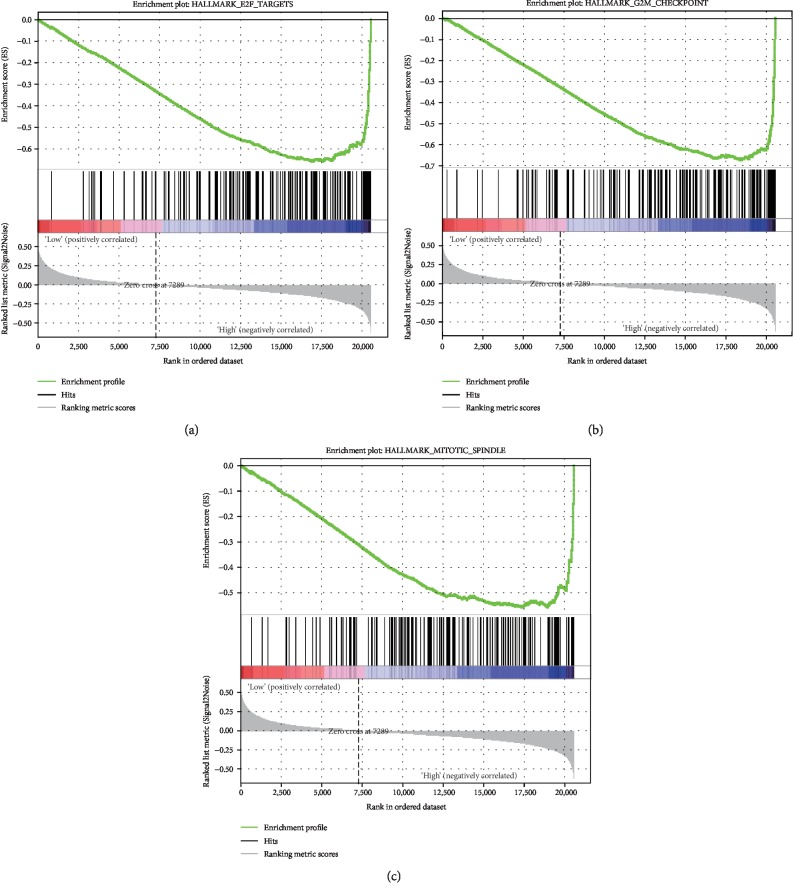
To identify the activated signal pathways in liver cancer, GSEA was conducted between the low LARP4B expression and high LARP4B expression datasets. GSEA revealed significant differences in the enrichment of the MSigDB Collection (h.all.v6.2.symbols.gmt; NOM P value < 0.05, FDR < 0.25; Table 5). Genes related to E2F, G2M, and the mitotic spindle (Figure 5; Table 5) were enriched in the high LARP4B expression phenotype, which may represent an intrinsic mechanism of poor prognosis.
Table 5.
Gene sets enriched in phenotype high.
| MSigDB collection | Gene set name | NES | NOM p val | FDR q val |
|---|---|---|---|---|
| h.all.v6.2.symbols.gmt | HALLMARK_MITOTIC_SPINDLE | -1.846927 | 0.005917 | 0.205141 |
| h.all.v6.2.symbols.gmt | HALLMARK_G2M_CHECKPOINT | -1.710802 | 0.016293 | 0.255083 |
| h.all.v6.2.symbols.gmt | HALLMARK_E2F_TARGETS | -1.583288 | 0.045643 | 0.40425 |
Notes: gene sets with NOM P value < 0.05 and FDR q value < 0.25 are considered as significant. Abbreviations: FDR: false discovery rate; NES: normalized enrichment score; NOM: nominal.
Figure 5.
Enrichment plots from GSEA. E2F targets, the G2M checkpoint, and the mitotic spindle pathway were differentially enriched in LARP4B-related liver cancer patients.
4. Discussion
Viral infection, diet, environmental problems, and other factors have contributed to the high mortality rate of liver cancer worldwide [17]. Continuous advances in surgical technology, chemotherapeutic drugs, and molecular biology have furthered our understanding of cancer biology, and there has been great progress in the treatment of liver cancer in recent years. In this study, we have applied our extensive experience in the exploration of novel biomarkers [18–23] to identify a biomarker, LARP4B, for the diagnosis and prognosis of patients with liver cancer.
The involvement of LARP4B has been documented in many cancer processes, including medulloblastoma [24], malignant peripheral nerve sheath tumors [25], colorectal cancer [26], pancreatic cancer [27], and glioma [10]. In contrast to our results, Koso et al. [10] found low expression of LARP4B in gliomas, which suggests that LARP4B may play different roles in different cancers. In addition, the boxplots showed that LARP4B expression was statistically significantly associated with vital status, age, gender, histologic grade and type, stage, and T classification. Therefore, it is necessary to further explore the role of LARP4B in liver cancer.
Low LARP4B expression was closely related to poor prognosis in glioma cancer patients in the study by Koso et al. [10]. No such relationship between LARP4B and prognosis has been found in liver cancer. In this study, we found that overexpressed LARP4B was associated with a poor prognosis in liver cancer patients, which may be attributable to the different functions of LARP4B in different tissues. LARP4B overexpression also led to shorter overall/relapse-free survival. Subgroup analysis of overall survival showed especially poor prognoses in patients who were male, T3, G1/G2, older, and R0, while relapse-free survival was correlated with patients who were male, T4, G1/G2, older, and stage III/IV. This distinction could be applied to the precise, individualized treatment of liver cancer patients. Calculation of AUC from the ROC curves showed the validity of clinical diagnostic testing of LARP4B. Our results suggest that LARP4B has strong potential as a marker in the clinical detection of liver cancer patients.
The progression of cancer requires a complete cell cycle [28]. Genes related to E2F, G2M, and the mitotic spindle are important signaling pathways in the cell cycle [29–31]. Interestingly, we found that E2F, G2M, and mitotic spindle signaling pathways were all involved in the progression of liver cancer. LARP4B is a posttranscriptional regulator and may regulate the roles of downstream genes through these three sets of target molecules. In addition, Zhang et al. [32] found that LARP4B may regulate the cell cycle of leukemia stem cells by inhibiting the expression of cell cycle inhibitors p16, P19, and p21 and myeloid-specific transcription factor CCAAT enhancer binding protein alpha. However, Mattijssen and Maraia [33] found that LARP4B participated in the regulation of TNF-alpha-TTP as its functional activity in MLL-AF9 leukemia stem cells. It is possible that LARP4B participates in the progression of different cancers through multiple signaling pathways.
As far as we know, this is the first study to examine the diagnostic and prognostic values of LARP4B expression in liver cancer. Together with other studies on the functions of LARP4B, we have contributed to a better understanding of the role of LARP4B and expanded the possibilities for more precise diagnosis and prognosis in cancer. We plan to continue exploring the functions of LARP4B to clarify its underlying mechanism in tumorigenesis at a deeper level.
5. Conclusion
In this investigation of LARP4B in the prognosis and diagnosis of liver cancer, we identified high LARP4B expression as a potential independent biomarker for negative prognosis. We have plans for complex experiments to explore the mechanism further.
Acknowledgments
We thank Michelle Kahmeyer-Gabbe, PhD, from Liwen Bianji, Edanz Editing China (http://www.liwenbianji.cn/ac), for editing the English text of a draft of this manuscript. The project was funded by the Bethune Program of Jilin University (2018A02), Jilin Department of Health (2018J061), and basic research fees.
Contributor Information
Yang Li, Email: ygli136@163.com.
Yanan Liu, Email: ynliu@jlu.edu.cn.
Data Availability
We obtained patient information from an open TCGA database. No private clinical studies or patient data were included in this study.
Conflicts of Interest
None of the authors have any conflicts of interest.
References
- 1.Siegel R. L., Miller K. D., Jemal A. Cancer statistics, 2019. CA: A Cancer Journal for Clinicians. 2019;69(1):7–34. doi: 10.3322/caac.21551. [DOI] [PubMed] [Google Scholar]
- 2.Cronin K. A., Lake A. J., Scott S., et al. Annual Report to the Nation on the Status of Cancer, part I: national cancer statistics. Cancer. 2018;124(13):2785–2800. doi: 10.1002/cncr.31551. [DOI] [PMC free article] [PubMed] [Google Scholar]
- 3.Li L., Wang H. Heterogeneity of liver cancer and personalized therapy. Cancer Letters. 2016;379(2):191–197. doi: 10.1016/j.canlet.2015.07.018. [DOI] [PubMed] [Google Scholar]
- 4.Dawkins J., Webster R. M. The hepatocellular carcinoma market. Nature Reviews Drug Discovery. 2019;18(1):13–14. doi: 10.1038/nrd.2018.146. [DOI] [PubMed] [Google Scholar]
- 5.Bonaldo M. F., Lennon G., Soares M. B. Normalization and subtraction: two approaches to facilitate gene discovery. Genome Research. 1996;6(9):791–806. doi: 10.1101/gr.6.9.791. [DOI] [PubMed] [Google Scholar]
- 6.Bousquet-Antonelli C., Deragon J. M. A comprehensive analysis of the La-motif protein superfamily. RNA. 2009;15(5):750–764. doi: 10.1261/rna.1478709. [DOI] [PMC free article] [PubMed] [Google Scholar]
- 7.Bayfield M. A., Yang R., Maraia R. J. Conserved and divergent features of the structure and function of La and La-related proteins (LARPs) Biochimica et Biophysica Acta (BBA) - Gene Regulatory Mechanisms. 2010;1799(5-6):365–378. doi: 10.1016/j.bbagrm.2010.01.011. [DOI] [PMC free article] [PubMed] [Google Scholar]
- 8.Castello A., Fischer B., Eichelbaum K., et al. Insights into RNA biology from an atlas of mammalian mRNA-binding proteins. Cell. 2012;149(6):1393–1406. doi: 10.1016/j.cell.2012.04.031. [DOI] [PubMed] [Google Scholar]
- 9.Stavraka C., Blagden S. The La-related proteins, a family with connections to cancer. Biomolecules. 2015;5(4):2701–2722. doi: 10.3390/biom5042701. [DOI] [PMC free article] [PubMed] [Google Scholar]
- 10.Koso H., Yi H., Sheridan P., et al. Identification of RNA-binding protein LARP4B as a tumor suppressor in glioma. Cancer Research. 2016;76(8):2254–2264. doi: 10.1158/0008-5472.can-15-2308. [DOI] [PubMed] [Google Scholar]
- 11.Team RDCJC. R : A language and environment for statistical computing. Vol. 14. Vienna, Austria: R Foundation for Statistical Computing; 2009. [Google Scholar]
- 12.Ginestet C. ggplot2: elegant graphics for data analysis. Journal of the Royal Statistical Society: Series A (Statistics in Society) 2011;174(1):245–246. doi: 10.1111/j.1467-985X.2010.00676_9.x. [DOI] [Google Scholar]
- 13.Robin X., Turck N., Hainard A., et al. pROC: an open-source package for R and S+ to analyze and compare ROC curves. BMC Bioinformatics. 2011;12(1):p. 77. doi: 10.1186/1471-2105-12-77. [DOI] [PMC free article] [PubMed] [Google Scholar]
- 14.Therneau T. M. A package for survival analysis in S. 2015. R Package Version. 2017;2:p. 280. [Google Scholar]
- 15.Therneau T. M., Grambsch P. M. Modeling Survival Data: Extending the Cox Model. Vol. 97. New York: Springer; 2000. [DOI] [Google Scholar]
- 16.Subramanian A., Tamayo P., Mootha V. K., et al. Gene set enrichment analysis: a knowledge-based approach for interpreting genome-wide expression profiles. Proceedings of the National Academy of Sciences of the United States of America. 2005;102(43):15545–15550. doi: 10.1073/pnas.0506580102. [DOI] [PMC free article] [PubMed] [Google Scholar]
- 17.Ryerson A. B., Eheman C. R., Altekruse S. F., et al. Annual Report to the Nation on the Status of Cancer, 1975-2012, featuring the increasing incidence of liver cancer. Cancer. 2016;122(9):1312–1337. doi: 10.1002/cncr.29936. [DOI] [PMC free article] [PubMed] [Google Scholar]
- 18.Jiao Y., Fu Z., Li Y., Meng L., Liu Y. High EIF2B5 mRNA expression and its prognostic significance in liver cancer: a study based on the TCGA and GEO database. Cancer Management and Research. 2018;10:6003–6014. doi: 10.2147/cmar.s185459. [DOI] [PMC free article] [PubMed] [Google Scholar]
- 19.Jiao Y., Fu Z., Li Y., Zhang W., Liu Y. Aberrant FAM64A mRNA expression is an independent predictor of poor survival in pancreatic cancer. PloS One. 2019;14(1):p. e0211291. doi: 10.1371/journal.pone.0211291. [DOI] [PMC free article] [PubMed] [Google Scholar]
- 20.Jiao Y., Li Y., Lu Z., Liu Y. High trophinin-associated protein expression is an independent predictor of poor survival in liver cancer. Digestive Diseases and Sciences. 2019;64(1):137–143. doi: 10.1007/s10620-018-5315-x. [DOI] [PubMed] [Google Scholar]
- 21.Almeida M. I., Nicoloso M. S., Zeng L., et al. Strand-specific miR-28-5p and miR-28-3p have distinct effects in colorectal cancer cells. Gastroenterology. 2012;142(4):886–896.e889. doi: 10.1053/j.gastro.2011.12.047. [DOI] [PMC free article] [PubMed] [Google Scholar]
- 22.Jiao Y., Li Y., Liu S., Chen Q., Liu Y. ITGA3 serves as a diagnostic and prognostic biomarker for pancreatic cancer. OncoTargets and Therapy. 2019;12:4141–4152. doi: 10.2147/ott.s201675. [DOI] [PMC free article] [PubMed] [Google Scholar]
- 23.Li Y., Jiao Y., Fu Z., Luo Z., Su J., Li Y. High miR-454-3p expression predicts poor prognosis in hepatocellular carcinoma. Cancer Management and Research. 2019;11:2795–2802. doi: 10.2147/cmar.s196655. [DOI] [PMC free article] [PubMed] [Google Scholar]
- 24.Wu X., Northcott P. A., Dubuc A., et al. Clonal selection drives genetic divergence of metastatic medulloblastoma. Nature. 2012;482(7386):529–533. doi: 10.1038/nature10825. [DOI] [PMC free article] [PubMed] [Google Scholar]
- 25.Rahrmann E. P., Watson A. L., Keng V. W., et al. Forward genetic screen for malignant peripheral nerve sheath tumor formation identifies new genes and pathways driving tumorigenesis. Nature Genetics. 2013;45(7):756–766. doi: 10.1038/ng.2641. [DOI] [PMC free article] [PubMed] [Google Scholar]
- 26.Takeda H., Wei Z., Koso H., et al. Transposon mutagenesis identifies genes and evolutionary forces driving gastrointestinal tract tumor progression. Nature Genetics. 2015;47(2):142–150. doi: 10.1038/ng.3175. [DOI] [PubMed] [Google Scholar]
- 27.Pérez-Mancera P. A., Rust A. G., van der Weyden L., et al. The deubiquitinase USP9X suppresses pancreatic ductal adenocarcinoma. Nature. 2012;486(7402):266–270. doi: 10.1038/nature11114. [DOI] [PMC free article] [PubMed] [Google Scholar]
- 28.Icard P., Fournel L., Wu Z., Alifano M., Lincet H. Interconnection between metabolism and cell cycle in cancer. Trends in Biochemical Sciences. 2019;44(6):490–501. doi: 10.1016/j.tibs.2018.12.007. [DOI] [PubMed] [Google Scholar]
- 29.Fischer M., Muller G. A. Cell cycle transcription control: DREAM/MuvB and RB-E2F complexes. Critical Reviews in Biochemistry and Molecular Biology. 2017;52(6):638–662. doi: 10.1080/10409238.2017.1360836. [DOI] [PubMed] [Google Scholar]
- 30.Fraschini R. Factors that control mitotic spindle dynamics. Advances in Experimental Medicine and Biology. 2017;925:89–101. doi: 10.1007/5584_2016_74. [DOI] [PubMed] [Google Scholar]
- 31.Krempler A., Deckbar D., Jeggo P. A., Lobrich M. An Imperfect G2M Checkpoint Contributes to Chromosome Instability Following Irradiation of S and G2Phase Cells. Cell Cycle. 2007;6(14):1682–1686. doi: 10.4161/cc.6.14.4480. [DOI] [PubMed] [Google Scholar]
- 32.Zhang Y., Peng L., Hu T., et al. La-related protein 4B maintains murine MLL-AF9 leukemia stem cell self-renewal by regulating cell cycle progression. Experimental Hematology. 2015;43(4):309–318.e302. doi: 10.1016/j.exphem.2014.12.003. [DOI] [PubMed] [Google Scholar]
- 33.Mattijssen S., Maraia R. J. LARP4 is regulated by tumor necrosis factor alpha in a tristetraprolin-dependent manner. Molecular and Cellular Biology. 2016;36(4):574–584. doi: 10.1128/mcb.00804-15. [DOI] [PMC free article] [PubMed] [Google Scholar]
Associated Data
This section collects any data citations, data availability statements, or supplementary materials included in this article.
Data Availability Statement
We obtained patient information from an open TCGA database. No private clinical studies or patient data were included in this study.


