

Abstract
Potential applications of cell-free DNA (cfDNA)–based molecular profiling have used in patients with diverse malignant tumors. However, capturing all cfDNA that originates from tumor cells and identifying true variants present in this minute fraction remain challenges to the widespread application of cfDNA-based liquid biopsies in the clinical setting. In this study, we evaluate a systematic approach and identify key components of wet bench and bioinformatics strategies to address these challenges. We found that concentration of enrichment oligonucleotides, elements of the library preparation, and the structure of adaptors are critical for achieving high enrichment of target regions, retaining variant allele frequencies accurately throughout all involved steps of library preparation, and obtaining high variant coverage. We developed a dual molecular barcode–integrated error elimination strategy to remove sequencing artifacts and a background error correction strategy to distinguish true variants from abundant false-positive variants. We further describe a clinical application of this cfDNA-based duplex sequencing approach that can be used to monitor disease progression in patients with stage IV colorectal cancer. The findings also suggest that cfDNA-based molecular testing observations are highly concordant with observations obtained by traditional imaging methods. Overall, the findings presented in this study have potential implications for early detection of cancer, identification of minimal residual disease, and evaluation of therapeutic responses in patients with cancer.
Liquid biopsy–based molecular profiling can identify comprehensive genomic abnormalities in primary tumors and distant metastases.1, 2, 3 However, numerous technical challenges remain in the development of liquid biopsy–based molecular testing for clinical use.4, 5 Tumor cells undergoing apoptosis or necrosis or through active secretion tend to release DNA fragments into the circulation, of approximately ≤166 bp, and these fragments are often referred to as circulating tumor DNA.6, 7, 8, 9 In plasma, tumor-released cell-free DNA (cfDNA) is diluted into an abundant cfDNA fraction arising from nontumor cells. Therefore, capturing and retaining the much less abundant cfDNA fraction released from tumor cells throughout all the stages involved in the preparation of sequencing ready libraries are challenging.
Background errors originate predominantly from DNA-damaging events to which the sample is subjected during extraction, library generation, or sequencing.5, 10, 11, 12, 13, 14 Such errors may contribute to false-positive variants, which tend to occur most frequently at low allelic frequencies.15, 16 Tumor-derived cfDNA constitutes only a minor fraction of the total cfDNA pool in plasma; therefore, it is highly likely that mutations present in the tumor-derived cfDNA also occur at lower allelic frequencies.17 Accurately distinguishing a true variant from a background error that also can be present at low frequency poses another technical challenge in developing cfDNA-based molecular diagnostics for clinical applications.18
Colorectal cancer is the third most frequently diagnosed cancer type worldwide and the second leading cause of cancer-related deaths. In approximately 20% of patients, this disease is diagnosed when it has already metastasized to the lungs, liver, and lymph nodes. Primary treatment options include chemotherapy, which induces a <10% response rate.19 In these patients, the disease is monitored using conventional diagnostic imaging technologies, such as magnetic resonance imaging and computed tomography. To evaluate disease progression in patients with metastases, imaging analysis of distant organs is required. In contrast, a single cfDNA-based molecular test is theoretically able to provide a comprehensive assessment of disease status for the whole body. Therefore, liquid biopsy–based monitoring of disease in patients with colorectal cancer potentially can offer an unprecedented advantage compared with traditional imaging-based approaches.20, 21, 22, 23, 24, 25, 26, 27
In this study, we designed a colorectal cancer–specific next-generation sequencing panel that can be used for monitoring disease progression in patients with colorectal cancer. We adopted a systematic approach and improved critical steps in the generation of sequencing libraries to preserve the tumor-released cfDNA fragments more efficiently throughout all stages of processing. We also developed a comprehensive bioinformatics pipeline that uses dual molecular barcode sequence integration to eliminate any artifacts accrued in the sequences, an optimized variant calling algorithm to identify low-frequency variants, and a background error correction strategy that distinguishes true variants from false-positive variants. Lastly, we found that this cfDNA-based molecular assay can be used to monitor disease progression in patients with stage IV colorectal cancer.
Materials and Methods
Panel Design
Sequencing data were examined from a cohort of 2906 patients with colorectal cancer. Using this information, a panel that spans 78.81 kb (referred to as CRC23) and covers 85% of the most frequently mutated targets in this cohort was designed (Supplemental Figure S1). All coding exons of TP53, APC, KRAS, NRAS, BRAF, PIK3CA, and ERBB2 and hotspot coding exons from 16 other genes are covered in this panel.
Patient Samples
Blood specimens were collected from 32 patients with colorectal adenocarcinoma after obtaining informed consent. All samples used in this study were from patients with stage IV disease; additional features associated with this patient cohort are provided in Supplemental Table S1. Blood samples were collected in Vacutainer tubes coated with K2EDTA, and plasma was separated within 2 to 4 hours of specimen collection by centrifuging at 400 × g for 10 minutes and stored at −80°C. Plasma from healthy donors was obtained from the institutional blood bank under an approved institutional review board protocol. Culture supernatants from the MOLT-4, HT-29, DLD-1, and OCI-AML3 cell lines were centrifuged at 400 × g for 10 minutes and stored at −80°C.
Isolation of cfDNA
Frozen plasma samples or cell culture supernatants were thawed in a room temperature water bath and centrifuged at 1600 × g for 10 minutes to remove precipitated debris. From the clear cell culture supernatants, cfDNA was isolated by an automated extraction method using the QIAsymphony DSP Circulating DNA Kit on QIAsymphony following guidelines provided by the vendor (Qiagen, Germantown, MD). From the patients' plasma samples, cfDNA was isolated by a manual extraction method using a QIAamp Circulating Nucleic Acid Kit (Qiagen). cfDNA that was extracted by manual methods often contained high-molecular-weight genomic DNA. Therefore, on these cfDNA samples, size selection was performed, contaminating genomic DNA was removed, and 166-bp fragments of cfDNA were retained. Briefly, 50 μL of cfDNA was mixed with 35 μL of SPRIselect beads (Beckman Coulter Inc, Brea, CA), incubated at room temperature for 15 minutes, and further incubated on a magnetic plate for 10 minutes. Clear supernatant was collected, and beads bound to the genomic DNA were discarded. Supernatant was mixed with 65 μL of SPRIselect beads, incubated at room temperature for 15 minutes, and further incubated on a magnetic plate for 10 minutes. Then, supernatants were discarded, and beads were washed twice with 200 μL of 85% alcohol and air dried at room temperature for 10 minutes; cfDNA was eluted in 56 μL of 10 mmol/L Tris-Cl, pH 8.0, and stored at −20°C.
Preparation of Sequencing Library
Libraries were prepared using the NEBNext Ultra II DNA Library Prep Kit (New England Biolabs, Ipswich, MA) with the following modifications. Molecular barcode–containing adaptor sequences were synthesized as a single-strand DNA (IDT Technologies, Coralville, IA) and assembled by annealing in 30 mmol/L HEPES, pH 7.5, and 100 mmol/L potassium acetate buffer. Single molecular barcode–yielding adaptors assembled in this manner were used directly in downstream ligation reactions. However, to obtain dual molecular barcode–yielding adaptors, adaptor gap filling and dT-tailing were performed with NEBNext End-Repair Module and Klenow Fragment (3′→5′ exo-) (New England Biolabs), respectively. A total of 5 to 30 ng of cfDNA in 50 μL was mixed with 7 μL of end-repair reaction buffer and 3 μL of end-repair enzyme mix and incubated at 20°C for 45 minutes. After incubation, enzyme components were inactivated by heating at 65°C for 30 minutes. For each 30 μL of end-repair reaction volume, 2.5 μL of 30 ng/μL adaptor, 30 μL of ligation enzyme mix, and 1 μL of ligation enhancer were added and incubated at 20°C for 30 minutes. Then, 3 μL of USER enzyme mix was added and incubated at 37°C for 20 minutes, and adaptor ligated cfDNA was purified using SPRIselect beads. Briefly, 60 μL of SPRI beads were mixed with 66.5 μL of library reaction components and incubated at room temperature for 5 minutes and on a magnetic plate for an additional 10 minutes. Bead-free supernatants were removed, leaving approximately 15 μL of solution to prevent the loss of library-bound beads. Beads were washed twice with 200 μL of 85% alcohol and air dried at room temperature for 10 minutes, and the library was eluted in 40 μL of 10 mmol/L Tris-Cl, pH 8.0.
Postlibrary Preparation Amplification
Adaptor-ligated cfDNA templates were amplified in a PCR before enriching target regions through hybridization capture. Briefly, reactions were assembled in 100 μL by mixing 50 μL of NEBNext Ultra II Q5 Master Mix, 14 μL of 10 μmol/L forward and reverse primer mix, and 36 μL of adapter ligated cfDNA. PCR amplification was performed in three stages. In the first stage, initial denaturation was performed at 98°C for 30 seconds; in the second stage, sequential incubations were performed at 98°C for 10 seconds, 85°C for 1 second, and 68°C for 6 minutes for a total of 10 cycles; and in the third stage, final extension was conducted at 68°C for 5 minutes and samples were held finally at 4°C. (In the second stage, during the 85°C to 68°C transition, a ramp rate of 0.2°C/second was used.) PCR amplification products were purified using SPRIselect beads; 90 μL of beads were mixed with 100 μL of PCR products, and purification was performed following the steps described earlier.
Target Regions Hybridization Capture
As described earlier, after end repair the final volume of 60 μL was divided into two tubes, and subsequent steps were performed independently in each tube. The resultant amplification reactions (n = 2) from the same sample were pooled after purification, and the DNA library concentration was quantified using Qubit (Thermo Fisher Scientific, Waltham, MA). DNA blocker mix was prepared by adding 2.5 μL of 10 μg/μL of salmon sperm DNA, 2.5 μL of 1 μg/μL of cot-1 DNA, and 0.6 μL of 1000 μmol/L adaptor blockers. A DNA library of 500 to 1000 ng was concentrated into 5.6 μL by vacuum centrifugation, mixed with 3.4 μL of DNA blocker mix, and incubated at 95°C for 5 minutes and 65°C for 10 minutes. RNA baits hybridization mix was prepared by adding 13 μL of hybridization buffer (6.63 μL of 20× saline–sodium phosphate–EDTA, 0.27 μL of 0.5 mol/L EDTA, 2.65 μL of 50× Denhardt's solution, and 3.45 μL of 0.76% SDS), 2 μL of RNase blocking solution [0.5 μL of SUPERase-In RNase inhibitor (20 U/μL) and 1.5 μL of nuclease-free water], and 5 μL of enrichment baits solution (1.5 ng/μL); this mix was incubated at 65°C for 5 minutes. At the end of the incubation period, 20 μL of enrichment baits capture mix was transferred to the DNA library and blocker mix, and incubation was continued at 65°C for 16 hours.
Streptavidin C1 beads were prepared in advance for binding by washing 50 μL of beads with 200 μL of binding buffer (10 mL of 5 mol/L NaCl, 0.5 mL of 1 mol/L Tris-Cl, pH 7.5, 0.1 mL of 0.5 mol/L EDTA, and 39.4 mL of nuclease-free water) three times, and beads were finally resuspended in 200 μL of binding buffer. At the end of 16 hours of incubation at 65°C, approximately 26 μL of hybridization capture mixture were added to 200 μL of previously prepared streptavidin beads and incubated on a mixer at 1600 rpm for 1 hour. Subsequently, beads were washed with wash 1 buffer (2.5 mL of 20× SSC, 0.5 mL of 10% SDS, and 47 mL of nuclease-free water) at room temperature for 15 minutes, and a total of four washes were performed with wash 2 buffer (0.25 mL of 20× SSC, 0.5 mL of 10% SDS, and 49.25 mL of nuclease-free water) at 65°C incubation for 10 minutes during each wash. Beads were resuspended in 30 μL of 0.1 N NaOH and incubated at room temperature for 10 minutes to elute target DNA from the streptavidin beads. The elute was neutralized with 30 μL of 1 mol/L Tris-Cl, pH 7.5, DNA was purified with 120 μL of SPRIselect beads following the steps described earlier, and finally DNA was eluted in 44 μL of 10 mmol/L Tris-Cl, pH 8.0.
Post–Hybridization Capture Amplification
Enriched DNA targets were amplified in PCR. Briefly, reactions were assembled in 100 μL by mixing 50 μL of NEBNext Ultra II Q5 Master Mix, 10 μL of 10 μmol/L Illumina index primer mix, and 40 μL of DNA elute from hybridization capture. PCR amplification was performed in four stages. In the first stage, initial denaturation was performed at 98°C for 30 seconds. In the second stage, sequential incubations were performed at 98°C for 10 seconds, 85°C for 1 second, and 68°C for 6 minutes for a total of 10 cycles. In the third stage, an additional four cycles of amplification were performed at 98°C for 10 seconds, 85°C for 1 second, and 68°C for 90 seconds. In the fourth stage, final extension was conducted at 68°C for 5 minutes and samples were held finally at 4°C. (During the 85°C to 68°C transition, a ramp rate of 0.2°C/second was applied.) PCR amplification products were purified using SPRIselect beads following the steps described earlier, and DNA libraries were eluted in 100 μL of 10 mmol/L Tris-Cl, pH 8.0. These DNA libraries were double size selected with 0.56×/0.85× SPRI beads as described earlier and finally eluted in 40 μL of 10 mmol/L Tris-Cl, pH 8.0.
Sequencing
Libraries were quantified on the 4200 TapeStation system (Agilent Technologies, Santa Clara, CA); typically, the library concentrations were in the range of 2 to 5 nmol/L. A total of 21 indexed libraries (including a positive control library and a negative control library) were pooled, denatured, and diluted to a final concentration of 2.2 pmol/L following guidelines provided by the vendor (Illumina, San Diego, CA). Libraries created by diluting a mutant cfDNA pool (MOLT-4, HT-29, and DLD-1) into control cfDNA (OCI-AML3) at 1% frequency were used as a positive control, and a library from healthy donor cfDNA was used as a negative control in each sequencing run. Pooled libraries were mixed with PhiX library at a 4:1 ratio and sequenced on Nextseq550 using a high output flow cell (Illumina).
Sequencing Data Analysis
Consensus Sequence Derivation
The first 14-nucleotide molecular barcode information from the sequencing reads in forward FASTQ file and the corresponding reads in reverse FASTQ file were combined with a custom bioinformatics pipeline. The resulting 28-nucleotide molecular barcode was used to replace the original index of the sequencing read in forward file and the corresponding index of the sequencing read in reverse file. Sequencing reads that shared the same molecular barcode index were referred to as a family. The reads that belonged to a family were grouped together, and from these reads a single consensus sequence (SCS) was derived. For a chosen position, if the same nucleotide was present across all the reads of the family, it was chosen to represent that position in the consensus read. For those positions having more than one nucleotide type across all the reads of the family, the ambiguity was represented in the consensus read with the letter N. SCSs were derived independently for the families in forward and reverse sequencing files, and these derived reads were used as templates for subsequently generating double consensus sequences (DCSs). Asymmetric adaptors used in this study supposedly yield top template strand–generated sequences with αβ orientation of the molecular barcode index (the first 14-nucleotide sequence of molecular barcode is referred to as α and the second half of the 14-nucleotide sequence of molecular barcode is referred to as β), and the bottom template strand generated sequences with βα orientation of the molecular barcode index (Supplemental Figure S2). An SCS read having an αβ-oriented molecular barcode index in the forward file was grouped with an SCS read that had a βα-oriented molecular barcode index in the reverse file, and the DCS read was derived using the guidelines outlined earlier and written to a forward file by assigning the molecular barcode index in αβ orientation. Then an SCS read having the same αβ-oriented molecular barcode index in the reverse file was grouped with an SCS read that had a βα-oriented molecular barcode index in the forward file; DCS read was derived and written to a reverse file by keeping the molecular barcode index in αβ orientation. Under circumstances when an SCS read with αβ-oriented molecular barcode index either in forward or reverse file did not contain a mate SCS read with βα-oriented molecular barcode index in reverse or forward file, respectively, those SCS reads were omitted while creating DCS read files.
Variant Identification
SCS reads that were derived from families that contained two or more reads were used for variant identification because errors accrued in one-read families cannot be corrected. SCS reads were aligned to human reference genome (hg19), and identification and annotation of variants were conducted using NextGENe software version 4.1.2 (SoftGenetics, State College, PA). The unaligned nucleotides from the 5′ and 3′ ends of the sequencing reads were soft clipped, and the variants were identified by providing a BED file that consisted of chromosomal position coordinates of target regions of interest. Following the same approach, DCS reads were also aligned and variants were identified. The optimized settings in NextGENe that would allow identifying variants at low frequencies were chosen. Sequencing coverage of target regions was also determined using a BED file that specifies the chromosomal position coordinates.
Background Error Elimination
Nine healthy donor plasma cfDNA libraries were sequenced, and variants occurring at a frequency <20% were considered to be background error. A position-specific error model was created (Supplemental Figure S3). Variant allele frequencies in the test samples were evaluated based on gaussian distribution modeled variant frequencies in control samples. If the variant frequencies were determined to be in error, the values were adjusted to zero to eliminate the error. Additional conditions applied for correcting the variant frequency errors in test samples were as follows: for chromosome positions at which the variant was occurring, the variant allele count was <4, the read balance ratio was <0.1, and the ratio of variant frequency in test sample to control value from the gaussian distribution model was less than twofold different.
Results
Optimization of Enrichment Baits Improves On-Target Hybridization Capture Efficiency
Each sequencing-ready library was prepared in four stages, with the stages essentially being library preparation, postlibrary amplification, hybridization capture of target regions of interest, and posthybridization capture amplification (Figure 1). The steps involved in each of these stages were optimized to preserve the initial variant allele frequencies throughout all stages of library generation. It was reasoned that the final sequencing library quality and quantity are critically influenced by proportions of DNA target and enrichment baits used during hybridization capture of target molecules of interest. Therefore, the quantities of enrichment baits critical to assay performance were first evaluated by performing hybridization capture with various quantities of enrichment baits (Figure 2, Table 1). After sequencing the libraries from these enrichments, 180 ng of baits compared with 500 ng of baits as well as 60 ng of baits compared with 180 ng of baits yielded higher sequencing coverage of target regions. This higher sequencing coverage was accompanied by higher on-target percentages (Table 1). Furthermore, 20-ng baits compared with 60-ng baits yielded a higher on-target rate, although they did not strikingly improve sequencing coverage. The observations were similar when baits were serially diluted from 60 to 7.5 ng and used in hybridization capture (Figure 2, Table 1). During the panel design, 2× tiled probe sequences were created, indicating that each 60-bp target region was covered by overlapping two-probe sequences. Therefore, each half of the probe at the boundaries of the target region would be involved in enriching target flanking regions. To accommodate target flanking regions in the on-target rate calculations, an additional 200-bp flanking region was added to the target sequences, and this adjustment yielded higher on-target percentages (Table 1). Greater than 80% on-target enrichment was noticed with 7.5 ng of enrichment baits, and this concentration of enrichment baits was used thereafter for all hybridizations. These findings suggest that on-target enrichment is critically influenced by the quantity of enrichment baits used during the hybridization capture stage.
Figure 1.

The key library preparation stages of the CRC23 assay. The following steps were performed sequentially: cell-free DNA (cfDNA) end repair and A-tailing, hairpin adaptor ligation, uracil base excision, first PCR amplification, hybridization capture of target regions, and second PCR amplification. The second PCR amplification was performed using primers containing sample indexes, and those indexed samples were pooled and sequenced on Nextseq550.
Figure 2.

Optimization of enrichment baits improves hybridization capture efficiency. A and B: Differential read counts indicating relative depth in the coverage of target regions at any two tested concentrations of enrichment baits. Note that the absolute read counts from individual target regions were normalized and denoted as read counts per 100-bp target region. Differential read counts were calculated by subtracting normalized read counts from two successive bait concentrations used in the assay. In each comparison, normalized read counts from high concentration of baits were regarded as control and those from low concentration as test entities. Note that the target regions (x-axis) were ordered on the basis of highest to lowest differential read counts (y-axis) observed from 60- versus 20-ng baits comparison (A) and 15- versus 7.5-ng baits comparison (B).
Table 1.
Enrichment Baits Concentration Optimization Yields High On-Target Recovery of the Target Regions
| Quantity of baits in hybridization capture, ng | On-target capture, % | On-target capture (with 200-bp additional padding), % |
|---|---|---|
| 500 | 30.25 | 38.21 |
| 180 | 46.84 | 58.04 |
| 60 | 63.39 | 76.24 |
| 20 | 66.73 | 79.43 |
| 60 | 60.76 | 74.35 |
| 30 | 66.33 | 79.67 |
| 15 | 63.98 | 75.93 |
| 7.5 | 71.90 | 84.37 |
The on-target rate was calculated by dividing the mapped read coverage of target regions by the total mapped reads coverage.
Steps Critical to Incorporating Low-Frequency Variant Encoding cfDNA Templates into a Sequencing Library
Identifying the conditions that maximize incorporation of cfDNA templates into libraries is critical for ultrasensitive detection of true variants present at low allelic frequencies. A cfDNA pool was created by mixing cfDNA harvested from the MOLT-4, HT-29, and DLD-1 cell lines (mutant) and the OCI-AML3 line (control, negative for the variants present in the mutant pool) at 2%, 1%, 0.2%, and 96.8% proportions, respectively. In this cfDNA mix, the expected BRAF V600E variant allelic frequency was 0.5% (Figure 3A). Using this cfDNA mix, libraries were generated under various conditions (Table 2), and the preenrichment and postenrichment libraries were evaluated through droplet digital PCR–based detection of the BRAF V600E variant (Figure 3B and C). In comparison with the BRAF V600E variant frequency in the original cfDNA template pool, reduced frequencies in libraries that were prepared under conventional conditions were found (Figure 3B and C). End-repair reaction mixture carryover into the ligation mixture might hamper ligation efficiency and may affect variant allelic frequencies. To test this hypothesis, an additional purification step was integrated after the end-repair reaction (Table 2). Libraries prepared after this additional purification also yielded a reduced frequency of the BRAF V600E variant (Figure 3B and C) compared with its frequency in the original template pool used for library construction. To mitigate the inhibitory effect of end-repair components on the ligation mixture, the dilution of end-repair reaction components were evaluated before mixing with the ligation mixture; this modification was also accompanied by reduction in the BRAF V600E variant frequency (Figure 3B and C). Another variation tested was adding half of the end-repair reaction final components to the ligation mixture; concordant variant allele frequencies were seen between the original cfDNA template and preenrichment and postenrichment libraries that were prepared after this modification (Figure 3B and C). In conclusion, our findings illustrate a key modification that is a prerequisite for preserving variant allele frequencies accurately throughout multiple stages of library preparation.
Figure 3.

Optimization of critical steps involved in the library preparation improves accuracy of identified variant allele frequencies. A: Preparation of a mutant cell-free DNA (cfDNA) pool for library generation. The cfDNAs from MOLT-4, HT-29, DLD-1 (mutant), and OCI-AML3 (control) cell lines were mixed at 2%, 1%, 0.2%, and 96.8% frequencies, respectively. Note that in this mutant pool the expected frequency of BRAF V600E is 0.5%. First (B, 1–4) and second (C, 1–4) PCR amplification products with BRAF V600E droplet digital PCR assay were evaluated. Note that the observed BRAF V600E frequency in the original cfDNA was similar to the frequencies observed in the amplification products from the fourth library preparation workflow. Results from one of the two independent experiments are shown. MAF, mutant allele frequency; Wt, wild type.
Table 2.
An Outline of Four Different Library Preparation Workflows Evaluated in This Study
| Variable | Library preparation workflow |
|||
|---|---|---|---|---|
| 1 | 2 | 3 | 4 | |
| Input cfDNA quantity, ng | 30 | 30 | 30 | 30 |
| End-repair reaction volume, μL | 60 | 60 | 60 | 60 |
| Post–end-repair purification | − | + | − | − |
| End-repair carryover volume, μL | 60 | 60 | 30 (3A) and 30 (3B) | 30 (4A) and 30 (4B) |
| 10 mmol/L Tris-Cl, μL | 30 (3A) and 30 (3B) | |||
| Ligation mix volume, μL | 30 | 30 | 30 (3A) and 30 (3B) | 30 (4A) and 30 (4B) |
| Postligation purification | + | + | + | + |
| First PCR | + | + | + | + |
| Post−PCR purification | + | + | + | + |
| Hybridization capture: DNA, ng | 1500 | 1500 | 1500 | 1500 |
| Hybridization capture: baits, ng | 7.5 | 7.5 | 7.5 | 7.5 |
| Second PCR | + | + | + | + |
| Post−PCR purification | + | + | + | + |
Note that in workflows 3 and 4, after the end-repair reaction, volume was split into two tubes and processed independently up to the first PCR amplification postpurification step.
cfDNA, cell-free DNA.
Structure of Adaptors Influences Acquisition of Single or Dual Molecular Barcodes
The structure of the molecular barcode sequence containing adaptors facilitates incorporation of single or dual barcode information into the sequencing reads. In this study, two versions of adaptors were evaluated. The first version yields one individual barcode at the 5′ end of the sequencing read (referred to as single molecular barcode adaptor) (Figure 4A and B). The second version yields dual barcodes, positioned at the 5′ and 3′ ends of the sequencing read (referred to as dual molecular barcode adaptor) (Figure 4C and D). Structure of these adaptors was further evident from the depictions of the sequence analysis viewer (Figure 4B and D). While synthesizing the adaptors, a C and a T were positioned at the fifth and 10th positions of barcode sequence as placeholders; these nucleotides were common to all barcodes. In the case of a single molecular barcode adaptor, the first two distinct peaks noticed in the sequence analysis viewer represent C and T nucleotides present at the fifth and 10th positions. After the molecular barcode sequence, a universal 18-nucleotide sequence was present. These nucleotides were noticed at >80% frequency, confirming the presence of a universal sequence (Figure 4B). In the case of dual molecular barcode adaptors, in addition to C and T at the fifth and 10th positions of the barcode, a T nucleotide that was added through T-tailing reaction at the 15th position was apparent. The presence of these three peaks at the beginning of the forward and reverse reads suggests the incorporation of two molecular barcode sequences into each sequencing read (Figure 4D).
Figure 4.

Structure of adaptor facilitates acquisition of single or dual molecular barcodes into the sequencing library templates. The structure of single (A) or dual (C) molecular barcode yielding adaptors. N denotes any one of the nucleotide bases adenine (A), thymine (T), guanine (G), and cytosine (C); C denotes cytosine; T denotes thymine; U denotes uracil. Evaluation of sequencing libraries prepared from single (B) or dual (D) molecular barcode adaptors with the sequence analysis viewer. Nucleotides sequenced in each sequencing cycle are denoted with the letters A, C, G, T. E: Relative fraction of consensus reads that contain stretches of N. Note that each consensus read was generated from the group of reads sharing the same molecular barcode index, and the presence of 8 or 10 consecutive Ns in that derived consensus read was denoted as stretch. F: Dual molecular barcode adaptors compared with single molecular barcode adaptors provide higher molecular barcode diversity. cfDNA, cell-free DNA.
While sequencing data were processed, reads that shared the same molecular barcode tag were grouped together, and a consensus sequence was derived. For positions that had 100% concordant matching nucleotides across all the reads sharing similar molecular barcode tags, the concordant nucleotides were chosen in the consensus sequence. If the nucleotides were not 100% concordant, the ambiguity at those positions was indicated by an N in the consensus sequence. The single barcode adaptors compared with dual barcode adaptors yielded an approximately sixfold higher fraction of consensus reads containing 8- to 10-nucleotide stretches of N (Figure 4E). These findings suggest the possibility of diverse templates ligating to the same molecular barcode sequence containing adaptors, hence the occurrence of stretches of N in the consensus sequence. Furthermore, the unique molecular barcode tag to cfDNA template ratio was higher in the case of dual molecular barcode adaptors compared with single molecular barcode adaptors, suggesting the possibility of diverse templates sharing the same molecular barcode tag if single molecular barcode adaptors were used (Figure 4F). On the basis of these observations, in all subsequent experiments dual molecular barcode adaptors were used to facilitate duplex sequencing28, 29, 30 (Supplemental Figure S2).
Analytical Validation of the CRC23 Assay
The cfDNA libraries sequenced were prepared by diluting the HT-29, DLD-1, and MOLT-4 cell line cfDNA pool (mutant) into OCI-AML3 cell line cfDNA (control) at various proportions (Figure 5A). The expected variant allele frequencies in the mutant pool were determined by independently sequencing the cfDNAs used for creating this pool. The sequencing coverage of these variant alleles was from 1116 to 5342 (Figure 5B). The variant alleles found at 10%, 2%, 1.5%, 1%, 0.5%, and 0.2% dilutions of the mutant pool were compared with the expected variant alleles, and these findings were tabulated into a 2 × 2 contingency format (Tables 3 and 4, Supplemental Table S2). The analytical accuracy and specificity of the assay were near 100% at all tested mutant pool dilutions. However, assay sensitivity at the 1% dilution was observed to be 86.67% (Table 4). At this dilution, the variant alleles were supposedly distributed between 0.5% and 1%. However, the expected variant frequency calculation indicated that these variants were scattered between 0.16% and 1% (Table 4). In agreement with the expected distribution of variants, the observed frequencies of variants were also distributed widely at all tested dilutions of the mutant pool (Figure 5C, Supplemental Figure S4). Therefore, to establish the limit of detection of the assay (defined here as a dilution at which 80% of variants could be detected), the variants that were expected to occur at 0.3% to 0.39%, 0.2% to 0.29%, and 0.1% to 0.19% frequencies were evaluated to determine whether those expected variants could be detected with this assay. These observations indicated that >80% of variants could be identified when they were expected to be present between 0.3% and 0.39% frequencies (Figure 5D), suggesting that the 0.3% variant frequency was the lower limit of detection of this assay.
Figure 5.

Evaluation of CRC23 assay analytical performance. A: Assembling of a mutant cell-free DNA (cfDNA) pool for library generation. The cfDNAs from HT-29, DLD-1, and MOLT-4 (mutant) were mixed at equal proportions, and this pool was diluted at 10%, 2%, 1.5%, 1%, 0.5%, and 0.2% frequencies into the cfDNA from OCI-AML3 (control). Note that 30 ng of cfDNA from each dilution in triplicate was used for library generation and sequencing. B: Sequencing coverage depth across different variant positions of the mutant cfDNA pool diluted at 10% frequency. C: Distribution of mutant allele frequencies identified from the mutant cfDNA pool diluted at 1% frequency. D: Determination of the limit of detection of the CRC23 assay. Note that the variants that were expected to occur at 0.3% to 0.39%, 0.2% to 0.29%, and 0.1% to 0.19% frequencies were evaluated for determining limit of detection. MAF, mutant allele frequency.
Table 3.
Analytical Validation Findings from cfDNA Mutant Pool Diluted at 1%, 0.5%, and 0.2% Frequencies
| CRC23 panel | CRC23 panel: cfDNA from individual cell lines |
Total | |
|---|---|---|---|
| Positive | Negative | ||
| Mutant cfDNA 1% dilution | |||
| Positive | 117 | 0 | 117 |
| Negative | 18 | 175,935 | 175,953 |
| Total | 135 | 175,935 | 176,070 |
| Mutant cfDNA 0.5% dilution | |||
| Positive | 86 | 0 | 86 |
| Negative | 49 | 175,935 | 175,984 |
| Total | 135 | 175,935 | 176,070 |
| Mutant cfDNA 0.2% dilution | |||
| Positive | 52 | 0 | 52 |
| Negative | 83 | 175,935 | 176,018 |
| Total | 135 | 175,935 | 176,070 |
Note that for orthogonal verification, variants obtained by independently sequencing each cfDNA of the mutant pool were used.
cfDNA, cell-free DNA.
Table 4.
Analytical Performance of the CRC23 Assay at Various MAF Dilutions
| Mutant cfDNA dilution, % | MAF range (expected), % | Accuracy, % (95% CI) | Sensitivity, % (95% CI) | Specificity, % (95% CI) |
|---|---|---|---|---|
| 10 | 1.56–9.95 | 100 (100–100) | 100 (97.30–100) | 100 (100–100) |
| 2 | 0.31–1.99 | 100 (99.99–100) | 97.04 (92.59–99.19) | 100 (100–100) |
| 1.50 | 0.23–1.49 | 100 (100–100) | 97.78 (93.64–99.54) | 100 (100–100) |
| 1 | 0.16–1.0 | 99.99 (99.98–99.99) | 86.67 (79.75–91.90) | 100 (100–100) |
| 0.50 | 0.08–0.5 | 99.97 (99.96–99.98) | 63.70 (54.99–71.80) | 100 (100–100) |
| 0.20 | 0.03–0.2 | 99.95 (99.94–99.96) | 38.52 (30.28–47.28) | 100 (100–100) |
Note that the expected mutant allele frequencies tend to distribute in a broader range at each dilution of the mutant cfDNA pool.
cfDNA, cell-free DNA; MAF, mutant allele frequency.
Clinical Validation of the CRC23 Assay
Clinical validation of this assay was performed by sequencing cfDNA samples from 27 patients with colorectal cancer, and our findings were compared with the Guardant360 assay findings for orthogonal validation. For comparison purposes, sequencing information from 22 genes that were common to both assays, as well as variant alleles at frequencies of ≥0.3% as in the Guardant360 assay, were used. APC, KRAS, and TP53 were more frequently mutated in the cohort used in this study (Figure 6A). The diagnostic performance of this assay compared with the Guardant360 assay is shown in 2 × 2 contingency table format (Table 5), and the findings indicated that the diagnostic accuracy, sensitivity, and specificity of the assay were 96.15% (95% CI, 94.28%–97.55%), 87.23% (95% CI, 74.26%–95.17%), and 96.91% (95% CI, 95.11%–98.19%), respectively. The frequencies of variants that were identified in both assays were highly concordant, with an R2 value of 0.99 (Figure 6B). Variants that were identified exclusively with the Guardant360 or CRC23 assays were also noticed. Interestingly, the variants identified exclusively with the Guardant360 assay had a mutant allele frequency between 0.3 and 0.5, suggesting the variants distributed within this narrow range are missed only in the CRC23 assay. To establish the accuracy of variants that were identified exclusively in the CRC assay, duplex sequencing findings (ie, the variants that were identified from DCS reads) was used because variants detected in both top and bottom template strands were regarded as true variants. Concordance of variant allele frequencies identified from SCS and DCS reads were determined; the frequencies were found to be highly concordant (r2 = 0.99) (Figure 6C). All variants (n = 17) could be verified through variant calls made from DCS reads, which confirms the accuracy of variants that were identified exclusively with this assay (Figure 6D).
Figure 6.

Evaluation of clinical diagnostic performance of the CRC23 assay. A: Identification of most frequently mutated genes in patients with colorectal cancer. Note that within the 27 colorectal cancer cell-free DNA samples sequenced, TP53, KRAS, and APC genes are frequently mutated. B: Correlation of the frequencies of common mutant alleles identified from the CRC23 and Guardant360 assays. Observed mutant allele frequency (MAF) findings were from the CRC23 assay and the expected MAF findings were from the Guardant360 assay. C: MAFs derived from single consensus sequences (SCSs) and double consensus sequences (DCSs) indicate a high degree of concordance. D: Evaluation of the accuracy of variants exclusively identified in the CRC23 assay. Note that all the variants that were identified from SCS reads are also identified from DCS reads, suggesting accuracy of these variants.
Table 5.
Clinical Diagnostic Performance of the CRC23 Assay Compared with the Guardant360 Assay
| CRC23 panel: cfDNA duplex sequencing | GH360 panel: cfDNA NGS |
Total | |
|---|---|---|---|
| Positive | Not detected | ||
| Positive | 41 | 17 | 58 |
| Not detected | 6 | 534 | 540 |
| Total | 47 | 551 | 598 |
cfDNA, cell-free DNA; NGS, next-generation sequencing.
Longitudinal Monitoring of Disease Progression in Patients with Stage IV Colorectal Cancer Using the CRC23 Assay
To demonstrate a clinical application of this assay, longitudinal monitoring of variant allele frequencies was performed in three plasma samples that were collected from each of the five patients with colon cancer at different time points during the treatment course. Variant allele frequency trends were compared with computed tomographic images obtained at multiple time points during therapy.
Patient A had a primary tumor in the colon and metastases in the liver, adrenal glands, and bones. In the first collected plasma sample, mutant alleles were detected in APC (p.Q1406X) and TP53 (p.R282W) at a frequency >20% (Figure 7A). The second plasma sample also contained marginally increased mutant allele frequencies compared with those in the first plasma collection. However, the third collection indicated a twofold increase in these two variant allele frequencies. Imaging performed at this collection point also indicated significant progression of the liver, adrenal gland, and bone metastases, suggesting that the observations from cfDNA analysis correlated well with the imaging findings.
Figure 7.

Monitoring of disease progression in patients with stage IV colorectal cancer with the CRC23 assay. A–C: Trends in mutant allele frequencies correlated with the disease status observations obtained from imaging. Note that from each patient, three plasma samples were collected at different time points. Imaging was performed at multiple points, and these patients were subjected to multiple treatment regimens. Inner tick marks at the bottoms of the images indicate the points of blood sample collection; the vertical lines indicate the points of imaging; the shaded areas represent the periods for which the patients were subjected to a treatment regimen; and the arrows at the tops of the images provide clinical interpretations obtained from imaging.
In patient B, the primary tumor was located in the colon, with metastases to the liver and lymph nodes. The cfDNA sequencing analysis of the first plasma sample indicated the presence of mutations in APC (p.E1309delinsDW), TP53 (p.R213X), and TP53 (p.P322H) (Figure 7B). A second plasma sample collected 2 weeks later showed APC (p.E1309delinsDW) and TP53 (p.R213X) mutant allele frequencies that were elevated twofold. In the third collection, these mutant allele frequencies were observed to be slightly increased compared with those in the second plasma collection. Imaging performed at this point also indicated mixed treatment responses at diverse metastatic sites, with an overall impression of disease progression.
Patient C had primary tumor in the colon and metastases in the lungs, liver, and lymph nodes. In the first plasma sample, mutations in APC (p.S1400R), KRAS (p.A146T), PIK3CA (p.E545G), SMAD4 (p.K340E), TP53 (p.G244D), FBXW7 (p.S86L), and PDFGRA (p.K265T) were found; in the second plasma sample collected, a new mutation in NF1 (p.L2439V) was observed (Figure 7C). Frequencies of these mutant alleles were marginally elevated in the second plasma collection compared with the previous collection. However, most of the mutant allele frequencies were decreased in the third plasma collection, except for FBXW7 (p.S86L) and NF1 (p.L2439V), which had an opposite trend between the second and third plasma collections. Imaging performed between the second and third plasma collections revealed a slight increase in size of lung and liver metastatic nodules and stable lymphadenopathy in the neck, chest, and abdomen compared with imaging performed at previous time point, providing an overall impression of stable disease. On the basis of these collective observations from cfDNA mutational profiling and imaging, it was reasoned that the opposing mutational profile trends observed for the FBXW7 and NF1 variants between the second and third plasma collections were likely attributable to a proliferative advantage provided by these mutations at metastatic foci in the lungs and liver.31 In agreement, imaging performed 5 weeks after completion of the trifluridine/tipiracil (Lonsurf) therapeutic regimen (or 3 weeks after the third plasma collection) showed grossly enlarged lung and liver metastatic nodules and extensive lymphadenopathy in the neck, chest, and abdomen, suggesting the possibility of tumor reemergence in the absence of therapeutic pressure or the expansion of tumor clones possessing additional mutations in the FBXW731 and NF1 genes at different metastatic foci.
Patient D had primary tumor in the sigmoid colon, with metastases in the liver, peritoneum, and ovaries. The first plasma sample contained mutations in TP53 (p.E258X), APC (p.R216X), and KRAS (p.G12V), and the frequencies of most of these mutant alleles were decreased in the second plasma collection (Figure 8A). The second sample contained two new mutations in ERBB4, and the accuracy of these variants was further verified through variant calls obtained from DCS reads (Figure 8B). Imaging performed close to the time of the second sample collection indicated regression of a few lung lesions and progression in a few other lung sites and the liver. Subsequently, a third plasma sample indicated increased allelic frequencies of most mutants. The imaging performed after the third collection indicated increasing size of lung nodules and liver and peritoneal metastases, which also suggested disease progression.
Figure 8.

Monitoring of disease progression in patients with stage IV colorectal cancer with the CRC23 assay. A and C: The observed mutant allele frequencies from cell-free DNA molecular profiling correlate with the disease status observations obtained from imaging. Note that from each patient, three plasma samples were collected at different time points. Imaging was performed at multiple points, and these patients were subjected to multiple treatment regimens. Inner tick marks at the bottoms of the images indicate the points of blood sample collection; the vertical lines indicate the points of imaging; the shaded areas represent the periods for which the patients were subjected to a treatment regimen; and the arrows at the tops of the images provides clinical interpretations obtained from imaging. B: Confirmation of the newly evolved variants through duplex sequencing. DCS, double consensus sequence; SCS, single consensus sequence.
Patient E had a primary tumor in the rectum, with metastases localized in the lungs, liver, lymph nodes, and brain. The first plasma sample was collected before initiation of treatment with regorafenib, and the cfDNA analysis indicated the presence of mutations in APC (p.E536X and p.S1400X), KRAS (p.G12D), MET (p.E75K), and TP53 (p.R248Q) (Figure 8C). The second sample was collected 1 month after treatment initiation, and the observed mutant allelic frequencies in this sample were marginally decreased compared with those in the first plasma collection. However, imaging performed 1 month after the second collection indicated disease progression. A third plasma sample was collected 2 months after the initiation of treatment; the mutant allele frequency of APC (p.E536X and p.S1400X) was reduced, and mutations in KRAS (p.G12D) and TP53 (p.R248Q) were not detected. In agreement with these findings, imaging performed on the same day as the third sample collection also indicated stable disease in this patient.
Discussion
This study reports a systematic approach for developing a cfDNA-based molecular test for liquid biopsies. Critical steps involved in establishing wet bench methods and a bioinformatics pipeline were evaluated, and a clinical application of the panel was illustrated by monitoring disease progression in patients with stage IV colorectal cancer.
Theoretically, a hybridization capture–based approach compared with an amplicon-based approach is a better choice for cfDNA-based liquid biopsy applications.17, 32, 33 Tumor cells release cfDNA fragments into the circulation through apoptosis, necrosis, or active secretion.6, 7, 8 Irrespective of their mode of release, these fragments seem to be generated from a random fragmentation process. Each fragment contains a distinct beginning and end. In an amplicon-based method, if the variants of interest are present at the edges of the randomly generated cfDNA templates, these fragments might not amplify because they lack a binding sequence for any of the primers. In contrast, a hybridization capture–based approach can enrich for these types of cfDNA fragments effectively because the binding of probe to the targeted region or adjoining region is sufficient to capture the variant. In the hybridization capture approach, the capture size varies from a few kilobases to several megabases.32 Increase in the size of capture is positively correlated with on-target enrichment percentages. In this study, a panel that covers 78.81-kb target regions was designed. With this size panel, the obtainable on-target percentages are projected to be <50%. To improve the on-target enrichment percentage without compromising absolute coverage of individual target regions, enrichment bait concentrations were optimized during hybridization capture, and substantial improvement was seen when concentrations of baits were <10 ng. These findings suggest that depending on the capture size, optimization of enrichment bait concentration can yield significantly better on-target recovery.
Most of the commercially available next-generation sequencing library preparation methods have been tailored for tissue biopsy specimens and aim to identify variants occurring at frequencies of ≥5%. However, in cfDNA-based liquid biopsy applications, identification of variants at <1% frequency is critical.16, 17 A protocol for good library preparation must maintain variant allele frequencies of the original cfDNA pool throughout all the stages of library preparation. We therefore developed a library preparation strategy that accurately facilitates identification of ultralow frequency variants.
In this study, two versions of adaptors were evaluated, and unique advantages of using dual molecular barcode adaptors were found compared with single molecular barcode adaptors for cfDNA-based applications. In the case of dual barcode adaptors, two 14-bp molecular barcode sequences are integrated, and a single 28-bp molecular barcode is derived with a bioinformatics strategy. Therefore, the unique molecular barcode diversity that can be obtained with dual barcode adaptors was thousands-fold higher than with single barcode adaptors. Therefore, the fraction of diverse templates receiving the same molecular barcode remains higher in the case of a single molecular adaptor, and indeed a higher fraction of unusable consensus sequence reads was seen when a single molecular adaptor was used. More importantly, dual molecular barcode adaptors facilitated duplex sequencing of cfDNA templates.28 Sequencing artifacts can arise randomly or in a recurrent manner and contribute to low allelic frequency variants, which are often regarded as false-positive results.15, 16 However, a random variant is unlikely to occur at the same position on both the top and bottom strands of cfDNA. Therefore, if a variant is observed in both template strands, it is more likely to be a true variant.28 Therefore, the duplex sequencing support was used to identify a variant that was present in both top and bottom strands of cfDNA. In duplex sequencing, consensus reads are derived in two stages. In the first stage, SCS reads are derived from the original sequencing reads, and in the second stage, DCS reads are derived using SCS reads as a template. In this study, for variant identification purposes, those SCS reads were used. Variants identified from DCS reads are used only under circumstances when further verification of the identified variant from SCS reads is required. Further advancement in the current technology will allow using DCS reads in place of SCS reads for variant identification.
A 78.81-kb colorectal cancer–specific panel was designed based on variant information retrieved from approximately 3000 patient samples. In the 27 colorectal cancer samples sequenced, TP53, APC, and KRAS were identified as most frequently mutated, and these genes are the key players in colorectal cancer.34 The sequencing findings were compared with those obtained after sequencing of these samples with the Guardant360 assay as an orthogonal method.17 Frequencies of variant alleles that were detected in both assays had high concordance. However, six variants that were exclusively identified in the Guardant360 assay were found. This discrepancy may be explained by preanalytical variables that differ between the two assays.35 In our assay, blood samples were drawn in EDTA Vacutainer tubes, and cfDNA was extracted using column-based manual extraction protocols. In the Guardant360 assay, blood samples were collected in Streck tubes, and extractions were performed with an automated version of the protocol that uses magnetic bead–based extraction. Therefore, significant amounts of high-molecular-weight genomic DNA contamination were observed in the manually extracted cfDNA,36, 37 and an additional size selection step was incorporated after extraction for excluding genomic DNA. Although high-quality cfDNA was obtained after size selection, as a consequence of losses incurred during the size selection process, the total amount of cfDNA that was used for library preparation might be lower than the quantities used in the Guardant360 assay. Because the lower limit of detection of an assay is directly proportional to input cfDNA, the likely lower input of cfDNA used in our assay could explain variants identified exclusively in the Guardant360 assay. Strikingly, 17 variants were also found exclusive to our assay. To confirm the accuracy of these variants, duplex sequencing support was used, which again underscores the critical utility of duplex sequencing for liquid biopsies.28 It is possible that these variants might have been detected in the Guardant360 assay but were not included in their report because of the status of their nonpathogenic association. Nonetheless, duplex sequencing of cfDNA provides another layer of accuracy.
A potential clinical application of our assay is monitoring disease progression in patients with stage IV colorectal cancer. In this study, cfDNA sequencing of longitudinal samples collected from these patients showed that mutant allele frequency trends in the samples were concordant with imaging observations. When the trends of mutant allele frequencies between the current and earlier collection specimens were compared, increases in mutant allele frequencies correlated with disease progression. On the other hand, decreased mutant allele frequencies that correlated with regressed tumor foci at metastatic sites or stable disease were also observed. Tumor-released cfDNA has a half-life of 16 minutes to 2.5 hours.6, 38, 39, 40 Owing to its short half-life, cfDNA could be used for real-time tracing of tumor progression. However, caution needs to be exercised if samples are collected while the patient is on a treatment regimen because therapy-induced tumor cell death releases cfDNA into circulation, which in turn also leads to a higher mutant allele frequency.41, 42 Indeed, cfDNA-based molecular profiling is sensitive compared with imaging-based approaches and has been used in previous studies for monitoring disease progression in patients with melanoma and cancers of the breast, lung, pancreas, and colon.43, 44, 45, 46, 47, 48 New variants that were identified exclusively at later time points and not at earlier time points and variants that were present in earlier collections and absent in subsequent collections were verified through duplex sequencing strategy. Therefore, in cfDNA-based molecular profiling applications, duplex sequencing increases the accurate identification of variants that might emerge or diminish during longitudinal monitoring. Furthermore, the variants that were observed at low frequencies were often increased in later collections, emphasizing that identification of low-frequency variants is critical for cfDNA-based molecular testing and that their early identification can have a potential effect on disease management.6
In conclusion, the approaches presented in this study have potential utility for applications that involve cfDNA-based molecular profiling for early detection of cancer, identification of minimal residual disease, and the evaluation of therapeutic responses in patients with cancer.49, 50, 51, 52, 53
Acknowledgments
We thank Helene Pelicano, Xiaoping Sun, Xiaoming Liu, Goo Jun, Lan Chieh, Justin P. Windham, Yujin Kudo, Shannon Furr, and Kazutaka Fukumura for helpful discussions; Khushali R. Patel for help with sample procurement; Francisco M. Garcia, Mario Fidalgo, and Panagiotis Tsilifis for helping with programing; and the Department of Scientific Publications at The University of Texas MD Anderson Cancer Center for editing the manuscript.
S.M., S.Z., S.K., and R.L. planned the study, designed the experiments, analyzed the data, and wrote the manuscript; S.Z. and S.M. performed all the experiments; D.Y.D., P.C.H., and L.J.M. procured samples, optimized workflows, and wrote the manuscript; and I.I.W., S.K., and R.L. designed and supervised the study.
Footnotes
Supported by the NIH grant R01 CA184843 (S.K.) and the MD Anderson Moon Shots Program (S.K.).
Disclosures: The authors have filed a provisional patent application with United States Patent & Trademark Office on Methods for Duplex Sequencing of Cell-Free DNA and Applications Thereof.
Supplemental material for this article can be found at http://doi.org/10.1016/j.jmoldx.2019.06.008.
Supplemental Data
Supplemental Figure S1.
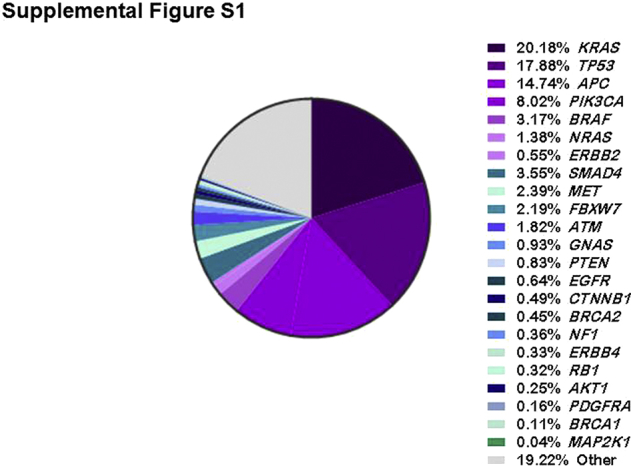
Frequency-wise distribution of the most commonly mutated genes in colorectal cancer. These data were compiled using the sequencing information obtained from a cohort of 2906 patients.
Supplemental Figure S2.

Schematic outline of the strategy for double consensus sequence (DCS) derivation from duplex sequencing. During library preparation, P5 adaptor and molecular barcode sequences (referred to here as α and β) are ligated to the 5′ ends of the top and bottom strands of input cell-free DNA (cfDNA). The 3′ ends of the top and bottom strands receive the complementary sequences of the β and α molecular barcodes, respectively, along with P7 adaptor sequences. During PCR amplification, each strand produces its complementary sequence; the top strand (blue) yields a complementary sequence depicted in black, and the bottom strand (red) produces a complementary sequence (yellow). After paired-end sequencing, the first 14-bp molecular barcode information from a sequencing read in the forward-reads file (denoted here with F) and corresponding sequencing read in the reverse-reads file (denoted here with R) are combined computationally and used as an index for these sequencing reads (denoted here as αβ or βα). Sequencing reads that share the same molecular barcode index are grouped together, and from each group of reads a single consensus sequence (SCS) is derived. To derive a DCS, the SCS read that contains the αβ molecular barcode index from the forward-read file is grouped with the SCS read that contains the βα molecular barcode index from the reverse-read file. In a similar manner, the SCS read that contains the αβ molecular barcode index from the reverse-read file is grouped with the SCS read that contains the βα molecular barcode index from the forward-read file.
Supplemental Figure S3.

A position-specific error model that effectively aids in correcting sequencing errors accrued in patient cell-free DNA (cfDNA). A position-specific variant allele frequency (error) model was created by sequencing cfDNA isolated from the plasma samples of healthy controls. Gaussian distribution of variant allele frequencies observed in these control cfDNA samples was used to evaluate the specificity of variant frequencies noticed in the patient cfDNA samples. If the variant frequencies in the patient cfDNA samples were within the limits of the gaussian distribution of variant frequencies from the control cfDNA, the variant allele frequencies in the patients' cfDNA were considered an error and adjusted to zero. In the example shown, the reference base A (indicated in a box) was mutated to G and T in the controls. In the patient sample (test), the same reference base was mutated to G. Evaluation of this mutant allele frequency (MAF) on the basis of the gaussian distribution of MAFs in the controls identified it as an error; therefore, the frequency was adjusted to zero.
Supplemental Figure S4.

Distribution of variant allele frequencies in the mutant cell-free DNA (cfDNA) pool diluted at 10% (A), 2% (B), 1.5% (C), 0.5% (D), and 0.2% (E) proportions. For each mutant cfDNA dilution, triplicate samples were sequenced. Each outward mark on the x-axis denotes a variant. For each variant, individual frequencies and their mean frequency values are shown.
References
- 1.Lebofsky R., Decraene C., Bernard V., Kamal M., Blin A., Leroy Q., Rio Frio T., Pierron G., Callens C., Bieche I., Saliou A., Madic J., Rouleau E., Bidard F.C., Lantz O., Stern M.H., Le Tourneau C., Pierga J.Y. Circulating tumor DNA as a non-invasive substitute to metastasis biopsy for tumor genotyping and personalized medicine in a prospective trial across all tumor types. Mol Oncol. 2015;9:783–790. doi: 10.1016/j.molonc.2014.12.003. [DOI] [PMC free article] [PubMed] [Google Scholar]
- 2.Pereira A.A.L., Morelli M.P., Overman M., Kee B., Fogelman D., Vilar E., Shureiqi I., Raghav K., Eng C., Manuel S., Crosby S., Wolff R.A., Banks K., Lanman R., Talasaz A., Kopetz S., Morris V. Clinical utility of circulating cell-free DNA in advanced colorectal cancer. PLoS One. 2017;12:e0183949. doi: 10.1371/journal.pone.0183949. [DOI] [PMC free article] [PubMed] [Google Scholar]
- 3.Schrock A.B., Pavlick D., Klempner S.J., Chung J.H., Forcier B., Welsh A., Young L., Leyland-Jones B., Bordoni R., Carvajal R.D., Chao J., Kurzrock R., Sicklick J.K., Ross J.S., Stephens P.J., Devoe C., Braiteh F., Ali S.M., Miller V.A. Hybrid capture-based genomic profiling of circulating tumor DNA from patients with advanced cancers of the gastrointestinal tract or anus. Clin Cancer Res. 2018;24:1881–1890. doi: 10.1158/1078-0432.CCR-17-3103. [DOI] [PMC free article] [PubMed] [Google Scholar]
- 4.Ma M., Zhu H., Zhang C., Sun X., Gao X., Chen G. “Liquid biopsy”-ctDNA detection with great potential and challenges. Ann Transl Med. 2015;3:235. doi: 10.3978/j.issn.2305-5839.2015.09.29. [DOI] [PMC free article] [PubMed] [Google Scholar]
- 5.Castro-Giner F., Gkountela S., Donato C., Alborelli I., Quagliata L., Ng C.K.Y., Piscuoglio S., Aceto N. Cancer diagnosis using a liquid biopsy: challenges and expectations. Diagnostics (Basel) 2018;8 doi: 10.3390/diagnostics8020031. [DOI] [PMC free article] [PubMed] [Google Scholar]
- 6.Wan J.C.M., Massie C., Garcia-Corbacho J., Mouliere F., Brenton J.D., Caldas C., Pacey S., Baird R., Rosenfeld N. Liquid biopsies come of age: towards implementation of circulating tumour DNA. Nat Rev Cancer. 2017;17:223–238. doi: 10.1038/nrc.2017.7. [DOI] [PubMed] [Google Scholar]
- 7.Stroun M., Lyautey J., Lederrey C., Olson-Sand A., Anker P. About the possible origin and mechanism of circulating DNA apoptosis and active DNA release. Clin Chim Acta. 2001;313:139–142. doi: 10.1016/s0009-8981(01)00665-9. [DOI] [PubMed] [Google Scholar]
- 8.Thierry A.R., El Messaoudi S., Gahan P.B., Anker P., Stroun M. Origins, structures, and functions of circulating DNA in oncology. Cancer Metastasis Rev. 2016;35:347–376. doi: 10.1007/s10555-016-9629-x. [DOI] [PMC free article] [PubMed] [Google Scholar]
- 9.Underhill H.R., Kitzman J.O., Hellwig S., Welker N.C., Daza R., Baker D.N., Gligorich K.M., Rostomily R.C., Bronner M.P., Shendure J. Fragment length of circulating tumor DNA. PLoS Genet. 2016;12:e1006162. doi: 10.1371/journal.pgen.1006162. [DOI] [PMC free article] [PubMed] [Google Scholar]
- 10.Robasky K., Lewis N.E., Church G.M. The role of replicates for error mitigation in next-generation sequencing. Nat Rev Genet. 2014;15:56–62. doi: 10.1038/nrg3655. [DOI] [PMC free article] [PubMed] [Google Scholar]
- 11.Williams C., Ponten F., Moberg C., Soderkvist P., Uhlen M., Ponten J., Sitbon G., Lundeberg J. A high frequency of sequence alterations is due to formalin fixation of archival specimens. Am J Pathol. 1999;155:1467–1471. doi: 10.1016/S0002-9440(10)65461-2. [DOI] [PMC free article] [PubMed] [Google Scholar]
- 12.Park G., Park J.K., Shin S.H., Jeon H.J., Kim N.K.D., Kim Y.J., Shin H.T., Lee E., Lee K.H., Son D.S., Park W.Y., Park D. Characterization of background noise in capture-based targeted sequencing data. Genome Biol. 2017;18:136. doi: 10.1186/s13059-017-1275-2. [DOI] [PMC free article] [PubMed] [Google Scholar]
- 13.Arbeithuber B., Makova K.D., Tiemann-Boege I. Artifactual mutations resulting from DNA lesions limit detection levels in ultrasensitive sequencing applications. DNA Res. 2016;23:547–559. doi: 10.1093/dnares/dsw038. [DOI] [PMC free article] [PubMed] [Google Scholar]
- 14.Bruskov V.I., Malakhova L.V., Masalimov Z.K., Chernikov A.V. Heat-induced formation of reactive oxygen species and 8-oxoguanine, a biomarker of damage to DNA. Nucleic Acids Res. 2002;30:1354–1363. doi: 10.1093/nar/30.6.1354. [DOI] [PMC free article] [PubMed] [Google Scholar]
- 15.Kamps-Hughes N., McUsic A., Kurihara L., Harkins T.T., Pal P., Ray C., Ionescu-Zanetti C. ERASE-Seq: leveraging replicate measurements to enhance ultralow frequency variant detection in NGS data. PLoS One. 2018;13:e0195272. doi: 10.1371/journal.pone.0195272. [DOI] [PMC free article] [PubMed] [Google Scholar]
- 16.Newman A.M., Lovejoy A.F., Klass D.M., Kurtz D.M., Chabon J.J., Scherer F., Stehr H., Liu C.L., Bratman S.V., Say C., Zhou L., Carter J.N., West R.B., Sledge G.W., Shrager J.B., Loo B.W., Jr., Neal J.W., Wakelee H.A., Diehn M., Alizadeh A.A. Integrated digital error suppression for improved detection of circulating tumor DNA. Nat Biotechnol. 2016;34:547–555. doi: 10.1038/nbt.3520. [DOI] [PMC free article] [PubMed] [Google Scholar]
- 17.Lanman R.B., Mortimer S.A., Zill O.A., Sebisanovic D., Lopez R., Blau S., Collisson E.A., Divers S.G., Hoon D.S., Kopetz E.S., Lee J., Nikolinakos P.G., Baca A.M., Kermani B.G., Eltoukhy H., Talasaz A. Analytical and clinical validation of a digital sequencing panel for quantitative, highly accurate evaluation of cell-free circulating tumor DNA. PLoS One. 2015;10:e0140712. doi: 10.1371/journal.pone.0140712. [DOI] [PMC free article] [PubMed] [Google Scholar]
- 18.Salk J.J., Schmitt M.W., Loeb L.A. Enhancing the accuracy of next-generation sequencing for detecting rare and subclonal mutations. Nat Rev Genet. 2018;19:269–285. doi: 10.1038/nrg.2017.117. [DOI] [PMC free article] [PubMed] [Google Scholar]
- 19.Foubert F., Matysiak-Budnik T., Touchefeu Y. Options for metastatic colorectal cancer beyond the second line of treatment. Dig Liver Dis. 2014;46:105–112. doi: 10.1016/j.dld.2013.07.002. [DOI] [PubMed] [Google Scholar]
- 20.Hao T.B., Shi W., Shen X.J., Qi J., Wu X.H., Wu Y., Tang Y.Y., Ju S.Q. Circulating cell-free DNA in serum as a biomarker for diagnosis and prognostic prediction of colorectal cancer. Br J Cancer. 2014;111:1482–1489. doi: 10.1038/bjc.2014.470. [DOI] [PMC free article] [PubMed] [Google Scholar]
- 21.Cassinotti E., Boni L., Segato S., Rausei S., Marzorati A., Rovera F., Dionigi G., David G., Mangano A., Sambucci D., Dionigi R. Free circulating DNA as a biomarker of colorectal cancer. Int J Surg. 2013;11 Suppl 1:S54–S57. doi: 10.1016/S1743-9191(13)60017-5. [DOI] [PubMed] [Google Scholar]
- 22.Kidess E., Heirich K., Wiggin M., Vysotskaia V., Visser B.C., Marziali A., Wiedenmann B., Norton J.A., Lee M., Jeffrey S.S., Poultsides G.A. Mutation profiling of tumor DNA from plasma and tumor tissue of colorectal cancer patients with a novel, high-sensitivity multiplexed mutation detection platform. Oncotarget. 2015;6:2549–2561. doi: 10.18632/oncotarget.3041. [DOI] [PMC free article] [PubMed] [Google Scholar]
- 23.Scholer L.V., Reinert T., Orntoft M.W., Kassentoft C.G., Arnadottir S.S., Vang S., Nordentoft I., Knudsen M., Lamy P., Andreasen D., Mortensen F.V., Knudsen A.R., Stribolt K., Sivesgaard K., Mouritzen P., Nielsen H.J., Laurberg S., Orntoft T.F., Andersen C.L. Clinical implications of monitoring circulating tumor DNA in patients with colorectal cancer. Clin Cancer Res. 2017;23:5437–5445. doi: 10.1158/1078-0432.CCR-17-0510. [DOI] [PubMed] [Google Scholar]
- 24.Tie J., Cohen J.D., Wang Y., Li L., Christie M., Simons K., Elsaleh H., Kosmider S., Wong R., Yip D., Lee M., Tran B., Rangiah D., Burge M., Goldstein D., Singh M., Skinner I., Faragher I., Croxford M., Bampton C., Haydon A., Jones I.T., S Karapetis C., Price T., Schaefer M.J., Ptak J., Dobbyn L., Silliman N., Kinde I., Tomasetti C., Papadopoulos N., Kinzler K., Volgestein B., Gibbs P. Serial circulating tumour DNA analysis during multimodality treatment of locally advanced rectal cancer: a prospective biomarker study. Gut. 2019;68:663–671. doi: 10.1136/gutjnl-2017-315852. [DOI] [PMC free article] [PubMed] [Google Scholar]
- 25.Tie J., Kinde I., Wang Y., Wong H.L., Roebert J., Christie M., Tacey M., Wong R., Singh M., Karapetis C.S., Desai J., Tran B., Strausberg R.L., Diaz L.A., Jr., Papadopoulos N., Kinzler K.W., Vogelstein B., Gibbs P. Circulating tumor DNA as an early marker of therapeutic response in patients with metastatic colorectal cancer. Ann Oncol. 2015;26:1715–1722. doi: 10.1093/annonc/mdv177. [DOI] [PMC free article] [PubMed] [Google Scholar]
- 26.Christensen E., Nordentoft I., Vang S., Birkenkamp-Demtroder K., Jensen J.B., Agerbaek M., Pedersen J.S., Dyrskjot L. Optimized targeted sequencing of cell-free plasma DNA from bladder cancer patients. Sci Rep. 2018;8:1917. doi: 10.1038/s41598-018-20282-8. [DOI] [PMC free article] [PubMed] [Google Scholar]
- 27.Zhou J., Chang L., Guan Y., Yang L., Xia X., Cui L., Yi X., Lin G. Application of circulating tumor DNA as a non-invasive tool for monitoring the progression of colorectal cancer. PLoS One. 2016;11:e0159708. doi: 10.1371/journal.pone.0159708. [DOI] [PMC free article] [PubMed] [Google Scholar]
- 28.Schmitt M.W., Kennedy S.R., Salk J.J., Fox E.J., Hiatt J.B., Loeb L.A. Detection of ultra-rare mutations by next-generation sequencing. Proc Natl Acad Sci U S A. 2012;109:14508–14513. doi: 10.1073/pnas.1208715109. [DOI] [PMC free article] [PubMed] [Google Scholar]
- 29.Kennedy S.R., Schmitt M.W., Fox E.J., Kohrn B.F., Salk J.J., Ahn E.H., Prindle M.J., Kuong K.J., Shen J.C., Risques R.A., Loeb L.A. Detecting ultralow-frequency mutations by duplex sequencing. Nat Protoc. 2014;9:2586–2606. doi: 10.1038/nprot.2014.170. [DOI] [PMC free article] [PubMed] [Google Scholar]
- 30.Stoler N., Arbeithuber B., Guiblet W., Makova K.D., Nekrutenko A. Streamlined analysis of duplex sequencing data with Du Novo. Genome Biol. 2016;17:180. doi: 10.1186/s13059-016-1039-4. [DOI] [PMC free article] [PubMed] [Google Scholar]
- 31.Tong J., Tan S., Zou F., Yu J., Zhang L. FBW7 mutations mediate resistance of colorectal cancer to targeted therapies by blocking Mcl-1 degradation. Oncogene. 2017;36:787–796. doi: 10.1038/onc.2016.247. [DOI] [PMC free article] [PubMed] [Google Scholar]
- 32.Samorodnitsky E., Jewell B.M., Hagopian R., Miya J., Wing M.R., Lyon E., Damodaran S., Bhatt D., Reeser J.W., Datta J., Roychowdhury S. Evaluation of hybridization capture versus amplicon-based methods for whole-exome sequencing. Hum Mutat. 2015;36:903–914. doi: 10.1002/humu.22825. [DOI] [PMC free article] [PubMed] [Google Scholar]
- 33.Garcia-Garcia G., Baux D., Faugere V., Moclyn M., Koenig M., Claustres M., Roux A.F. Assessment of the latest NGS enrichment capture methods in clinical context. Sci Rep. 2016;6:20948. doi: 10.1038/srep20948. [DOI] [PMC free article] [PubMed] [Google Scholar]
- 34.Strickler J.H., Loree J.M., Ahronian L.G., Parikh A.R., Niedzwiecki D., Pereira A.A.L., McKinney M., Korn W.M., Atreya C.E., Banks K.C., Nagy R.J., Meric-Bernstam F., Lanman R.B., Talasaz A., Tsigelny I.F., Corcoran R.B., Kopetz S. Genomic landscape of cell-free DNA in patients with colorectal cancer. Cancer Discov. 2018;8:164–173. doi: 10.1158/2159-8290.CD-17-1009. [DOI] [PMC free article] [PubMed] [Google Scholar]
- 35.Mehrotra M., Singh R.R., Chen W., Huang R.S.P., Almohammedsalim A.A., Barkoh B.A., Simien C.M., Hernandez M., Behrens C., Patel K.P., Routbort M.J., Broaddus R.R., Medeiros L.J., Wistuba, Kopetz S., Luthra R. Study of preanalytic and analytic variables for clinical next-generation sequencing of circulating cell-free nucleic acid. J Mol Diagn. 2017;19:514–524. doi: 10.1016/j.jmoldx.2017.03.003. [DOI] [PubMed] [Google Scholar]
- 36.Norton S.E., Lechner J.M., Williams T., Fernando M.R. A stabilizing reagent prevents cell-free DNA contamination by cellular DNA in plasma during blood sample storage and shipping as determined by digital PCR. Clin Biochem. 2013;46:1561–1565. doi: 10.1016/j.clinbiochem.2013.06.002. [DOI] [PubMed] [Google Scholar]
- 37.Kloten V., Ruchel N., Bruchle N.O., Gasthaus J., Freudenmacher N., Steib F., Mijnes J., Eschenbruch J., Binnebosel M., Knuchel R., Dahl E. Liquid biopsy in colon cancer: comparison of different circulating DNA extraction systems following absolute quantification of KRAS mutations using Intplex allele-specific PCR. Oncotarget. 2017;8:86253–86263. doi: 10.18632/oncotarget.21134. [DOI] [PMC free article] [PubMed] [Google Scholar]
- 38.Diehl F., Schmidt K., Choti M.A., Romans K., Goodman S., Li M., Thornton K., Agrawal N., Sokoll L., Szabo S.A., Kinzler K.W., Vogelstein B., Diaz L.A., Jr. Circulating mutant DNA to assess tumor dynamics. Nat Med. 2008;14:985–990. doi: 10.1038/nm.1789. [DOI] [PMC free article] [PubMed] [Google Scholar]
- 39.To E.W., Chan K.C., Leung S.F., Chan L.Y., To K.F., Chan A.T., Johnson P.J., Lo Y.M. Rapid clearance of plasma Epstein-Barr virus DNA after surgical treatment of nasopharyngeal carcinoma. Clin Cancer Res. 2003;9:3254–3259. [PubMed] [Google Scholar]
- 40.Yao W., Mei C., Nan X., Hui L. Evaluation and comparison of in vitro degradation kinetics of DNA in serum, urine and saliva: a qualitative study. Gene. 2016;590:142–148. doi: 10.1016/j.gene.2016.06.033. [DOI] [PubMed] [Google Scholar]
- 41.Swystun L.L., Mukherjee S., Liaw P.C. Breast cancer chemotherapy induces the release of cell-free DNA, a novel procoagulant stimulus. J Thromb Haemost. 2011;9:2313–2321. doi: 10.1111/j.1538-7836.2011.04465.x. [DOI] [PubMed] [Google Scholar]
- 42.Kageyama S.I., Nihei K., Karasawa K., Sawada T., Koizumi F., Yamaguchi S., Kato S., Hojo H., Motegi A., Tsuchihara K., Akimoto T. Radiotherapy increases plasma levels of tumoral cell-free DNA in non-small cell lung cancer patients. Oncotarget. 2018;9:19368–19378. doi: 10.18632/oncotarget.25053. [DOI] [PMC free article] [PubMed] [Google Scholar]
- 43.Takai E., Totoki Y., Nakamura H., Morizane C., Nara S., Hama N., Suzuki M., Furukawa E., Kato M., Hayashi H., Kohno T., Ueno H., Shimada K., Okusaka T., Nakagama H., Shibata T., Yachida S. Clinical utility of circulating tumor DNA for molecular assessment in pancreatic cancer. Sci Rep. 2015;5:18425. doi: 10.1038/srep18425. [DOI] [PMC free article] [PubMed] [Google Scholar]
- 44.Guo N., Lou F., Ma Y., Li J., Yang B., Chen W., Ye H., Zhang J.B., Zhao M.Y., Wu W.J., Shi R., Jones L., Chen K.S., Huang X.F., Chen S.Y., Liu Y. Circulating tumor DNA detection in lung cancer patients before and after surgery. Sci Rep. 2016;6:33519. doi: 10.1038/srep33519. [DOI] [PMC free article] [PubMed] [Google Scholar]
- 45.Hench I.B., Hench J., Tolnay M. Liquid biopsy in clinical management of breast, lung, and colorectal cancer. Front Med (Lausanne) 2018;5:9. doi: 10.3389/fmed.2018.00009. [DOI] [PMC free article] [PubMed] [Google Scholar]
- 46.Shu Y., Wu X., Tong X., Wang X., Chang Z., Mao Y., Chen X., Sun J., Wang Z., Hong Z., Zhu L., Zhu C., Chen J., Liang Y., Shao H., Shao Y.W. Circulating tumor DNA mutation profiling by targeted next generation sequencing provides guidance for personalized treatments in multiple cancer types. Sci Rep. 2017;7:583. doi: 10.1038/s41598-017-00520-1. [DOI] [PMC free article] [PubMed] [Google Scholar]
- 47.Bettegowda C., Sausen M., Leary R.J., Kinde I., Wang Y., Agrawal N. Detection of circulating tumor DNA in early- and late-stage human malignancies. Sci Transl Med. 2014;6:224ra224. doi: 10.1126/scitranslmed.3007094. [DOI] [PMC free article] [PubMed] [Google Scholar]
- 48.Abbosh C., Birkbak N.J., Wilson G.A., Jamal-Hanjani M., Constantin T., Salari R. Phylogenetic ctDNA analysis depicts early-stage lung cancer evolution. Nature. 2017;545:446–451. doi: 10.1038/nature22364. [DOI] [PMC free article] [PubMed] [Google Scholar]
- 49.Frenel J.S., Carreira S., Goodall J., Roda D., Perez-Lopez R., Tunariu N., Riisnaes R., Miranda S., Figueiredo I., Nava-Rodrigues D., Smith A., Leux C., Garcia-Murillas I., Ferraldeschi R., Lorente D., Mateo J., Ong M., Yap T.A., Banerji U., Gasi Tandefelt D., Turner N., Attard G., de Bono J.S. Serial next-generation sequencing of circulating cell-free DNA evaluating tumor clone response to molecularly targeted drug administration. Clin Cancer Res. 2015;21:4586–4596. doi: 10.1158/1078-0432.CCR-15-0584. [DOI] [PMC free article] [PubMed] [Google Scholar]
- 50.Thierry A.R., Pastor B., Jiang Z.Q., Katsiampoura A.D., Parseghian C., Loree J.M., Overman M.J., Sanchez C., Messaoudi S.E., Ychou M., Kopetz S. Circulating DNA demonstrates convergent evolution and common resistance mechanisms during treatment of colorectal cancer. Clin Cancer Res. 2017;23:4578–4591. doi: 10.1158/1078-0432.CCR-17-0232. [DOI] [PMC free article] [PubMed] [Google Scholar]
- 51.Anker P., Stroun M. Tumor-related alterations in circulating DNA, potential for diagnosis, prognosis and detection of minimal residual disease. Leukemia. 2001;15:289–291. doi: 10.1038/sj.leu.2402016. [DOI] [PubMed] [Google Scholar]
- 52.Tie J., Wang Y., Tomasetti C., Li L., Springer S., Kinde I., Silliman N., Tacey M., Wong H.L., Christie M., Kosmider S., Skinner I., Wong R., Steel M., Tran B., Desai J., Jones I., Haydon A., Hayes T., Price T.J., Strausberg R.L., Diaz L.A., Jr., Papadopoulos N., Kinzler K.W., Vogelstein B., Gibbs P. Circulating tumor DNA analysis detects minimal residual disease and predicts recurrence in patients with stage II colon cancer. Sci Transl Med. 2016;8:346ra392. doi: 10.1126/scitranslmed.aaf6219. [DOI] [PMC free article] [PubMed] [Google Scholar]
- 53.Heitzer E., Perakis S., Geigl J.B., Speicher M.R. The potential of liquid biopsies for the early detection of cancer. NPJ Precis Oncol. 2017;1:36. doi: 10.1038/s41698-017-0039-5. [DOI] [PMC free article] [PubMed] [Google Scholar]
Associated Data
This section collects any data citations, data availability statements, or supplementary materials included in this article.