

Recent years have seen the discovery of several families of giant DNA viruses infecting the ubiquitous amoebozoa of the genus Acanthamoeba. With double-stranded DNA (dsDNA) genomes reaching 2.5 Mb in length packaged in oblate particles the size of a bacterium, the pandoraviruses are currently the most complex and largest viruses known. In addition to their spectacular dimensions, the pandoraviruses encode the largest proportion of proteins without homologs in other organisms, which is thought to result from a de novo gene creation process. While using comparative genomics to investigate the evolutionary forces responsible for the emergence of such an unusual giant virus family, we discovered a unique bias in the tetranucleotide composition of the pandoravirus genomes that can result only from an undescribed evolutionary process not encountered in any other microorganism.
KEYWORDS: 4-mer statistics, chaos game representation, DNA editing, genome composition, giant viruses, host-virus relationship, Pandoravirus
ABSTRACT
Pandoraviridae is a rapidly growing family of giant viruses, all of which have been isolated using laboratory strains of Acanthamoeba. The genomes of 10 distinct strains have been fully characterized, reaching up to 2.5 Mb in size. These double-stranded DNA genomes encode the largest of all known viral proteomes and are propagated in oblate virions that are among the largest ever described (1.2 μm long and 0.5 μm wide). The evolutionary origin of these atypical viruses is the object of numerous speculations. Applying the chaos game representation to the pandoravirus genome sequences, we discovered that the tetranucleotide (4-mer) “AGCT” is totally absent from the genomes of 2 strains (Pandoravirus dulcis and Pandoravirus quercus) and strongly underrepresented in others. Given the amazingly low probability of such an observation in the corresponding randomized sequences, we investigated its biological significance through a comprehensive study of the 4-mer compositions of all viral genomes. Our results indicate that AGCT was specifically eliminated during the evolution of the Pandoraviridae and that none of the previously proposed host-virus antagonistic relationships could explain this phenomenon. Unlike the three other families of giant viruses (Mimiviridae, Pithoviridae, and Molliviridae) infecting the same Acanthamoeba host, the pandoraviruses exhibit a puzzling genomic anomaly suggesting a highly specific DNA editing in response to a new kind of strong evolutionary pressure.
IMPORTANCE Recent years have seen the discovery of several families of giant DNA viruses infecting the ubiquitous amoebozoa of the genus Acanthamoeba. With double-stranded DNA (dsDNA) genomes reaching 2.5 Mb in length packaged in oblate particles the size of a bacterium, the pandoraviruses are currently the most complex and largest viruses known. In addition to their spectacular dimensions, the pandoraviruses encode the largest proportion of proteins without homologs in other organisms, which is thought to result from a de novo gene creation process. While using comparative genomics to investigate the evolutionary forces responsible for the emergence of such an unusual giant virus family, we discovered a unique bias in the tetranucleotide composition of the pandoravirus genomes that can result only from an undescribed evolutionary process not encountered in any other microorganism.
INTRODUCTION
The pandoraviruses are among the growing number of families of environmental giant DNA viruses infecting protozoans and isolated using the laboratory host Acanthamoeba (Protozoa/Lobosa/Ameobida/Acanthamoebidae/Acanthamoeba) (1–4). As of today, they exhibit the largest fully characterized viral genomes, made of linear double-stranded DNA (dsDNA) molecules from 1.9 to 2.5 Mb in size and predicted to encode up to 2,500 proteins (1–3). After their internalization by phagocytosis, these viruses multiply in their amoebal host through a lytic cycle lasting about 12 h, ending with the production of hundreds of giant amphora-shaped particles (1.2 μm long and 0.5 μm wide) (1–3). The phylogenetic structure of the Pandoraviridae family exhibits two separate clusters referred to as the A and B clades (2, 3) (Fig. 1). Despite this clear phylogenetic signal (computed using a core set of 455 orthologous proteins), strains belonging to clade A or B did not exhibit noticeable differences in terms of virion morphology, infectious cycle, host range, or global genome structure and statistics (e.g., nucleotide composition, gene number, and gene density) (1–3).
FIG 1.
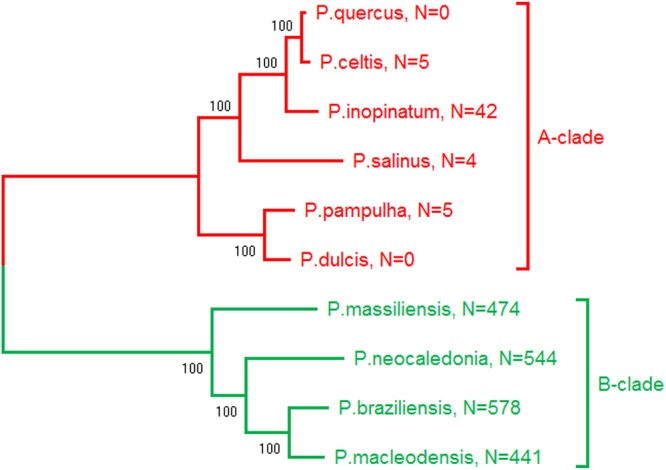
Phylogenetic structure of the Pandoraviridae. (Adapted from reference 3.) The number of occurrences of the AGCT 4-mer is indicated for the genome of each strain. The counts are given for one DNA strand and are identical for both strands (AGCT is palindromic).
In addition to their unusual virion morphology and gigantic genomes, the pandoraviruses exhibit other unique features, such as an unmatched proportion (>90%) of genes coding for proteins without any database homologs (ORFans) outside the Pandoraviridae family and strain-specific genes contributing to an unlimited pan-genome (1–3). These features, confirmed by the analysis of additional strains (5), led us to suggest that a process of de novo and in situ gene creation might be at work in pandoraviruses (2, 3). Following this history of unexpected findings, we thought that further analyses of the Pandoraviridae might reveal additional surprises.
While searching for hidden genomic patterns eventually linked to evolutionary processes unique to the pandoraviruses, we used a chaos game graphical representation of their genome sequences (6, 7). This method converts a long one-dimensional DNA sequence into a fractal-like image, through which a human observer may detect specific patterns. This representation illustrates in a holistic manner the frequencies of all oligonucleotides of arbitrary length k (k-mers) in a given DNA sequence. Using this approach led us to discover that the 4-mer AGCT was uniquely absent from the genome of Pandoravirus dulcis, providing the starting point of the present study (Fig. 2).
FIG 2.
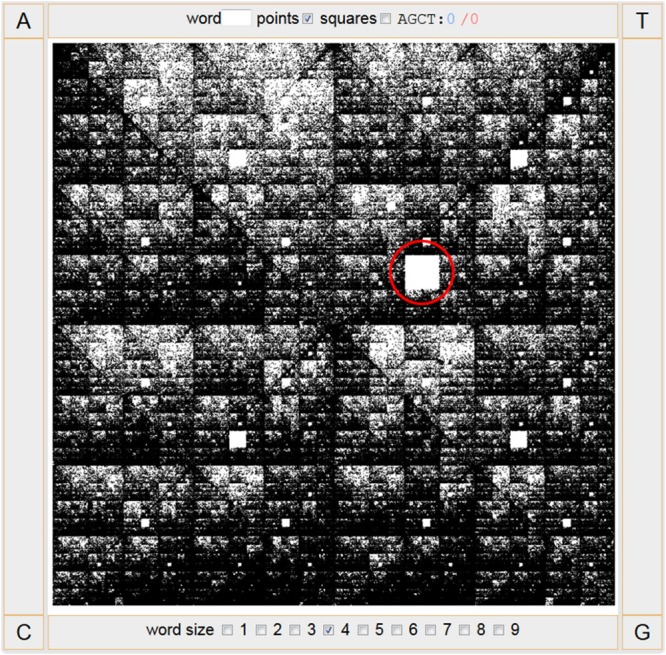
Chaos game representation of the P. dulcis genome. The largest square left blank (circled in red) corresponds to “AGCT,” indicating the absence of this 4-mer in the genome.
(This article was submitted to an online preprint archive [8].)
RESULTS
The absence of any given 4-mer in a long random DNA sequence is highly improbable.
After detecting the absence of the “AGCT” word in the chaos game graphical representation of the P. dulcis genome, we computed the number of occurrence of all 4-mers in the 10 available Pandoravirus genome sequences using direct counting (9). This revealed that AGCT was also absent from the genome of Pandoravirus quercus. Notice that although these strains belong to the same A clade, their genome sequences are nevertheless far from identical (their orthologous coding regions share 72% nucleotide identity on average); hence, the common missing AGCT is not a mere consequence of their sequence similarity.
Such a plain finding might not sound very interesting until one realizes to what extent not encountering a single occurrence of AGCT in DNA sequences of, 1,908,524 bp (P. dulcis) and 2,077,288 bp (P. quercus) is unlikely, as shown below using increasingly sophisticated computations.
In the simplest case, let us first consider a random DNA sequence with equal proportions of the four nucleotides (%A = %T = %C = %G = 25%). Since there are 256 distinct 4-mers, the probability for each of them to occur at a given position in an increasingly long sequence tends to PAGCT = 1/256. In a random sequence of approximately 2 Mbp, one thus expects an average of about 7,800 occurrences for each distinct 4-mer. This already suggests how unlikely it is for one of them to be absent.
To estimate the order of magnitude of such a probability, the DNA sequence is seen as consisting of 4 sets of nonoverlapping 4-mers collected according to 4 different “reading frames” (e.g., 4-mers 1 to 4, 5 to 8, 9 to 12, …, etc., for frame 1). The different reading frames thus correspond to approximately 500,000 positions each.
At each of these positions, the probability for AGCT not to occur is QAGCT = 255/256. For one reading frame, this probability becomes approximately QAGCT = (255/256)500,000 ≅ 1.210−850 and 4 × QAGCT ≅ 510−850 for the 4 reading frames (assuming them to be independent for the sake of simplicity).
Such a value is smaller than any that could be computed in reference to a physical process. For instance, 1 s approximately corresponds to 2 × 10⁻¹⁸ of the age of the universe.
The above probability should actually be corrected to account for the fact that we did not specifically search for “AGCT” while analyzing the viral genome. Any missing 4-mer would have raised the same interest. A Bonferroni correction should then be applied to compensate for the multiple testing of 256 different 4-mers. However, the probability of not finding any 4-mer, Qany, remains an incommensurably small number: Qany ≅ 256 × 510−850 ≅ 1.310−847.
We may further argue that this event was bound to occur in at least one genome given the huge amount of DNA sequence information that is now available, for instance, in GenBank. The calculation runs as follows. The April 2019 release of GenBank contains about 3.2 × 10¹¹ bp. Assuming that all GenBank entries are 2-Mb-long sequences, this would correspond to 1.6 × 10⁵ theoretical pandoravirus genomes. The order of magnitude of the probability of observing one of them missing any of the 4-mers remains amazingly small at about Qany/GenBank ≅ 1.6105 × Qany ≅ 2.110−842.
Finally, one may want to make a final adjustment by taking into account that the P. dulcis genome is 64% G+C rich. This slightly changes the probability of random occurrence of AGCT from PAGCT = 1/256 = 0.00391 to PAGCT = (0.18)2 × (0.32)2 = 3.3110−3 and then 4 × QAGCT = (1 − PAGCT)500,000 ≅ 8.910−719.
Using the same Bonferroni correction as above leads to the final conservative estimate, Qany/GenBank < 410−711, which is still an incommensurably small probability (e.g., the same as not getting a single head in 2,360 tosses of a fair coin).
As the above computation remains an approximation (neglecting the overlap of neighboring 4-mers), we estimated how unlikely it is that any 4-mer would be missing from large DNA sequences by a different approach. We computer generated a large number of random sequences of increasing sizes and recorded the threshold at which point none of the 4-mers is missing. Figure 3 displays the results of such a computer experiment. It shows how fast the probability of any 4-mer missing decreases with the random sequence size. In this experiment, we found that the proportion of sequences larger than 10,000 bp missing anyone of the 256 4-mers was less than 1/10,000.
FIG 3.
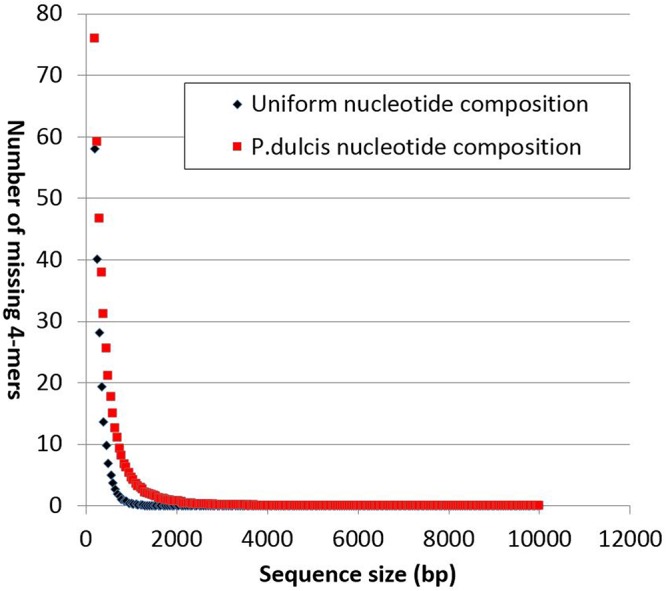
Influence of random sequence length on the number of missing 4-mers. Ten thousand random sequences up to 10,000 bp in size were analyzed. Except for extremely rare fluctuations, no sequence longer than 4,000 bp exhibits a missing 4-mer. Four-mer overlaps as well as nucleotide compositions are taken into account in this analysis.
Caveat: randomized sequences exhibit strongly unnatural 4-mer distributions.
The above results already suggested that it is impossible for the P. dulcis and P. quercus genomes to be missing “AGCT” solely by chance without invoking a biological constraint. However, this conclusion rests on the assumption that the randomization process suitably modeled these genomes. However, the frequency distribution of the various 4-mers found in the actual P. dulcis genome (and in those of other pandoraviruses) and the one computed from its randomized sequence are strongly different (Fig. 4). While the natural sequence consists of 4-mers occurring at frequencies distributed along a large and rather continuous interval, the randomized sequence exhibits 4-mers occurring around 5 narrow peaks of frequencies with none in between. As expected from a good-quality randomization, these peaks correspond to the frequencies of the five types of 4-mers: those consisting of only A or T at the lower end, those consisting of only G or C at the higher end, and those consisting of (A or T)/(G or C) in the proportions 1/3, 2/2, and 3/1 in between. The more continuous and spread-out natural distribution is the testimony of multiple evolutionary constraints, most of them unknown, that have resulted in a distinct 4-mer usage, like a dialect or a language tic inherited from past generations (10).
FIG 4.
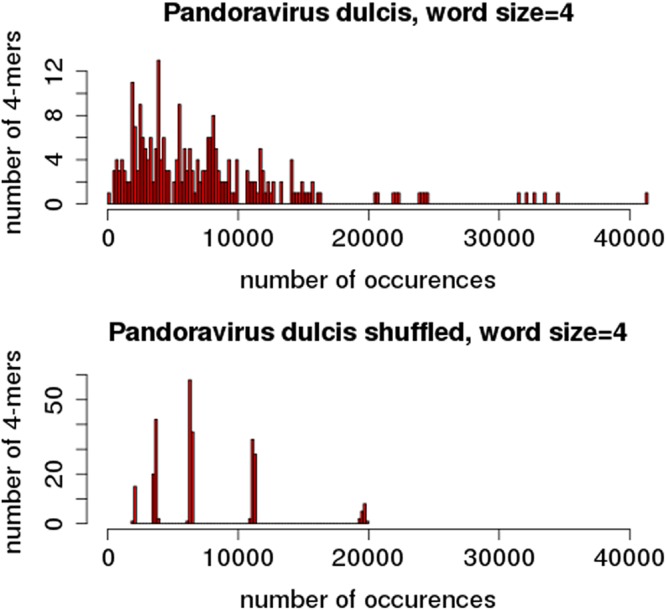
Distribution of 4-mer frequencies in natural and randomized genome sequences. Top, histogram of the number of distinct 4-mers occurring at various numbers of occurrences in the P. dulcis genome. Bottom, same analysis after randomization.
First, notice that the missing AGCT does not correspond to the 4-mer type with the lowest expected frequency (it corresponds to that with the middle one). Second, it is clear that the above probability calculations based on such a distorted model of the natural sequence cannot be used as a reliable estimate of statistical significance. This problem is similar to the one encountered when trying to evaluate the quality of local sequence alignments in similarity searches (11, 12).
We can mitigate the effect of the above stringent randomization (only preserving the original nucleotide composition) by using the actual P. dulcis and P. quercus genome sequences to evaluate to what extent the absence of AGCT might be the mere statistical consequence of the frequency of its constituent 3-mers, AGC and GCT.
As shown in Table 1, AGC and GCT are not among the least frequent 3-mers found in the P. dulcis or P. quercus genome. As the theoretical average is 1/64 (≈ 0.0156), their proportions range from 0.0156 to 0.0097 within the coding and noncoding regions of the genomes. On one given strand, AGC and GCT also do not strongly segregate from each other in coding versus intergenic regions (Table 1). By combining the AGC 3-mer frequency with that of the single nucleotide T [P(T) =0.182 for P. dulcis; P(T) =0.196 for P. quercus], the expected number of AGCT 4-mers per strand is 4,286 for P. dulcis and 4,898 for P. quercus, while none is observed. Such a stark contrast between expected and observed values is unique to the AGCT 4-mer. By comparison, the palindromic “ACGT” 4-mer (with an identical composition) exhibits a statistical behavior (Table 1, last two rows) much closer to that of the 3-mer-dependent random sequence model.
TABLE 1.
Distribution of the AGC and the complementary GCT 3-mers
| Parameter | Value for: |
|
|---|---|---|
| P. dulcis | P. quercus | |
| Genome size (bp) | 1,908,524 | 2,077,288 |
| Frequency (strand 1) | ||
| AGC | ||
| Inter-ORF | 0.0101 (1/99) | 0.0098 (1/102) |
| ORF | 0.0112 (1/89) | 0.0110 (1/90) |
| Global | 0.0109 (1/92) | 0.0106 (1/94) |
| GCT | ||
| Inter-ORF | 0.0102 (1/98) | 0.0097 (1/103) |
| ORF | 0.0156 (1/64) | 0.0145 (1/68) |
| Global | 0.0138 (1/72) | 0.0129 (1/77) |
| AGC/GCT (2 strands, global) | 0.0123 (1/81) | 0.0118 (1/85) |
| AGC/GCT overall rank | 37/64 | 43/64 |
| P(AGC) × P(T) | 2.24 × 10⁻³ (1/446) | 2.31 × 10⁻³ (1/432) |
| AGCT expected no. [one strand × P(AGC) × P(T)] | 4,286 | 4,898 |
| AGCT observed no. | 0 | 0 |
| ACGT expected no. [one strand × P(ACG) × P(T)] | 7,884 | 8,387 |
| ACGT observed no. | 5,822 | 6,165 |
No 4-mer is missing from the largest actual viral genomes.
As vividly illustrated in Fig. 4, the 4-mer distributions in randomized sequences strongly depart from that in natural genomes. We thus analyzed all complete genome sequences available in the viral section of GenBank (13) to investigate to what extent the absence of a given 4-mer was exceptional for genomes in the size range corresponding to pandoraviruses.
We found that the next-largest viral genomes missing 4-mers were those of five phages infecting enterobacteria, with unusual genome sizes in the 345- to 359-kb range (14–17). Except for P. dulcis and P. quercus, none of the 26 largest publicly available viral genomes (including those of 25 large/giant eukaryotic viruses and phage G) (13) were missing a 4-mer (Fig. 5). Thus, even in comparison with natural sequences, P. dulcis and P. quercus appear to be exceptional.
FIG 5.

Missing 4-mers in the largest viral genomes. Except for P. dulcis and P. quercus, the largest viral genomes missing a 4-mers are those of 5 distinct bacteriophages (accession numbers NC_019401, NC_025447, NC_027364, NC_027399, and NC_019526).
We noticed that the five large enterobacterium-infecting phages pointed out by our analysis were all missing the same “GCGC” 4-mer although they exhibit divergent genomic sequences and were isolated from different hosts (14–17). This palindromic 4-mer might be the target of isoschizomeric restriction endonucleases functionally homologous to HhaI found in Haemophilus haemolyticus, a gammaproteobacterium. Many of them have been described (https://enzymefinder.neb.com). We will return to the hypothesis that some 4-mers might be missing in response to a host or viral defense mechanism (18) in Discussion.
The anomalous distribution of AGCT correlates with the Pandoraviridae phylogenetic structure.
The absence of AGCT in P. dulcis and P. quercus genomes becomes even more intriguing when put in the context of the phylogenetic structure of the whole pandoravirus family. As shown in Fig. 1, the Pandoraviridae neatly cluster into two separate clades. For well-conserved proteins (such as the DNA PolB), the percentage of identical residues between intraclade orthologs is in the range of 82% to 90%, and that between the two clades is in the range of 72% to 76%. The corresponding genome sequences thus are far from being identical (and are only partially colinear) within each clade. It is thus quite remarkable that the AGCT count exhibits a consistent trend to be very low in A-clade members and is at least 10 times higher in B-clade strains. Such a contrast was strong enough to preclassify three unpublished isolates prior to complete genome assembly and finishing (data not shown).
The large difference in AGCT counts could be due to the deletion of a genomic region concentrating most of them, for instance, within a repeated structure absent from the A-clade isolates. However, Fig. 6 shows that this is not at all the case. In B-clade isolates, the numerous occurrences of AGCT are rather uniformly distributed along the whole genomes. However, we noticed that the AGCT distribution in the Pandoravirus neocaledonia genome exhibits a change of slope at one of its extremities, as if the corresponding segment had been acquired from a A-clade strain. Such a hypothesis was confirmed using a dot plot comparison with the Pandoravirus salinus genome, to which this terminal segment is clearly homologous (Fig. 7).
FIG 6.

Cumulative distribution of AGCT occurrences along the different pandoravirus genomes. The AGCT word is uniformly spread throughout the B-clade pandoravirus genomes, except for a clear rarefaction at the end of the P. neocaledonia genome sequence.
FIG 7.
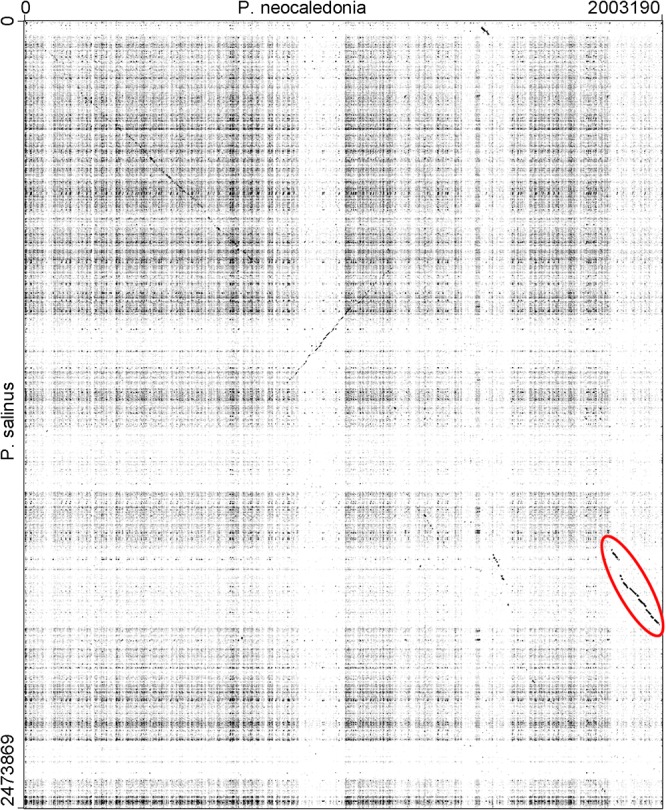
DNA sequence dot plot comparison of P. neocaledonia (horizontal) and P. salinus (vertical). The two genomes exhibit only remnants of collinearity except for the terminal region of P. neocaledonia (red circle), coinciding with a low AGCT density typical of A-clade strains (Fig. 6). The dot plot was generated using GEPARD (35) with the following parameters: word size = 15, window size = 0.
AGCT is specifically deleted from A-clade pandoravirus genomes.
We have seen in the previous section that the extreme difference in the AGCT count in P. dulcis (n = 0) and P. neocaledonia (n = 544) is not due to the local deletion of an AGCT-rich segment. We then investigated whether that difference was limited to AGCT or whether other 4-mers exhibited large differences in counts. Figure 8 shows that the latter was not the case.
FIG 8.

Comparison of the proportions of all 4-mers in P. dulcis (A clade) versus P. neocaledonia (B clade). The 4 most frequent 4-mers are GCGC, CGCG, CGCC, and GGCG.
Although the frequencies of the various 4-mers within each genome exhibit tremendous differences (very much at odds with their distribution in randomized sequences [Fig. 4]), the frequency for each 4-mer (low, average, or high) was very similar across the two different viral genomes (Spearman correlation, r = 0.9859). The difference in AGCT count is thus not the consequence of the use of globally distinct 4-mer vocabularies by the two pandoravirus clades. It appears to be due to a selection specifically exerted against the presence of AGCT in the genomes of A-clade pandoraviruses.
Another argument in favor of an active selection against the presence of AGCT is provided by the following statistical computation. We first identified the orthologous proteins in P. dulcis and P. neocaledonia, using the best-reciprocal BLASTP match criterion. We identified 585 orthologous open reading frames (ORFs). In P. neocaledonia, 180 of them were found to contain one or several AGCT 4-mers (for a total of 350 occurrences). We then computed the average percentage of nucleotide identity in the alignments of these 180 P. neocaledonia ORFs with their P. dulcis orthologous counterparts. The value was 69%.
According to a neutral scenario (and neglecting multiple hits), the probability is thus P = 0.69 that any nucleotide remains the same along the evolutionary trajectory separating the two pandoraviruses. For a given AGCT, the probability to remain intact over the same evolutionary distance is Pintact = 0.694 = 0.227, such as none of the four positions is changed. For the sake of simplicity, we will neglect the chance creation of new AGCT during the process. As a result, we then expect P. dulcis orthologous ORFs to exhibit 68 occurrences (i.e., 0.227 × 350) of AGCT.
This simple calculation already indicates that the AGCT 4-mer diverged much faster (at least 80 times faster, since 350 × 0.227/80 < 1) than the rest of the orthologous coding regions. This result suggests that the absence of AGCT in P. dulcis and P. quercus, as well as its distinctive low frequency in all A-clade strains, is the consequence of an active counterselection. We discuss possible molecular mechanisms below. The calculation above could not be extended to inter-ORF regions due to their much lower conservation and their unreliable pairwise alignments.
DISCUSSION
Which model should be used for the counterselection of AGCT?
Following our statistical computations on random sequences confirmed by the analysis of actual genome sequences, we can safely assume that the genome of the common ancestor of the A- and B-clade pandoraviruses was not missing any 4-mers. Our discussion will thus take for granted that the difference in “AGCT” frequency between the two Pandoraviridae clades is the consequence of a loss in the A clade rather than a gain in the B clade. Such a phenomenon probably predated the split of the two clades, as the number of AGCT 4-mers found in B-clade Pandoravirus genomes (≈500) is already 15 times lower than that expected in the corresponding randomized sequences (≈7,800).
Any model proposed to explain our results must take into account that the two types of pandoraviruses replicate with the same efficiency in various laboratory strains of Acanthamoeba. From this we can reasonably assume that the two clades do not differ much in their range of natural hosts (one of which is known to be an Acanthamoeba for A-clade Pandoravirus inopinatum [19]). The cause of the marked difference in AGCT counts between the two clades must thus reside within the viruses themselves. Such an inference is further supported by the fact that none of the other families of giant viruses (4) infecting the very same Acanthamoeba hosts exhibit a similar 4-mer anomaly in their genome composition.
The first model that comes to mind is inspired from the well-documented restriction/modification systems that many bacteria use to counteract bacteriophage infections. The host bacterial cells express DNA site (most often short palindrome)-specific endonucleases that cut the invading phage genome before it could replicate. Such a defense mechanism causes the bacterium to protect the cognate motif in its own genome using a specific methylase. According to the Red Queen evolutionary concept, the bacteriophages could counteract the host’s defense by removing the targeted site from their own genome (18). The absence of the palindrome “GCGC” that we previously noticed in several large enterobacterial phages (14–17) could result from such an evolutionary strategy.
Translating such a model in our system thus requires three distinct assumptions: (i) that the Acanthamoeba cells express an antiviral endonuclease specific for AGCT, (ii) that B-clade pandoraviruses are immune to it (as are other Acanthamoeba-infecting viruses), and (iii) that A-clade pandoraviruses evolved a different strategy by removing the endonuclease target from their genomes.
Such a model was readily invalidated by simply attempting to digest the B-clade P. neocaledonia genomic DNA (extracted from infectious particles) with commercial restriction enzymes such as PvuII, targeting “cAGCTg” (212 occurrences), and AluI, targeting AGCT (544 occurrences). The resulting pulsed-field gel electrophoresis (PFGE) pattern showed that these sites were not protected (Fig. 9). Accordingly, the PacBio data used to sequence the P. neocaledonia genome (2) did not indicate the presence of modified nucleotides at the AGCT sites (20).
FIG 9.
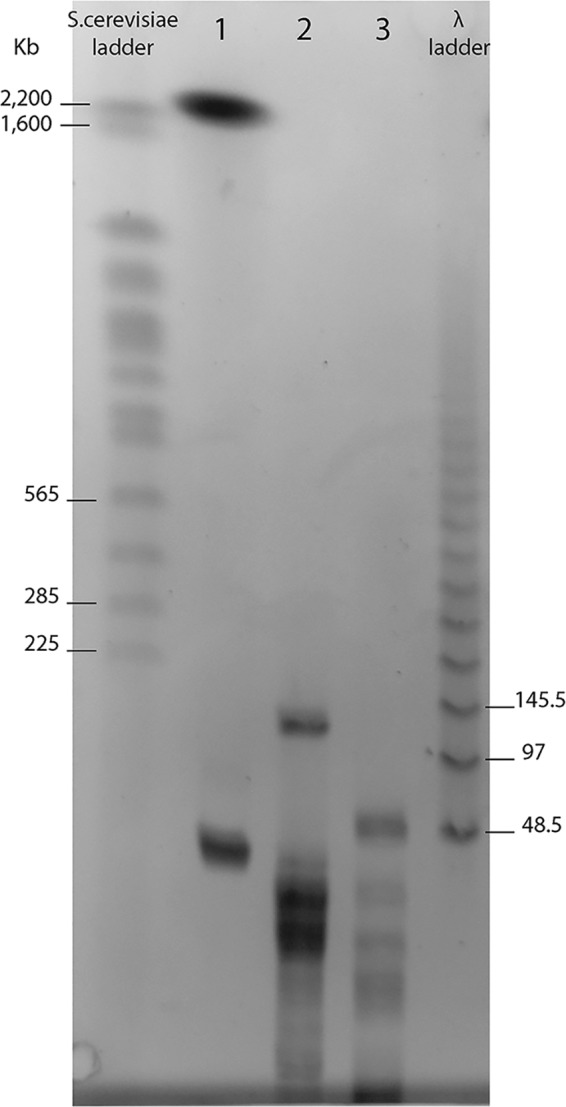
Digestion of P. neocaledonia DNA at AGCT sites. Lane 1, undigested P. neocaledonia DNA (2.2 Mb) migrating as expected. The bottom band (below 48.5 kb) corresponds to an episome that is not always present. Lane 2, P. neocaledonia DNA digested by the PvuII restriction enzyme (cutting site, cAGCTg). Lane 3, P. neocaledonia DNA digested by the AluI restriction enzyme (cutting site, AGCT). These results demonstrate that the AGCT sites are not protected by modified nucleotides.
We must point out that the above results simultaneously invalidate a symmetrical model where the AGCT-specific endonuclease would have been encoded by the pandoraviruses, together with the protective cognate methylase. Such a hijacked restriction/modification system would have been attractive, as it is found in chloroviruses (21), another family of large eukaryotic DNA viruses. Unfortunately, this does not apply here. Accordingly, no homolog of the cognate DNA methyltransferase was detected among the P. neocaledonia or Pandoravirus macleodensis protein-coding gene contents. Further disqualifying such a hypothetical restriction/modification model, no difference in terms of a potentially relevant endonuclease or DNA methylase was found between the gene contents of the A-clade P. dulcis and P. quercus and those of the B-clade P. neocaledonia and P. macleodensis.
A more hypothetical model would assume that the AGCT motif is targeted at the transcript level (i.e., AGCU) rather than at the DNA level. Classical endonucleases and DNA methylases would thus not be involved in the host-virus confrontation. There are several arguments against a mechanism directly targeting viral transcripts.
First, as B-clade pandoraviruses exhibit similar proportions of AGCT in ORFs and inter-ORF regions, the A-clade strains would have had no incentive to eliminate the motif from their intergenic regions, as P. dulcis and P. quercus have done totally in reaching zero occurrences. AGCT is also still present in some protein-coding regions of P. inopinatum (n = 15), P. salinus (n = 3), and Pandoravirus celtis (n = 1).
Second, very few motif-specific RNases are known, and to our knowledge, only one is viral: a protein encoded in the bacteriophage T4 RegB gene (22). We found no significant homolog of this protein in the pandoraviruses or Acanthamoeba. We also looked for mRNA methylases that could act as a protective mechanism for the viral transcript. A single one was described in another family of eukaryotic DNA virus: the product of the Megavirus Mg18 gene (23). Again, no significant homolog of this protein was detected in the pandoraviruses.
In conclusion to this section, if the presence of AGCT decreases the virus fitness, we found no evidence that this is due to a DNA or RNA nuclease-mediated defense mechanism in Acanthamoeba. However, it could still be due to an unknown inhibitory mechanism acting at the transcription regulation level to which B-clade pandoviruses would exhibit some immunity. The corresponding proteins could be encoded among the numerous ORFans found in pandoravirus genomes (1–3). Alternatively, the AGCT deficit could be due to a restriction imposed by unknown additional hosts in nature, although this is quite an unlikely scenario given the ubiquity and abundance of Acanthamoeba in the environment.
Finally, could AGCT be deleterious for some intrinsic reasons, for instance, due to its palindromic structure and composition? This is very unlikely when one compares the absent AGCT in P. dulcis and P. quercus with other 4-mers with identical structures and compositions. For instance, “ACGT” occurs at 5,822 and 6,165 positions (in P. dulcis and P. quercus, respectively), and “GATC” occurs 8,114 and 8,567 times in (P. dulcis and P. quercus, respectively). The presence or absence of AGCT also does not exert a strong constraint on protein sequences, as the amino acids encoded by AGC or GTC (serine and alanine, respectively) have many possible alternative codons and are easily replaceable residues given their mild physicochemical properties. Finally, we found no evidence that the removal of AGCT was due to a specific (for instance, enzyme-mediated) process targeting and then replacing the forbidden 4-mer by a constant alternative word. Replacement patterns for 72 P. dulcis sites unambiguously mapped to their homologous P. neocaledonia AGCT counterparts are indicated in Table 2. This suggests that the complete loss of AGCT in the A-clade strains is due to a stringent, but nevertheless random (i.e., nondirected) evolutionary process.
TABLE 2.
Homologous site replacements between P. neocaledonia and P. dulcis
| P. neocaledonia → P. dulcis variant | No. |
|---|---|
| AGCT → AGTT | 31 |
| AGCT → AACT | 18 |
| AGCT → GGCT | 4 |
| AGCT → AACC | 4 |
| AGCT → AATT | 3 |
| AGCT → GGCG | 2 |
| AGCT→ [ACGA, ACTT, AGAT, AGCC, AGGC, CATT, GGCC, GGTT, GTCT, TGCC, TGGT, TGTC] | 1 |
The analysis of long nucleotide (and amino acid) sequences as overlapping k-mers has a long history in bioinformatics. Initially proposed in the context of the RNA folding problem (23), the concept was then quickly applied to many other areas, including gene parsing (24) and the detection of regulatory motifs (25, 26), and has become central to the fast implementation of large-scale similarity searching (27, 28), sequence assembly (29), and the binning of metagenomic data (30, 31). However, its popularity should not hide that most of the observed frequency disparities (starting from the simplest mononucleotide composition) between k-mers within a given organism or across species have not yet received convincing biological explanations (32, 33). This suggests that profound and unexpected biological insights may one day come from the analysis of k-mer frequencies, and in particular from their most improbable fluctuations. In a daring parallel with the delayed understanding of the CRISPR/CAS system from the initial spotting of intriguing repeats (34), we would like to expect that the Pandoraviridae AGCT distribution anomaly might lead to the discovery of a novel defense mechanism against viral infection.
MATERIALS AND METHODS
CGR.
Chaos game representation (CGR) was introduced in 1990 by Jeffrey (6) to visually detect global patterns in large DNA sequences. It was inspired by a method generating fractals within a polygon as a sequence of points, iteratively positioned according to a rule based on their distance to one of the vertices of the polygon. To apply this method to DNA sequences, one uses a square with corners labeled A, T, G, and C. Starting from the center of the square, the sequence is used to determine the position of the next point at the center of the line connecting the previous point and the corner corresponding to the current nucleotide. In addition to global patterns, the resulting graph also reveals the differential frequencies of substrings (k-mers), for instance, leaving a blank area at the position corresponding to a missing substring (Fig. 2). CGR thus allows the rapid detection of compositional anomaly of k-mers for increasing n values, instead of comparing large statistical tables. Once the k-mer (4-mer) distributions of interest were determined by CGR, they were further analyzed and compared using a standard counting package (9).
PFGE.
For pulsed-field gel electrophoresis (PFGE), approximately 5,000 pandoravirus particles were embedded in 1% low-gelling-temperature agarose, and the plugs were incubated in lysis buffer (50 mM Tris-HCl [pH 8.0], 50 mM EDTA, 1% [vol/vol] N-laurylsarcosine, 1 mM dithiothreitol [DTT], and 1 mg/ml proteinase K) for 16 h at 50°C. After lysis, the plugs were washed once in sterile water and twice in TE buffer (10 mM Tris-HCl [pH 8.0] and 1 mM EDTA) with 1 mM phenylmethylsulfonyl fluoride (PMSF) for15 min at 50°C. The plugs were then equilibrated in the appropriate restriction buffer and digested with 20 units of PvuII or AluI at 37°C for 14 h. Digested plugs were washed once in sterile water for 15 min, once in lysis buffer for 2 h, and three times in TE buffer. Electrophoresis was carried out in 0.5× Tris-acetate-EDTA (TAE) for 18 h at 6 V/cm, 120° included angle, and 14°C constant temperature in a CHEF-Mapper system (Bio-Rad) with pulsed times ramped from 0.2 s to 120 s.
Availability of data.
All virus genome sequences analyzed in this work are freely available from the public GenBank repository. The Pandoravirus sequences used here correspond to the following accession numbers: P. dulcis, NC_021858; P. neocaledonia, NC_037666; P. macleodensis, NC_037665; P. salinus, NC_022098; P. quercus, NC_037667; P. celtis, MK174290; P. inopinatum, NC_026440; P. pampulha, LT972219; P. massiliensis, LT972215; and P. braziliensis, LT972217.
ACKNOWLEDGMENTS
We thank Sacha Schutz for his inspiring blog (http://dridk.me/), which initiated our interest in the chaos game representation technique. We thank Matthieu Legendre for verifying the absence of modified nucleotides at AGCT sites using the PacBio sequence data.
Our laboratory is supported by the French National Research Agency, France Genomique, the Institut Français de Bioinformatique, the Fondation Bettencourt-Schueller, and the Sud region. We acknowledge the support of the PACA-Bioinfo platform.
The funding bodies had no role in the design of the study, analysis and interpretation of data, or writing the manuscript.
We declare that we have no competing interests.
REFERENCES
- 1.Philippe N, Legendre M, Doutre G, Couté Y, Poirot O, Lescot M, Arslan D, Seltzer V, Bertaux L, Bruley C, Garin J, Claverie JM, Abergel C. 2013. Pandoraviruses: amoeba viruses with genomes up to 2.5 Mb reaching that of parasitic eukaryotes. Science 341:281–286. doi: 10.1126/science.1239181. [DOI] [PubMed] [Google Scholar]
- 2.Legendre M, Fabre E, Poirot O, Jeudy S, Lartigue A, Alempic JM, Beucher L, Philippe N, Bertaux L, Christo-Foroux E, Labadie K, Couté Y, Abergel C, Claverie JM. 2018. Diversity and evolution of the emerging Pandoraviridae family. Nat Commun 9:2285. doi: 10.1038/s41467-018-04698-4. [DOI] [PMC free article] [PubMed] [Google Scholar]
- 3.Legendre M, Alempic JM, Philippe N, Lartigue A, Jeudy S, Poirot O, Ta NT, Nin S, Couté Y, Abergel C, Claverie JM. 2019. Pandoravirus celtis illustrates the microevolution processes at work in the giant Pandoraviridae genomes. Front Microbiol 10:430. doi: 10.3389/fmicb.2019.00430. [DOI] [PMC free article] [PubMed] [Google Scholar]
- 4.Abergel C, Legendre M, Claverie JM. 2015. The rapidly expanding universe of giant viruses: Mimivirus, Pandoravirus, Pithovirus and Mollivirus. FEMS Microbiol Rev 39:779–796. doi: 10.1093/femsre/fuv037. [DOI] [PubMed] [Google Scholar]
- 5.Aherfi S, Andreani J, Baptiste E, Oumessoum A, Dornas FP, Andrade A, Chabriere E, Abrahao J, Levasseur A, Raoult D, La Scola B, Colson P. 2018. A large open pangenome and a small core genome for giant pandoraviruses. Front Microbiol 9:1486. doi: 10.3389/fmicb.2018.01486. [DOI] [PMC free article] [PubMed] [Google Scholar]
- 6.Jeffrey HJ. 1990. Chaos game representation of gene structure. Nucleic Acids Res 18:2163–2170. doi: 10.1093/nar/18.8.2163. [DOI] [PMC free article] [PubMed] [Google Scholar]
- 7.Hoang T, Yin C, Yau SS. 2016. Numerical encoding of DNA sequences by chaos game representation with application in similarity comparison. Genomics 108:134–142. doi: 10.1016/j.ygeno.2016.08.002. [DOI] [PubMed] [Google Scholar]
- 8.Poirot O, Jeudy S, Abergel C, Claverie J-M. 2019. A spectacular anomaly in the 4-mer composition of the giant pandoravirus genomes reveals a stringent new evolutionary selection process. bioRxiv 10.1101/712018. [DOI] [PMC free article] [PubMed]
- 9.Mullan LJ, Bleasby AJ. 2002. Short EMBOSS user guide. Brief Bioinform 3:92–94. doi: 10.1093/bib/3.1.92. [DOI] [PubMed] [Google Scholar]
- 10.Phillips GJ, Arnold J, Ivarie R. 1987. Mono- through hexanucleotide composition of the Escherichia coli genome: a Markov chain analysis. Nucleic Acids Res 15:2611–2626. doi: 10.1093/nar/15.6.2611. [DOI] [PMC free article] [PubMed] [Google Scholar]
- 11.Altschul SF, Erickson BW. 1985. Significance of nucleotide sequence alignments: a method for random sequence permutation that preserves dinucleotide and codon usage. Mol Biol Evol 2:526–538. doi: 10.1093/oxfordjournals.molbev.a040370. [DOI] [PubMed] [Google Scholar]
- 12.Pagni M, Jongeneel CV. 2001. Making sense of score statistics for sequence alignments. Brief Bioinform 2:51–67. doi: 10.1093/bib/2.1.51. [DOI] [PubMed] [Google Scholar]
- 13.Brister JR, Ako-Adjei D, Bao Y, Blinkova O. 2015. NCBI viral genomes resource. Nucleic Acids Res 43:D571–7. doi: 10.1093/nar/gku1207. [DOI] [PMC free article] [PubMed] [Google Scholar]
- 14.Abbasifar R, Griffiths MW, Sabour PM, Ackermann HW, Vandersteegen K, Lavigne R, Noben JP, Alanis Villa A, Abbasifar A, Nash JH, Kropinski AM. 2014. Supersize me: Cronobacter sakazakii phage GAP32. Virology 460–461:138–146. doi: 10.1016/j.virol.2014.05.003. [DOI] [PubMed] [Google Scholar]
- 15.Kim MS, Hong SS, Park K, Myung H. 2013. Genomic analysis of bacteriophage PBECO4 infecting Escherichia coli O157:H7. Arch Virol 158:2399–2403. doi: 10.1007/s00705-013-1718-3. [DOI] [PubMed] [Google Scholar]
- 16.Šimoliūnas E, Kaliniene L, Truncaite L, Klausa V, Zajančkauskaite A, Meškys R. 2012. Genome of Klebsiella sp.-infecting bacteriophage vB_KleM_RaK2. J Virol 86:5406. doi: 10.1128/JVI.00347-12. [DOI] [PMC free article] [PubMed] [Google Scholar]
- 17.Pan YJ, Lin TL, Lin YT, Su PA, Chen CT, Hsieh PF, Hsu CR, Chen CC, Hsieh YC, Wang JT. 2015. Identification of capsular types in carbapenem-resistant Klebsiella pneumoniae strains by wzc sequencing and implications for capsule depolymerase treatment. Antimicrob Agents Chemother 59:1038–1047. doi: 10.1128/AAC.03560-14. [DOI] [PMC free article] [PubMed] [Google Scholar]
- 18.Sharp PM. 1986. Molecular evolution of bacteriophages: evidence of selection against the recognition sites of host restriction enzymes. Mol Biol Evol 3:75–83. doi: 10.1093/oxfordjournals.molbev.a040377. [DOI] [PubMed] [Google Scholar]
- 19.Antwerpen MH, Georgi E, Zoeller L, Woelfel R, Stoecker K, Scheid P. 2015. Whole-genome sequencing of a pandoravirus isolated from keratitis-inducing Acanthamoeba. Genome Announc 3:e00136-15. doi: 10.1128/genomeA.00136-15. [DOI] [PMC free article] [PubMed] [Google Scholar]
- 20.Flusberg BA, Webster DR, Lee JH, Travers KJ, Olivares EC, Clark TA, Korlach J, Turner SW. 2010. Direct detection of DNA methylation during single-molecule, real-time sequencing. Nat Methods 7:461–465. doi: 10.1038/nmeth.1459. [DOI] [PMC free article] [PubMed] [Google Scholar]
- 21.Agarkova IV, Dunigan DD, Van Etten JL. 2006. Virion-associated restriction endonucleases of chloroviruses. J Virol 80:8114–8123. doi: 10.1128/JVI.00486-06. [DOI] [PMC free article] [PubMed] [Google Scholar]
- 22.Odaert B, Saïda F, Aliprandi P, Durand S, Créchet JB, Guerois R, Laalami S, Uzan M, Bontems F. 2007. Structural and functional studies of RegB, a new member of a family of sequence-specific ribonucleases involved in mRNA inactivation on the ribosome. J Biol Chem 282:2019–2028. doi: 10.1074/jbc.M608271200. [DOI] [PubMed] [Google Scholar]
- 23.Priet S, Lartigue A, Debart F, Claverie JM, Abergel C. 2015. mRNA maturation in giant viruses: variation on a theme. Nucleic Acids Res 43:3776–3788. doi: 10.1093/nar/gkv224. [DOI] [PMC free article] [PubMed] [Google Scholar]
- 24.Dumas JP, Ninio J. 1982. Efficient algorithms for folding and comparing nucleic acid sequences. Nucleic Acids Res 10:197–206. doi: 10.1093/nar/10.1.197. [DOI] [PMC free article] [PubMed] [Google Scholar]
- 25.Claverie JM, Bougueleret L. 1986. Heuristic informational analysis of sequences. Nucleic Acids Res 14:179–196. doi: 10.1093/nar/14.1.179. [DOI] [PMC free article] [PubMed] [Google Scholar]
- 26.Brendel V, Beckmann JS, Trifonov EN. 1986. Linguistics of nucleotide sequences: morphology and comparison of vocabularies. J Biomol Struct Dyn 4:11–21. doi: 10.1080/07391102.1986.10507643. [DOI] [PubMed] [Google Scholar]
- 27.Altschul SF, Gish W, Miller W, Myers EW, Lipman DJ. 1990. Basic local alignment search tool. J Mol Biol 215:403–410. doi: 10.1016/S0022-2836(05)80360-2. [DOI] [PubMed] [Google Scholar]
- 28.Kent WJ. 2002. BLAT—the BLAST-like alignment tool. Genome Res 12:656–664. doi: 10.1101/gr.229202. [DOI] [PMC free article] [PubMed] [Google Scholar]
- 29.Luo R, Liu B, Xie Y, Li Z, Huang W, Yuan J, He G, Chen Y, Pan Q, Liu Y, Tang J, Wu G, Zhang H, Shi Y, Liu Y, Yu C, Wang B, Lu Y, Han C, Cheung DW, Yiu SM, Peng S, Xiaoqian Z, Liu G, Liao X, Li Y, Yang H, Wang J, Lam TW, Wang J. 2012. SOAPdenovo2: an empirically improved memory-efficient short-read de novo assembler. Gigascience 1:18. doi: 10.1186/2047-217X-1-18. [DOI] [PMC free article] [PubMed] [Google Scholar]
- 30.Chan CK, Hsu AL, Halgamuge SK, Tang SL. 2008. Binning sequences using very sparse labels within a metagenome. BMC Bioinformatics 9:215. doi: 10.1186/1471-2105-9-215. [DOI] [PMC free article] [PubMed] [Google Scholar]
- 31.Teeling H, Meyerdierks A, Bauer M, Amann R, Glöckner FO. 2004. Application of tetranucleotide frequencies for the assignment of genomic fragments. Environ Microbiol 6:938–947. doi: 10.1111/j.1462-2920.2004.00624.x. [DOI] [PubMed] [Google Scholar]
- 32.Karlin S, Mrázek J, Campbell AM. 1997. Compositional biases of bacterial genomes and evolutionary implications. J Bacteriol 179:3899–3913. doi: 10.1128/jb.179.12.3899-3913.1997. [DOI] [PMC free article] [PubMed] [Google Scholar]
- 33.Bohlin J, Pettersson JH. 2019. Evolution of genomic base composition: from single cell microbes to multicellular animals. Comput Struct Biotechnol J 17:362–370. doi: 10.1016/j.csbj.2019.03.001. [DOI] [PMC free article] [PubMed] [Google Scholar]
- 34.Ishino Y, Krupovic M, Forterre P. 2018. History of CRISPR-Cas from encounter with a mysterious repeated sequence to genome editing technology. J Bacteriol 200:e00580-17. doi: 10.1128/JB.00580-17. [DOI] [PMC free article] [PubMed] [Google Scholar]
- 35.Krumsiek J, Arnold R, Rattei T. 2007. Gepard: a rapid and sensitive tool for creating dotplots on genome scale. Bioinformatics 23:1026–1028. doi: 10.1093/bioinformatics/btm039. [DOI] [PubMed] [Google Scholar]