

Abstract
While the role of TOR kinase in the chloroplast biogenesis and transcriptional regulation of photosynthesis is well documented in Arabidopsis, the functional relevance of this metabolic sensor kinase in chloroplast–mitochondria cross talk is unknown. Using Chlamydomonas reinhardtii as the model system, we demonstrate the role of TOR kinase in the regulation of chloroplast and mitochondrial functions: We show that TOR kinase inhibition impairs the maintenance of high ETR associated with PSII and low NPQ and inhibits efficient state transitions between PSII and PSI. While compromised photosynthetic functions are observed in TOR kinase inhibited cells, same conditions lead to augmentation in mitochondrial basal respiration rate by twofold and concomitantly a rise in ATP production. Interestingly, such upregulated mitochondrial functions in TOR‐inhibited cells are mediated by fragmented mitochondria via upregulating COXIIb and downregulating Hxk1 and AOX1 protein levels. We propose that TOR kinase may act as a sensor that counter‐regulates chloroplast versus mitochondrial functions in a normal C. reinhardtii cell.
Keywords: alternative oxidase, autophagy, cytochrome oxidase, lipid accumulation, mitochondrial respiration, photosynthesis, TOR kinase
1. INTRODUCTION
TOR (target of rapamycin) kinase is a central regulator of growth and metabolism and is involved in maintaining cellular homeostasis by sensing the nutrient and energy status of the cell (Dobrenel, Caldana, et al., 2016; Gonzalez & Hall, 2017; Loewith & Hall, 2011; Sabatini, 2017). The major difference between mammalian TOR kinase to that of plant/algal TOR is that the former exists in two distinct complexes, TORC1 and TORC2 while the latter as a single complex (TORC1). The core component of TORC1 constitutes mTOR, RAPTOR (regulatory associated protein of mTOR), and mLST8 (small lethal with sec13) while the TORC2 complex constitutes RICTOR instead of RAPTOR (Saxton & Sabatini, 2017). In most land plants, chlorophytes and rhodophytes, no RICTOR ortholog has been found suggesting that only TORC1 is conserved (Shi, Wu, & Sheen, 2018; Tatebe & Shiozaki, 2017; Wu et al., 2019). Moreover, mammalian TORC1 can directly sense nutrients such as amino acids via the activation of RAG GTPases that recruit TOR kinase to the lysosomal membrane, whereas Arabidopsis and green algae lack these RAG like GTPases and other amino acid sensors (van Dam, Zwartkruis, Bos, & Snel, 2011; Gonzalez & Hall, 2017; Kim, Goraksha‐Hicks, Li, Neufeld, & Guan, 2008; Shi et al., 2018; Xiong & Sheen, 2014). Interestingly, other nutrients such as nitrogen (N), phosphate (Pi), and sulfur (S) that play an important role in plant growth and development also act via the TOR kinase pathway, thus indicating unique plant‐associated sensing components that could directly or indirectly activate TOR kinase in many plant species including rice and Arabidopsis (Bakshi, Moin, Datla, & Kirti, 2017; Bakshi, Moin, Madhav, & Kirti, 2019; Couso et al., 2016; Dong et al., 2017; Mubeen, Jüppner, Alpers, Hincha, & Giavalisco, 2018; Shi et al., 2018; Speiser et al., 2018; Wu et al., 2019; Xiong & Sheen, 2015). These studies suggest that plants may have evolved unique components to regulate growth and metabolism and the detailed characterization of the same in plants is still under progress.
The disruption of TOR kinase function in Arabidopsis by TOR knockout and insertions at various positions within the TORC1 gene are embryonic lethal (Menand et al., 2002; Ren et al., 2011). Therefore, ethanol inducible TOR‐RNAi and amiRNA‐TOR Arabidopsis were used to decipher plant TOR kinase functions such as those related to growth and development from embryogenesis to senescence (Caldana et al., 2013; Quilichini et al., 2019; Xiong et al., 2013). Additionally, TOR inhibition by rapamycin and other active site inhibitors of TOR kinase (asTORis) became central to the study of TOR kinase functions (Dong et al., 2015; Montané & Menand, 2019). Numerous studies employing TOR kinase inhibitors (rapamycin and AZD8055) have shown leaf chlorosis and yellowing in Arabidopsis (Ren et al., 2011; Xiong et al., 2017) suggesting chloroplast damage during TOR kinase inhibition. Recent reports involving TOR inhibitor treatment have indicated that these effects could be due to transcriptional downregulation of genes encoding plastidic ribosomal proteins and photosynthetic proteins as well as those of the tetrapyrrole biosynthesis pathway in Arabidopsis (Dobrenel, Mancera‐Martínez, et al., 2016; Dong et al., 2015). Thus, the TORC1 complex has been shown to play a crucial role in biogenesis and maturation of chloroplast to promote leaf and cotyledon greening (Li, Gao, Xue, Wang, & Zhao, 2015; Li, Song, et al., 2015; Mohammed et al., 2018; Sun et al., 2016; Zhang et al., 2018). Moreover, reports have also indicated that TOR kinase plays an important role in phytohormone signaling including that of auxin, gibberellic acid, brassinosteroids, and cytokinins etc (Li & Sheen, 2016; Quilichini et al., 2019; Wang et al., 2018; Wu et al., 2019; Xiong et al., 2013; Zhang et al., 2016).
In mammalian cells, TOR kinase impacts the mitochondrial oxygen consumption and oxidative capacity (Morita et al., 2013; Schieke et al., 2006). It is also shown that the mTORC2 complex directly interacts with mitochondrial outer membrane proteins to improve the substrate permeability in mammalian cells (Ramanathan & Schreiber, 2009). In contrast, TOR kinase impacts the plant mitochondria differently where the levels of TCA cycle intermediates such as that of citrate, malate, succinate, and fumarate rise significantly higher in Arabidopsis TOR mutant plants (Caldana et al., 2013; Ren et al., 2012). These studies suggest that mitochondria are regulated by TOR kinase very differently in plants compared to that in animal cells.
As discussed above, the role of TOR kinase has also been extensively studied using two inhibitors rapamycin and AZD8055 in the unicellular eukaryotic algae, Chlamydomonas reinhardtii. As expected, TOR kinase plays a central role in growth, metabolism, ER stress, autophagy, carbon/nitrogen balance, and lipid accumulation in C. reinhardtii (Juppner et al., 2018; Mubeen et al., 2018; Perez‐Perez, Couso, & Crespo, 2017). The role of TOR kinase in cellular phosphate metabolism was also uncovered in TOR hypersensitive mutants revealing lower levels of InsP6 and InsP7 (inositol phosphates) (Couso et al., 2016). Counterintuitively, one of the recent studies concludes that TOR kinase inhibition positively regulates nitrogen assimilation leading to increased ammonium uptake and amino acid biosynthesis (Mubeen et al., 2018). Interestingly, a recent study in C. reinhardtii based on proteomics analysis suggested an overall reduction in the proteome of mitochondrial TCA cycle following TOR kinase inhibition (Roustan & Weckwerth, 2018). All these results underscore various aspects of TOR kinase function in plant mitochondrial function, but the role of TOR kinase in photosynthesis and in the regulation of photosynthetic electron transport chain has hardly been probed.
Both chloroplasts and mitochondria contribute to energy metabolism in the photosynthetic organisms, and hence, inter‐organellar communication between them appears indispensible. Studies have shown the contribution of mitochondrial electron transport chain to photosynthesis, as the absence of active proton pumping sites in the mitochondria, that is, mitochondrial mutants defective in complex I, III, and IV, leads to a preferential excitation of photosystem I (PSI) and a shift to state 2 in C. reinhardtii chloroplast (Cardol et al., 2003 ). These mitochondrial mutants therefore show an increase in the cyclic electron flow, thus favoring ATP synthesis over NADP+ reduction. Moreover, double mutants of state transition and mitochondrial respiration in C. reinhardtii have further shown that the state transitions provide the energy when ATP cannot be supplied via respiration and that this enhanced PSI activity, by transition to state 2, is required for high photosynthetic activity (Cardol et al., 2009).
Taken together, all these studies highlight the void in our current understanding of how chloroplast and mitochondrial functions regulate as well as in turn get regulated by TOR kinase. In this study, we try to address this problem by using pharmacological inhibition of TOR kinase by AZD8055 in the unicellular eukaryotic algae C. reinhardtii. Here, we preferred pharmacological inhibition to genetic perturbation approach so that we could capture time‐series effects of TOR kinase inhibition in the cells. We show that TOR kinase inhibition impairs the maintenance of low non‐photochemical quenching (NPQ) and high electron transport rate (ETR II) in C. reinhardtii chloroplast. Moreover, we also show that TOR kinase inhibition impairs the relative efficiency of PSI/PSII and the resultant level of state transitions while increasing the phosphorylation status of D1 in the D1 repair cycle. While photosynthesis is inhibited upon TOR kinase inhibition, there is also an increase in mitochondrial basal respiration. This further leads to high ATP generation, which is important for autophagy and lipid accumulation. Thus, our current study highlights the potential role of TOR kinase in the homeostatic balance of the chloroplast and mitochondrial activity in C. reinhardtii cells.
2. RESULTS
2.1. TOR kinase inhibition results in high Non‐Photochemical Quenching (NPQ) and low Photosynthetic Electron Transport Rate (ETR) in C. reinhardtii cells
To gain insight on the effect of TOR kinase inhibition at the cellular level, we carried out a detailed microscopic study of C. reinhardtii cells treated with AZD8055 for 2, 4, 8, and 12 hr of treatment. As has been reported earlier for TOR kinase inhibition by rapamycin and AZD8055 (Imamura et al., 2016; Pérez‐Pérez & Crespo, 2010), we also observed a gradual increase in the size of cells upon AZD treatment for 2, 4, 8, and 12 hr. Lipid accumulation also increased upon 12 hr of AZD treatment (Figure 1a) as previously reported (Imamura et al., 2016). Interestingly, the cup‐shaped structure of the chloroplast is essentially lost by 12 hr AZD and rapamycin treatment (Figure 1a; Figure S1a,b). Both inhibitors affected the chloroplast morphology showing gradual increase in the cup size, along with cell size increase (Figure S1a,b). Western blot analysis revealed that ATG8 levels gradually increased during 4, 8, and 12 hr of TOR inhibition, thereby serving as a measure of TOR kinase inhibition and acting as a trigger for autophagy induction. Our results indicated that treatment of C. reinhardtii cells with TOR kinase inhibitor had a strong impact on chloroplast morphology and resulted in induction of cellular autophagy. Based on these observations, we next analyzed whether inhibition of TOR kinase by AZD has any effect on photosynthetic activity, per se.
Figure 1.
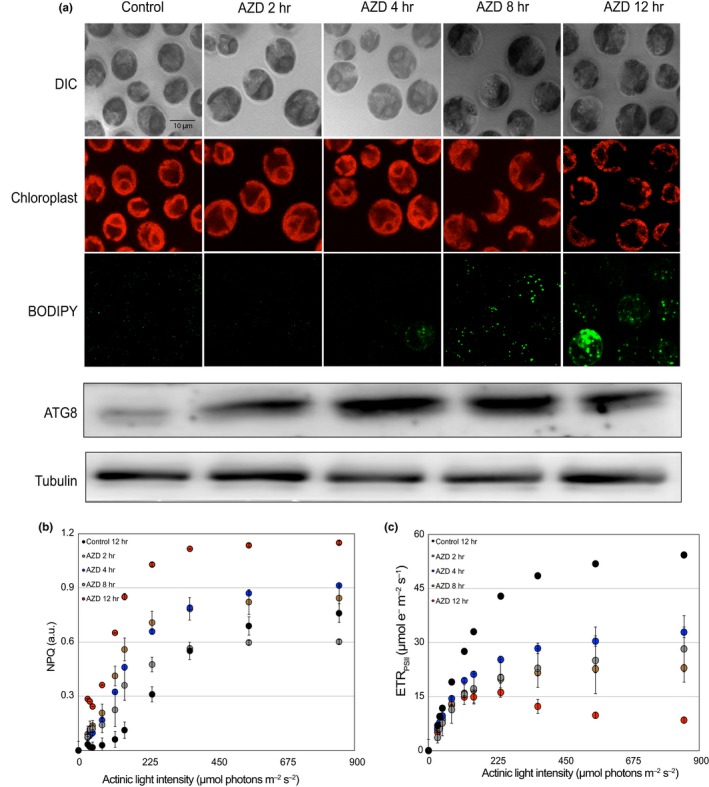
Effect of TOR kinase inhibition by AZD8055 on cellular morphology, NPQ and ETR (II). Chlamydomonas reinhardtii cells from log‐phase culture (photoautotrophic) in continuous light were treated with AZD8055 (1 µM) and collected after 2, 4, 8, and 12 hr. In parallel, untreated cells were transferred to fresh TP media and collected after 12 hr in continuous light and used as a control. (a) Top panel: Cells from different time points of treatments were stained with BODIPY and imaged using Zeiss Confocal 510 microscope. Lipid bodies were visualized following BODIPY staining and imaged for fluorescence at 488 nm. Chloroplast morphology was imaged by auto‐fluorescence at 600 nm while DIC imaging revealed the shape of the cell. Bottom panel: Cell lysates (30 µg each of total protein) from different time points were resolved on 15% SDS‐PAGE followed by immunoblotting with ATG8 antibodies (1:2,000 dilution). (b) Light response curves of untreated (black circles) or AZD treated (gray circles, 2 hr; blue circles, 4 hr; brown circles, 8 hr; red circles, 12 hr). Non‐photochemical quenching (NPQ) was determined as described in Methods. Error bars indicate standard deviation (SD). (c) The apparent electron transport rate (ETR (II) ‐ µmol e−1 m−2 s−1) relative to various actinic light intensities (µmol photons m−2 s−1) was also determined as described in Methods
In order to understand the photosynthesis‐related acclimation changes associated with TOR kinase inhibition in C. reinhardtii cells, we used PAM fluorimeter to probe various photosynthetic parameters (Baker, 2008). Variable fluorescence measurements were performed on photoautotrophically grown C. reinhardtii cells following 2, 4, 8, and 12 hr of TOR kinase inhibition using AZD8055. The fluorescence traces were then analyzed for calculation of electron transport rate associated with PSII (ETRPSII in μmol e−1 m−2 s–1) and non‐photochemical quenching (NPQ) as a function of light intensity. The ratio of the relative difference between maximal fluorescence at saturating light (849 µmol photons m−2 s−1) Fm followed by that at actinic light conditions Fm′ (100 µmol photons m−2 s−1) of dark acclimated cells was used to quantify NPQ exhibited in light. We determined the effect of varying light intensities on NPQ in TOR kinase inhibited cells following 2, 4, 8, and 12 hr of AZD treatment. Observed NPQ values were consistent with earlier reported values in stress conditions of high light (Bonente, Pippa, Castellano, Bassi, & Ballottari, 2012). Moreover, TOR kinase inhibition by 4 and 8 hr of AZD treatment resulted in a gradual and consistent increase in NPQ upon increasing light intensities of up to 849 µmol photons m−2 s−1 (Figure 1b). However, by 12 hr of TOR inhibition, cells showed an increase in NPQ, which was approximately twice that observed in untreated (12 hr light) control cells (Figure 1b, compare black circles with red circles). A similar increase in NPQ has also been reported earlier for high light treatment (Bonente et al., 2012). In addition, TOR‐inhibited cells exhibited adverse effects on electron transport rate (ETRPSII) parameter as well where ETRPSII showed significant drop by 4, 8, and 12 hr of TOR kinase inhibition (Figure 1c). We note that in the same experiment, control untreated cells exhibited ETRPSII values that were similar to the previously reported values (Godaux, Bailleul, Berne, & Cardol, 2015). Thus, our studies indicate that TOR inhibition causes significant loss in chloroplast function, which is also reflected by alterations in chloroplast morphology. All control (black) and AZD‐treated (maroon) time points for NPQ and ETRII at 849 µmol photons m−2 s−1 have been provided in Figure S1c,d, respectively.
2.2. TOR kinase inhibition impairs the maintenance of PSI, PSII efficiency and leads to overall high damage status of D1 protein in chloroplasts
In order to evaluate the changes in the photosynthetic machinery following TOR kinase inhibition, we spectrophotometrically measured the total concentration of chlorophyll on a per cell basis. The chlorophyll concentration (normalized to mg−1 of protein) reduced from 3.1 ± 0.5 µg/106 cells in control to 2.0 ± 0.3 µg/106 cells upon TOR kinase inhibition by 12 hr of AZD treatment (Figure 2a) consistent with the range reported earlier for control cells (Allorent et al., 2013). To further access photosynthetic function, we measured the Fv/Fm of TOR‐inhibited cells. The Fv/Fm ratio (for 106 cells) normalized to mg−1 of protein of the cells reduced from 0.6 ± 0.09 to 0.24 ± 0.03 by 12 hr of TOR kinase inhibition (Figure 2b). We note that the Fv/Fm ratio in our control matched well with the earlier reports (Allorent et al., 2013). All the above parameters indicate that TOR kinase inhibition results in a decrease in photosynthetic activity, which could be due to a decrease in the abundances of the components of the photosynthetic apparatus. To measure the relative abundance of the two photosystems (PSI and PSII), 77K fluorescence spectra were acquired. Excitation of chlorophyll at 440 nm produces emission of PSI at 715 nm and PSII at 685 nm. Incubation with DCMU in light and aeration causes a complete shift to state 1 due to oxidation of PQ caused by inhibition of electron transfer from PSII (Cardol et al., 2003). Whereas, incubation with CCCP in the dark results in shift to state 2 detected by an increase in amplitude of PSI (Allorent et al., 2013). This transition to either state 1 or state 2 can be monitored by the F715/F685 ratio. The untreated control cells grown at 80–100 µmol photons m−2 s−1 frozen at 77K showed two peaks with equal amplitudes which were acclimated to both state 1 (light + DCMU) or state 2 (CCCP in dark) in two separate treatment conditions (Figure S2a). TOR kinase inhibition revealed two effects: F715/F685 ratio dropped marginally suggesting a shift toward state 1 like condition from where no further transitions were observed in either DCMU (in light) or CCCP (in dark) treatments following 4, 8, or 12 hr of TOR kinase inhibition (Figure 2c; Figure S2b). This experiment revealed that TOR kinase inhibition led to arrest of photosystem transition from state 1 to state 2.
Figure 2.

Effect of TOR kinase inhibition on other photosynthetic parameters. (a) Chlorophyll concentration was estimated by extraction using 95% ethanol. Estimated chlorophyll concentration was normalized to the number of cells and mg−1 of protein. Average concentration from 3 samples was plotted for 0, 2, 4, 8 and 12 hr of TOR kinase inhibition and processed according to Student's t test. (b) Fv/Fm measurements were performed (see Methods) on Chlamydomonas reinhardtii cells (106/ml) in Dual PAM fluorimeter. Data were normalized using cell number and mg−1 protein from the duplicates of three independent experiments and were processed according to the Student's t test. *p < .05; **p < .01. Error bars indicate standard deviation (SD). (c) Average fluorescence emission spectral traces (77K spectra) of three independent biological repeats were plotted for all time points (0, 2, 4, 8, and 12 hr) of untreated and AZD‐treated cells: DCMU (blue) and CCCP (red) treated and untreated control cells (black points). Inset plot shows 77K spectra points for 0 hr. (d) Detection of phosphorylated LHCs in untreated control and TOR kinase inhibited (AZD treated) cells. Thylakoid membrane fraction (10 µg/lane) for various samples was run on 15%, 6 M Urea SDS‐PAGE gel and immunoblotted on nitrocellulose membrane. Western analysis using anti‐Phospho‐Ser/Thr antibody shows phosphorylated LHC associated proteins at 25 and 35 kDa. AZD samples (lanes 4–6) were compared with control cells without AZD treatment (lanes 1–3). Within these sets, DCMU treated (10 µM for 20 min in light) (lanes 2 and 5) versus CCCP treated (5 µM for 20 min in dark) (lanes 3 and 6) were compared with their untreated controls (lanes 1 and 4), respectively. (e) Cell lysates (30 µg each of total protein per lane) from different time points were resolved on either 15% SDS‐PAGE (for D1/pD1 and H3 westerns) or 10% SDS‐PAGE (for STT7 and PsaA westerns) followed by immunoblotting using respective Ab's: STT7 (1:1,000 dilution), PsaA (1:5,000 dilution), ATG8 (1:2,000), D1 (1:5,000), phospho‐D1 (1:5,000), LHCSR3 (1:1,000), and H3 (1:10,000) were used
State transitions are due to the phosphorylation (state 2) or dephosphorylation (state 1) of mobile light‐harvesting complexes (LHCs) (Wollman & Delepelaire, 1984). We therefore corroborated 77K spectra result (Figure 2c) by monitoring the phosphorylation status of LHCII complex proteins in C. reinhardtii cells, specifically the CP26 and CP29 polypeptides using standard published method where the polypeptides were detected by immunoblots using an anti‐phospho‐Thr antibody (Fleischmann et al., 1999). As these molecular weight species correspond to antenna proteins, their phosphorylation status suggested the state transition status of the cells (Cardol et al., 2003). Control and AZD‐treated cells showed minimal level of phosphorylation (lane 1 & 4 in Figure 2d) (basal level). However, expectedly, cells treated with CCCP (5 µM in dark for 20 min) showed high induction of state 2 as revealed by enhanced phosphorylation of both LHC proteins (CP26 and CP29) specifically in control cells (lane 3 in Figure 2d). But the same was not observed in TOR‐inhibited cells (lane 6 in Figure 2d). Interestingly, in the same conditions, the phosphorylation level of these proteins dropped in DCMU‐treated (10 µM for 20 min in light) cells in both control and TOR‐inhibited cells (lanes 2 & 5 in Figure 2d) suggesting that the cells were in state 1 like condition, a result consistent with our 77K spectra data (Figure 2c).
To further monitor the change in the photosynthetic machinery, we analyzed the levels of different components of the photosynthetic apparatus in TOR‐inhibited cells using western blotting. Firstly, we probed the protein markers representing NPQ status of the cells following TOR kinase inhibition, to biochemically corroborate the enhancement of NPQ observed (Figure 1b). NPQ is generally ascribed to three underlying processes: (a) qE (energy‐dependent quenching)—which requires the accumulation of LHCSR3 in C. reinhardtii and PsbS in higher plants, (b) qT (state transition‐dependent quenching) requires active state transition kinase (STT7) and involves the movement of phosphorylated LHCII from PSII to PSI (state transitions) (Erickson, Wakao, & Niyogi, 2015), and finally, (c) qI (photoinhibition) that involves the damage and repair of the core D1 protein of PSII (Nath et al., 2013). Consistent with the rise in NPQ observed earlier (Figure 1c), we detected a discernible rise in LHCSR3 protein following 8 and 12 hr treatment of TOR kinase inhibitor (Figure 2e). Quantitation of LHCSR3 reflected the rise observed in the western blot (Figure S2c). Next, we probed STT7, the key protein involved in state transitions and qT of NPQ, which showed a marginal drop in its level in comparison to untreated cells following TOR kinase inhibition (Figure 2e). The drop in the kinase level might affect state transitions as seen previously (Figure 2c,d). As a biochemical corroboration of decrease in PSI peak seen in 77K spectra (Figure 2c) and the reduction of transition to state 2 (Figure 2d) in TOR kinase inhibited cells, we probed the changes in PsaA levels using Western blotting. Consistent with the drop in PSI efficiency, observed in 77K spectra (Figure 2c), PsaA protein levels also showed a deceasing trend in TOR kinase inhibited cells (Figure 2e). Finally, for the qI component of NPQ function, we measured the phosphorylated D1 levels as a function of TOR kinase inhibition time course. Photoinhibition can be monitored by the phosphorylation status of D1 versus the bulk D1 protein (Li, Gao, et al., 2015; Li, Song, et al., 2015). In the time regime tested here, the bulk D1 level does not significantly change until 12 hr TOR kinase inhibition when the protein level tends to drop. However, the phosphorylation of D1 protein increases upon TOR inhibition by 4–8 hr, but drops significantly by 12 hr when the bulk protein level falls (Figure 2e). Quantitation of phosphoD1/D1 protein ratio reflected a gradual increase in the ratio during TOR kinase inhibition, revealing high levels D1 protein damage till 8 hr of TOR kinase inhibition beyond which the bulk D1 level itself falls (Figure S2c). We speculate that accumulation of high level of phosphoD1 reflects heavy damage to reaction centers carrying D1 protein (core PSII protein complexes), which is consistent with PSII peak amplitude reducing in 77K spectra during TOR kinase inhibition time course (Figure 2c). It is likely that heavy damage incurred by D1 during TOR kinase inhibition must have triggered molecular changes leading to deleterious effects that eventually manifest as reduced ETR (II) and Fv/Fm in the system (Figures 1c and 2b) (see Discussion).
2.3. TOR kinase inhibition leads to increase in fragmentation of mitochondria and enhanced basal mitochondrial respiration
To monitor mitochondrial activity upon inhibition of TOR kinase in C. reinhardtii, we measured the mitochondrial respiration rate using Seahorse XF Flux Analyzer that reports intracellular readout of oxygen consumption rate [OCR (pmol/min mg−1 protein)] at 25°C in the dark as a function of time. Additionally, we also measured coupled (that results in generation of ATP) and uncoupled respiration (associated with dissipation of excess proton gradient as heat) using CCCP (1 µM), a mitochondrial uncoupler, that was injected into the well after 12 min of measurement of OCR. As Seahorse XF Flux Analyzer system is generally used for OCR measurements in animal cells, we optimized cell density and CCCP concentrations for C. reinhardtii cells prior to performing OCR assays (Figure S3a,b). As expected, OCR was both cell density and CCCP concentration dependent. In order to mask the chloroplast effect on OCR, we subjected 12 hr of TOR kinase‐inhibited cells (in light) to dark incubation for 20 min while performing the Seahorse experiments. Therefore in all Seahorse assays, TOR kinase inhibition was performed in light followed by short incubation (20 min) in dark where the photosynthesis effects on OCR measurements were minimized. Moreover, all OCR measurements performed in the current analyses being relative to untreated controls, the results were rationalized in the context of TOR kinase inhibition. Seahorse measurements revealed that the OCR of TOR‐inhibited cells (100 ± 12 pmol min−1 mg−1 of protein) was twice that of untreated control cells (42 ± 6 pmol min−1 mg−1 of protein) (Figure 3A), suggesting that prolonged TOR kinase inhibition results in an increase in the basal mitochondrial respiration rate in C. reinhardtii cells. Moreover, expectedly, the addition of a mitochondrial uncoupler (CCCP) resulted in further surge of OCR. The surge was transient where the OCR reverted back to its starting value (100 pmol min−1 mg−1 protein) within about 10–15 min in TOR‐inhibited cells (Figure 3A). Such an increase in OCR indicated the additional respiratory potential of the system to generate ATP, reaching its maximum potential even after TOR kinase inhibition, pointing to the active state of mitochondria in these cells. Multiple pathways are responsible for increase in mitochondrial basal respiration such as Type II NADH dependent, AOX or UCP dependent etc (Yoshida & Noguchi, 2011). Additionally, we further monitor the ATP levels within the cells to understand the increase in basal respiration. We probed this by directly assaying for steady‐state ATP levels in the cells using the luciferase assay. The intracellular ATP level detected in 12 hr TOR kinase inhibited cells was significantly higher 120 ± 12 nmol/mg protein as compared to uninhibited control cells that have a value of 85 ± 9 nmol/mg protein. This indicated that the increase in basal respiration rate resulted in higher ATP production following TOR kinase inhibition (Figure 3B), although the mechanism of increase is still unknown. We note here that the control values observed in this experiment match the previously reported levels in C. reinhardtii cells (Cardol et al., 2009).
Figure 3.
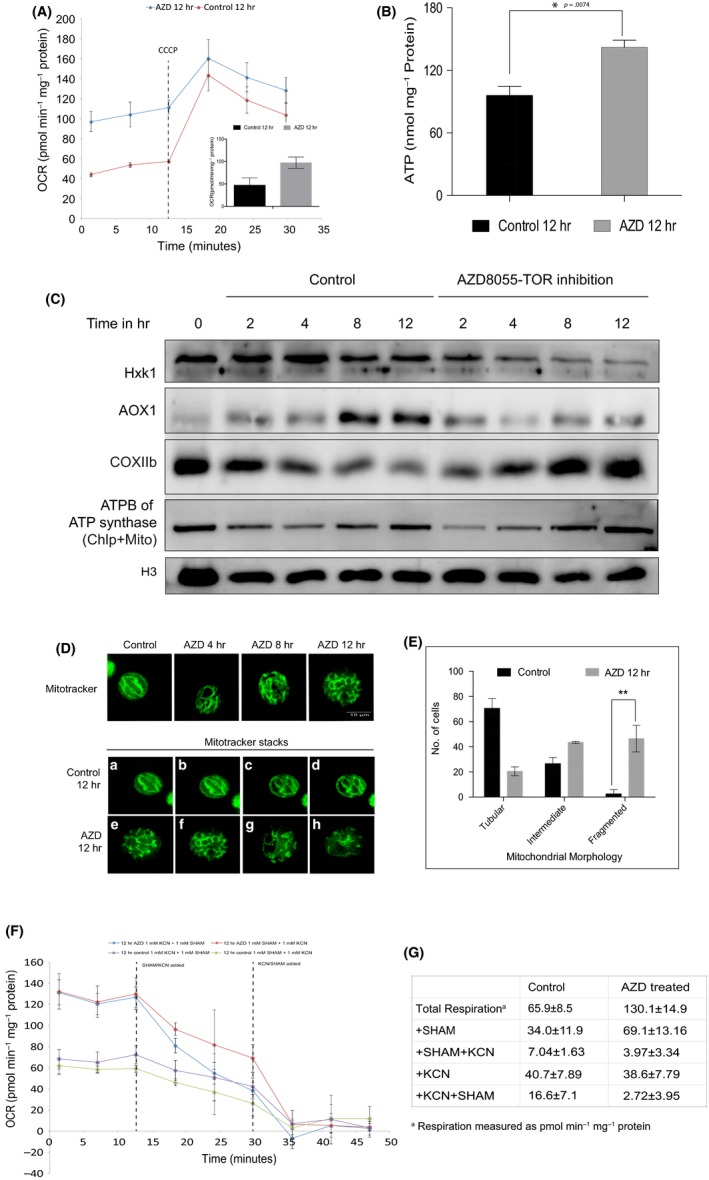
Effect of TOR kinase inhibition on mitochondrial respiration. (A) Chlamydomonas reinhardtii cells (106 cells/ml) were used in the Seahorse Flux analyzer assay for oxygen consumption rate (OCR) measurements (see Methods), performed for 3 biological repeats and plotted: 12 hr AZD treated (blue line) and untreated (red line) in dark at 25°C. The OCR values were further normalized to mg−1 of protein. Figure inset shows the OCR values of basal respiration obtained for 3 biological repeats: untreated (black bar) and treated (gray bar). Error bars indicate SD. Differences were significant according to the Student's t test. CCCP (1 µM) was injected after 12 min of basal respiration measurement. (B) Relative ATP levels shown as nmol normalized to mg−1 protein (see Methods for details) obtained for were 3 biological repeats: Untreated control (black bar) and 12 hr AZD treated (gray bar). Error bars indicate standard deviation. Differences were significant according to the Student's t test. *p < .05. (C) Cell lysates (30 µg each of total protein) from different time points were resolved on either 15% SDS‐PAGE (for COXIIb and ATPB westerns) or 10% SDS‐PAGE (for Hxk1, AOX1 and Tubulin westerns) followed by immunoblotting using respective Ab's: Hxk1 (1:1,000 dilution), AOX1 (1:1,000 dilution), COXIIb (1:1,000), ATPB Synthase (1:5,000), and Tubulin (1:10,000) were used. (D) Upper panel: representative MitoTracker fluorescence (see Methods) images of C. reinhardtii cells. Bottom panel: Z‐slices of confocal imaging for control (from a–d) and 12 hr treated (from e–h) samples. (E) Mitochondrial morphology quantitative analyses by MitoTracker imaging assay (see Methods): untreated (black bars) and 12 hr treated (gray bars) were plotted using 3 biological repeats. Error bars indicate SD. Differences were significant according to the Student's t test. (F) C. reinhardtii cells (106 cells/ml) were used in the Seahorse Flux analyzer assay for oxygen consumption rate (OCR) measurements (see Methods), performed for 6 biological repeats and plotted: untreated (green and purple) and AZD treated (blue and red). The OCR values (pmol/min/mg protein) were measured for basal respiration for 12 min and were further injected with KCN (1 mM) (blue and purple traces) or with SHAM (1 mM) (red and green traces) followed by measurement of OCR for 30 min. For double inhibitor treatment, following 30 min of KCN or SHAM treatment, cells were injected with either SHAM (blue and purple) or KCN (red and green), respectively, and the OCR traces were analyzed for a total of 45 min. (G) The values of the OCR traces discussed previously were tabulated and shown
Enhancement of the mitochondrial output following TOR kinase inhibition prompted us to probe the system biochemically and assess the accompanying protein level changes in the mitochondrial electron transport chain following TOR kinase inhibition. Interestingly, hexokinase 1 (Hxk1), the protein associated with the mitochondrial outer membranes (Robey & Hay, 2005), decreased as a function of TOR kinase inhibition whereas the same showed no change in untreated control cells (Figure 3C). The drop in the protein level nicely paralleled with TOR kinase inhibition time course, suggesting that glycolytic flux might have fallen in TOR‐inhibited cells. Interestingly, similar trend was also observed with alternative oxidase (AOX1) protein levels, a major uncoupler protein in the plant mitochondria, indicating that uncoupled respiration drops significantly as a function of TOR kinase inhibition (Figure 3C; Figure S4a). Both these trends, put together, seem to reinforce the biochemical basis of how mitochondrial respiratory efficiency got augmented leading to higher ATP production perhaps as an adaptive response to lowered photosynthetic efficiency of chloroplast in TOR‐inhibited cells (see Discussion). This interpretation was further supported, when we probed the cytochrome oxidase subunit IIb (COX IIb) levels in these cells, which is a major component of complex IV in the mitochondrial respiration chain (Figure 3C; Figure S4a). We observed a gradual and significant rise in the protein levels following TOR kinase inhibition time course, suggesting the mechanistic basis of how elevated levels of complex IV might contribute toward higher ATP production during TOR inhibition. Additionally, the levels of ATPB subunit of ATP synthase tends to fall early in the TOR kinase inhibition time course (2–3 hr), but rises above the control levels during prolonged TOR inhibition (12 hr) (Figure 3C; Figure S4a). Although this response must be a combined effect of mitochondria and chloroplast ATPB changes, we believe that the increase observed in ATPB levels at 12 hr inhibition may largely be due to the mitochondrial compartment. In conclusion, we argue that all the four mitochondrial biochemical markers probed in this experiment clearly demonstrate that TOR kinase inhibition leads to augmented mitochondrial output, thereby possibly leading to higher ATP production.
Furthermore, TOR kinase has also been implicated to regulate the fission/fusion dynamics of mitochondria via MTFP1 in mammalian cells wherein inhibition of the kinase results in hyperfused mitochondria (Morita et al., 2017) leading to strong downregulation of mitochondrial outputs in these cells (Morita et al., 2013; Schieke et al., 2006). In contrast to that observed for mammalian cells, mitochondrial outputs increase in C. reinhardtii cells following TOR kinase inhibition (Figure 3A–C) (see Discussion). Interestingly, we also observe converse effects (as compared to those on animal cells) on C. reinhardtii mitochondrial morphology following TOR kinase inhibition, where TOR kinase inhibition results in an increase in mitochondrial fragmentation, leading to severely fragmented mitochondria by 12 hr TOR kinase inhibition (Figure 3D,E). Quantitation of these morphological changes suggested that majority of TOR kinase inhibited cells (~80%) exhibited moderate to high level of fragmented mitochondria, while a relatively small fraction of cells (~20%) retained tubular morphology (Figure 3e). We validated these effects using GFP‐tagged mitochondria (MDH4‐GFP) where the GFP fluorescence imaging revealed highly fragmented mitochondria following TOR kinase inhibition (Figure S3c). We reiterate that these effects of TOR kinase inhibition on mitochondrial morphology in C. reinhardtii cells stand in stark contrast with those observed in TOR kinase inhibited mammalian cells that also show decreased ATP output (Schieke et al., 2006). We discuss the plausible basis of such converse effects mediated by TOR kinase in C. reinhardtii versus animal cells (see Discussion).
As COX and AOX protein levels varied upon TOR inhibition, we decided to monitor the functional contribution of COX and AOX on the total respiration following TOR kinase inhibition. For measurement of whole cell respiratory rates, basal respiration of cells grown at a density of 2 × 10⁶ cells/ml was measured using the Seahorse Flux Analyzer. The cytochrome pathway and the alternative oxidase pathway were inhibited by KCN (1 mM) (aqueous) and salicylic hydroxamic acid (SHAM) (1 mM in 0.5% DMSO), respectively. The concentrations of KCN and SHAM to be used for the assay were standardized using Seahorse assay as described in Figure S4b,c. The initial OCR was assayed and quantified following 12 hr of AZD treatment and in the untreated control cells (Figure 3F,G). The amount of decrease in total respiration following KCN and SHAM injection after 12 min of basal respiration was plotted and quantified (Figure 3F,G). Basal respiration increased from 65.99 ± 8.5 pmol min−1 mg–1 protein (untreated cells) to 130.1 ± 14.9 pmol min−1 mg−1 protein upon TOR inhibition (Figure 3G). Upon addition of KCN or SHAM in untreated cells the respiration dropped to 61% (40.7 ± 7.85 pmol min−1 mg−1 protein) and 52% (34.06 ± 11.9 pmol min−1 mg−1 protein) (Figure 3F,G), respectively. However the equivalent samples in AZD‐treated cells showed a drop to 30% and 50%, respectively, of the total respiration (Figure 3F,G), which clearly shows that specifically the cytochrome oxidase dependent (KCN sensitive) rather than AOX mediated respiration is affected in AZD‐treated cells as compared to untreated cells. Moreover, OCR measurement showed that the respiration rate in both untreated and AZD‐treated cells reduced severely upon SHAM/KCN combined treatment (Figure 3F,G). We note that in SHAM + KCN and KCN + SHAM treated control cells showed OCR of about 10.6% & 25% of starting value, but the same in AZD‐treated cells plummeted to 3% and 2%, respectively (Figure 3F,G). Since SHAM insensitive respiration was higher in TOR‐inhibited cells, we conclude that cytochrome oxidase respiration is perhaps more active in TOR kinase inhibited cells. In contrast, as KCN‐insensitive respiration is similar in both the conditions, we conclude that AOX respiration in TOR‐inhibited conditions is similar to that in control. This is also consistent with higher accumulation of COX rather than AOX protein following TOR kinase inhibition (Figure 3C).
2.4. Mitochondrial function is required for autophagy during TOR kinase inhibition
We concluded that the increase in mitochondrial OCR is likely to impact autophagy and lipid accumulation in the cells; processes downstream to TOR kinase. In order to test this, we analyzed the dum19 mutant, a partial loss‐of‐function frameshift mutant in mitochondrial COX1 gene that leads to inactivation of the cytochrome oxidase complex further leading to its reduced activity (Colin et al., 1995).
We compared ATG8 levels and lipid production between WT cells and dum19 following TOR kinase inhibition. Interestingly, dum19 cells failed to exhibit any measurable ATG8 induction that was clearly evident in WT cells (Figure 4a). Lack of ATG8 induction was discernible in dum19 both in TOR kinase inhibited and normal untreated cells. Additionally, lipid accumulation also was absent in the mutant cells following TOR kinase inhibition, where WT cells showed high level of lipid accumulation in the same conditions (Figure 4b). WT cells exhibited ATG8 induction and lipid accumulation only after TOR kinase inhibition, both of which were absent in the mitochondrial mutant cells, which reinforced our supposition that mitochondrial output acts upstream to autophagy induction and lipid production in these cells. Interestingly, we did not see much change in chloroplast morphology upon TOR kinase inhibition in dum19 cells in comparison to untreated cells. Also, there was only a minimal reduction in the Fv/Fm values of dum19 cells upon TOR kinase inhibition, which was not statistically significant (Figure S5). In order to verify that these effects were indeed related to the loss of mitochondrial output in dum19 mutant cells in the current experimental conditions, we ascertained OCR levels in the mutant cells and compared the same with WT as a function of TOR kinase inhibition time course. Seahorse readouts revealed that dum19 cells showed only feeble increase in OCR at prolonged inhibition of TOR kinase, if at all, as compared to high increase of OCR in WT cells during TOR kinase inhibition (Figure 4c).
Figure 4.
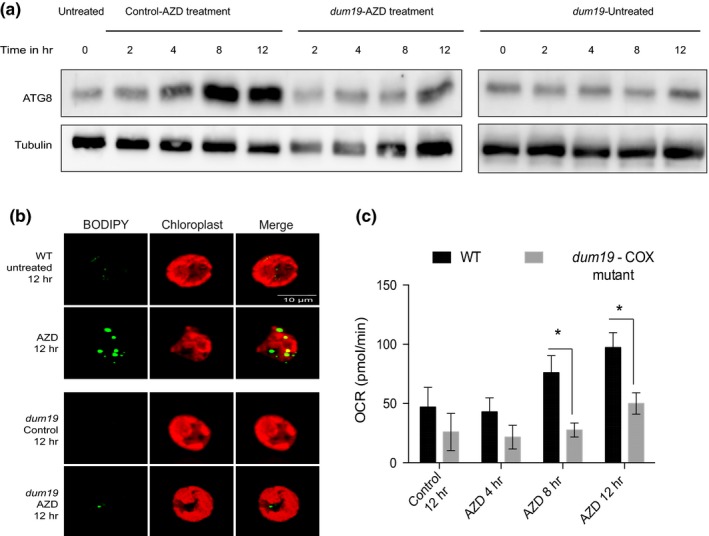
Mitochondrial function is required for autophagy during TOR kinase inhibition. (a) Cell lysates (30 µg each of total protein) from different time points were resolved on either 15% SDS‐PAGE followed by immunoblotting using ATG8 Ab (1:2,000 dilution). (b) BODIPY and chloroplast auto‐fluorescence were imaged (see Methods) using Zeiss Confocal 510 microscope. (c) OCR values of basal respiration (see Methods) obtained for 3 biological repeats were plotted. Error bars indicate SD. Differences were significant according to the Student's t test
3. DISCUSSION
TOR kinase plays a central role in sensing the nutrient and energy status of a cell and therefore regulates the major energy‐producing processes such as cellular respiration and metabolism in animal cells (Dobrenel, Caldana, et al., 2016; Morita et al., 2013). However, its role in the regulation of photosynthesis and respiration, the major energy‐generating processes in photosynthetic cells, has not been addressed so far. In order to probe the mechanistic role of TOR kinase in the co‐regulation of chloroplast and mitochondrial functions in a photosynthetic cell, we analyzed, for the first time, the consequences of TOR kinase inhibition on the physiological outputs of both these organelles in C. reinhardtii cells.
Authenticated by the TOR kinase inhibition effects revealed by autophagy induction and lipid accumulation (Figure 1a), we went ahead studying important functional readouts of photosynthesis and mitochondrial respiration, in parallel, as a function of TOR kinase inhibition. In this study, we preferred pharmacological inhibition of TOR kinase to genetic perturbation approach so that we could capture the time‐series effects of TOR kinase inhibition in the cells. We performed a battery of assays quantifying the physiological outputs of photosynthesis and respiration as a function of TOR kinase inhibition time course. We summarize and discuss below the overall take‐home of the study and demonstrate that TOR kinase inhibition in C. reinhardtii cells leads to a homeostatic response/balance where the photosynthetic output drops with a concomitant gain in the mitochondrial respiratory efficiency, a result in stark contrast with that observed in animal mitochondria following TOR kinase inhibition reported by others earlier (Morita et al., 2013, 2017). We rationalize the plant versus animal cell results vis‐à‐vis TOR kinase biology below.
Firstly, we observed that TOR kinase inhibition impairs the maintenance of high ETR and low NPQ across varying light intensities in C. reinhardtii cells (Figure 1b,c). This result is consistent with the reported role of TOR kinase regulating the transcription of photosynthetic genes, plastidial ribosomes, cotyledon greening, and chloroplast biogenesis in Arabidopsis shown earlier by several groups using the same specific inhibitors that we have employed in the current study (Dobrenel, Mancera‐Martínez, et al., 2016; Dong et al., 2015). NPQ involves the dissipation of excess energy by the photosynthetic apparatus, activated during high light acclimation, change in CO2 and stress levels via three major contributing components, namely, qE (involving pigments such as xanthophylls and other carotenoids), qT (involving state transitions), and qI (D1 core damage repair) (Erickson et al., 2015; Müller, Li, & Niyogi, 2001). Recently, it has been shown that carotenoid production is under the control of TOR kinase, thus rationalizing its role in the regulation of qE (Werth et al., 2019). Moreover, our study shows increase in the levels of LHCSR3 upon TOR kinase inhibition in comparison to untreated cells, which suggests that the qE component of NPQ is active (Figure 2e; Figure S2c). Studies have also shown that qT is the intermediate component of the quenching process that involves STT7 (state transition kinase), which redistributes the excitation energy of the reaction centers between the two photosystems (PSI and PSII) by phosphorylating and relocating LHCII subunits (Lemeille et al., 2009; Rochaix, 2013). State transitions are also significantly affected upon TOR kinase inhibition as seen in Figure 2c,d and Figure S2b. This is also supported by the western blot analyses of STT7 and PSI core protein levels, both of which were reduced in TOR kinase inhibited cells (Figure 2e). This result is consistent with a recent phospho‐proteomic study in Arabidopsis showing STT7 and a handful of light‐harvesting proteins as interactors of TOR and, hence, potential phosphorylation targets of this kinase (Van Leene et al., 2019). Moreover, we also observe that TOR kinase inhibition triggered a gradual reduction in the PsaA protein leading to its near complete loss by 12 hr of inhibition, suggesting that PSI super‐complexes are adversely affected by TOR kinase inhibition. This was further corroborated by 77K spectral analysis revealing the loss of PSI peak in those conditions. This result describes the possible role played by TOR kinase in the maintenance of PSI stability.
Another important component of NPQ is D1 damage repair that is activated upon high light or under stress conditions (Nath et al., 2013). This involves the phosphorylation of D1 protein for its transfer from grana to stroma portion of the thylakoids, followed by dephosphorylation of the same and eventual degradation of the protein. A newly synthesized, de novo D1 protein chain is then inserted into the PSII reaction center, thereby completing the repair cycle (Aro, Virgin, & Andersson, 1993; Nath et al., 2013; Theis & Schroda, 2016). Thus D1 protein turnover is a key step in the D1 repair cycle where reduced repair of the same due to ROS during high light results in photoinhibition (Malnoë, 2018; Nishiyama, Allakhverdiev, & Murata, 2006). TOR kinase inhibited cells exhibit high level of D1 damage as reflected by its heightened phosphorylation followed by repair, indicating the crucial role played by TOR kinase in conferring photoprotection and prevention of D1 damage. While there is a significant decrease in Fv/Fm by 8 hr and 12 hr of TOR kinase inhibition indicating photoinhibition, the bulk D1 levels essentially remain stable during TOR kinase inhibition (Figure 2c). While these observations suggest that TOR kinase inhibition plays a crucial role in impairing photosynthetic activity, the mechanism of action on specific target proteins of the chloroplast electron transport chain still remains to be explored which is an active area of investigation. While the exact nature of TOR kinase protein targets relevant for PSII, PSI function, and their stoichiometry remain to be discovered, we concluded the following working model that captures the current results: role of TOR kinase in the control of the functional status of both PSII and PSI (directly or indirectly) and maintenance of the relative abundances of PSI and PSII, where the inhibition of the kinase essentially phenocopies high light‐induced photoinhibition state with reduced ETR (Adams, Muller, Cohu, & Demmig‐Adams, 2013; Tian, Sacharz, Ware, Zhang, & Ruban, 2017), increase in NPQ (Bonente et al., 2012; Erickson et al., 2015; Tian et al., 2017), loss of STT7 (Lemeille et al., 2009; Trotta, Suorsa, Rantala, Lundin, & Aro, 2016) and PsaA (Sonoike, 2011) proteins. Although the rise in NPQ upon TOR kinase inhibition is not as severe as seen in high light, an accumulation of LHCSR3 protein does suggest that TOR kinase inhibition induces a stress response in C. reinhardtii cells. Central to these deleterious effects might be the excess damage associated with D1 protein during TOR inhibition, akin to high light‐induced PSII damage. We propose that TOR acts as a homeostatic regulator of PSII, PSI, and their relative abundances during photosynthesis, thereby positing itself as a potential link between photosynthesis and cellular energy metabolism.
Inter‐organellar coordination between chloroplast and mitochondria has been widely appreciated, but relatively less studied (Cardol et al., 2009, 2003; Larosa et al., 2018). Consequently, we understand much less of inter‐organellar adaptive changes in various biological contexts. In the current study, we uncovered a system where downregulation of chloroplast functions seems to be compensated by the upregulation of mitochondrial outputs following TOR kinase inhibition. The corollary to this can be exemplified in other examples where during nitrogen starvation in C. reinhardtii, breakdown of the photosynthetic apparatus was followed by a concomitant increase in the cellular respiration in dark as well as an increase in the transcription of mitochondrial genes (Juergens et al., 2015; Schmollinger et al., 2014), suggesting the plausibility of compensatory changes in mitochondrial activity. An increase in the flux of the mitochondrial TCA cycle in Arabidopsis following either pharmacological inhibition or genetic depletion of TOR kinase has already been reported (Kleessen, Irgang, Klie, Giavalisco, & Nikoloski, 2015; Ren et al., 2012). Our data reinforce the same and provide a mechanistic basis of such compensatory response by the mitochondrial compartment in C. reinhardtii cells.
Firstly, by employing a direct physiological readout using a Seahorse Flux Analyzer, for the first time on any algal cell system, we show that TOR kinase inhibited cellular mitochondria exhibit heightened OCR and consequently higher ATP production (Figure 3A,B). Interestingly, TOR‐inhibited mitochondria also exhibit the potential for higher OCR typically shown in the presence of mitochondrial uncoupler, CCCP (Figure 3A). Further analysis of candidate mitochondrial ETC components revealed an accumulation of selective mitochondrial proteins important for ATP production such as COXIIb and ATP synthase (mitochondrial/chloroplast), along with concomitant reduction in AOX1 levels following TOR kinase inhibition (Figure 3C). Such compensatory mechanisms leading to an increase in COX have been previously reported in chloroplast mutants defective in cyclic electron transport mediated by PGR5/PGRL1 (Jokel, Johnson, Peltier, Aro, & Allahverdiyeva, 2018). Interestingly, loss‐of‐function mutant pgr5/pgrl1 also exhibited a reduction in PsaA levels of PSI, which we were able to corroborate in TOR kinase inhibited cells (Figure 2c) that also showed enhanced mitochondrial COX protein levels (Figure 3C). Moreover, this increase in COX seems to be unique for TOR‐inhibited cells grown in photoautotrophic conditions involving continuous light, as other chloroplast‐mitochondrial compensatory responses reported earlier involves an increase in the AOX pathway rather than COXIIb. Moreover, when we measure the apparent capacity of AOX and COX respiratory pathways using specific inhibitors such as SHAM and KCN, respectively, the contribution of COX to the total respiratory output (i.e., KCN sensitive) seems higher in comparison to AOX in TOR‐inhibited cells (Figure 3F,G). This result mapped well in conjunction with the western blot analyses data, where an increase in COXIIb rather than AOX levels was observed following TOR kinase inhibition (Figure 3C). Thus, it is likely that the TOR inhibition that impairs photosynthesis was also responsible, in parallel, for controlling the mitochondrial respiration by negatively balancing the COX protein while positively modulating the AOX1 and Hxk1 proteins. To the best of our knowledge, this type of cross‐regulation between chloroplast and mitochondria by the TOR kinase action has not been reported so far.
The cross‐regulation between chloroplast and mitochondria facilitated by TOR kinase in C. reinhardtii cells imposes a unique paradox: While all animal cell studies have implicated TOR kinase as a robust positive regulator of mitochondria, where TOR kinase inhibition brings about a decrease in overall mitochondrial respiration and the translation of mitochondria specific proteins (Morita et al., 2013; Schieke et al., 2006), the same is “inverted” in the chlamy cells. The mechanism of TOR kinase inhibition that leads to an increase in mitochondrial outputs reveals an algae/plant specific response or signaling that has evolved out of coordinated cross talk between chloroplast and mitochondria in these cells, a feature that is completely missing in the animal world.
The mechanistic inversion of TOR kinase role in plant versus animal cells is best exemplified in mitochondrial morphology changes associated with TOR kinase inhibition. In mammalian cells, mitochondrial hyperfusion is associated with increased ATP production while mitochondrial fragmentation (fission) is associated with stress, membrane depolarization and mitochondrial dysfunction (Liesa & Shirihai, 2013; Morita et al., 2017; Westermann, 2012). In contrast, we show here that fragmented mitochondria in TOR kinase inhibited cells in C. reinhardtii is associated with the upregulation of mitochondrial functions (Figure 3A–E; Figure S2), which is consistent with the findings in plants where mitochondrial fission was dominantly associated with stress (Arimura, 2017). Such fragmentation may further provide higher respiratory activity, heightened energy supply, and ATP production in the cells.
We conclude by arguing that mitochondrial heightened activity in TOR kinase inhibited cells serves as the source of ROS that in turn triggers cellular autophagy, a result supported by mitochondrial loss‐of‐function mutant (dum19) where TOR kinase inhibition fails to impose enhanced mitochondrial OCR as well as the autophagy and associated lipid accumulation (Figure 4). We also raise a word of caution as far as the mechanistic basis of the observed results in this study is concerned. Although the effects of TOR kinase inhibition indicate that the protein may play an important role in maintaining photosynthetic and respiratory functions in chloroplast and mitochondria, respectively, we do not want to herald any guess on the direct link between TOR kinase and various biochemical steps/proteins associated with these two functions. It is likely that the effect of TOR kinase inhibition effects are indirect, where the cells are subjected to high autophagy and oxidative stress. However, in order to uncover any direct substrate targets of TOR kinase in photosynthetic or respiratory or both pathways in C. reinhardtii cells, one has to probe the system further.
4. MATERIALS AND METHODS
4.1. Strains, media, and growth conditions
Chlamydomonas reinhardtii WT CC‐125, MDH4‐GFP and dum19 strains were obtained from the C. reinhardtii Resource Center (https://www.chlamycollection.org). Chlamydomonas reinhardtii CC‐125 cells were grown under continuous illumination at the intensity of 90 μmol m−2 s−1 at 25°C in Tris phosphate (TP) (photoautotrophy) as described (Harris, Stern, & Witman, 1989). Light intensity was measured using LI‐250A light meter from LI–COR Biosciences. Optical density of the cells was measured as absorbance at 750 nm based on which the cell density was estimated as shown previously (Burgess et al., 2016). In TOR inhibition experiments, photoautotrophically grown cells (106 cells/ml) were pelleted and resuspended in fresh TP media, followed by treatment with AZD8055 (1 μM) (Axon medchem, Axon 1561).
4.2. Protein preparation and quantitation
Treated and untreated (control) CC‐125 cells were pelleted at 2 hr, 4 hr, 8 hr, and 12 hr post‐treatment. For whole cell lysates, the cells were washed with 1× PBS twice and resuspended in 1× RIPA buffer (150 mM NaCl, 1% NP40, 0.5% sodium deoxycholate, 0.1% SDS, and 50 mM Tris‐Cl pH 8.0), containing protease inhibitor cocktail (Roche) and PhosSTOP (Roche) and incubated on ice for 30 min. The lysate was sonicated for 30 s (6‐cycles) with 5 s on pulse and 2 s off pulse each with 10% amplitude. The lysate was further centrifuged at 14,000 g for 10 min at 4°C, followed by protein concentration estimation in the supernatant using BCA kit (Thermo Fischer Scientific) employing BSA (2 mg/ml) measured in Tecan Infinite M‐200 spectrophotometer.
4.3. SDS‐PAGE and immunoblotting
Proteins were separated on SDS‐PAGE and blotted by transferring on nitrocellulose membrane for 2 hr at 100 V. Blots were blocked with blocking solution (PBS 1×, 0.2% w/v Tween, 5% powder milk) for 1 hr at RT with agitation. Blot was incubated in the primary antibody solution (diluted in blocking solution) for 1 hr at RT with agitation. The antibody solution was decanted and the blot was rinsed briefly twice, and washed 3 times for 10 min each in blocking solution at RT with agitation. The blot was incubated with secondary antibody solution (anti‐rabbit IgG Peroxidase conjugated; Sigma, A9169; 1:10,000 dilution in blocking buffer) for 1 hr at RT with agitation. The blot was washed 2 times for 10 min each in blocking solution and once with PBS 1× solution for 10 min and then developed in developing buffer. Primary antibodies used: anti‐PsaA (Agrisera, AS06 172)—1:5,000, anti‐Tubulin alpha chain (Agrisera, AS10 680)—1:10,000, anti‐D1 protein of PSII (Agrisera, AS05 084)—1:5,000, anti‐D1 protein of PSII, phosphorylated (AS13 2669) 1:5,000, anti‐HXK1 (Agrisera, AS16 4083, kindly provided by Joanna Porankiewicz‐Asplund)—1:1,000, anti‐ATG8 (Agrisera, AS14 2769) —1:2,000, anti‐STT7 (Agrisera, AS15 3080)—1:1,000, anti‐GUN4 (Agrisera, AS15 3090), anti‐AOX1 (Agrisera, AS06 152)—1:1,000, anti‐COXIIb (Agrisera, AS06 151)—1:1,000, and anti‐LHCSR3 (Agrisera, AS14 2766)—1:1,000. The blots were further developed using chemiluminiscence platform (Biorad Clarity Max Western ECL blotting substrates, 1705062).
4.4. BODIPY staining of lipid bodies in C. reinhardtii
BODIPY 493/503 (4,4‐difluoro‐1, 3, 5, 7, 8‐pentamethyl‐4‐bora‐3a, 4a‐diaza‐s‐indacene), a lipophilic fluorescent dye (Life technologies), was used for detecting lipid bodies in C. reinhardtii as previously described by (Work et al., 2010). 1 × 10⁶ cells in a total volume of 100 µl were suspended in a final concentration of 5 µg/ml BODIPY using a stock concentration of 10 mg/ml BODIPY dissolved in dimethyl‐sulfoxide (DMSO). The cells were incubated in dark for 10 min and washed thrice in TP medium. Images were acquired using Zeiss 510 Laser Scanning Confocal Microscope. BODIPY dye was detected with a 493 nm excitation and 503 nm emission wavelengths using a 515/30 band‐pass filter.
4.5. Pulse amplitude modulated (PAM) fluorimetry
Chlamydomonas reinhardtii cells (1 × 10⁶/ml) treated with AZD8055 for 2 hr, 4 hr, 8 hr, and 12 hr and untreated (control) cells were used for PAM measurement. Fluorescence‐based photosynthetic parameters were measured with Dual PAM‐100 measuring system (Walz) (Klughammer & Schreiber, 2008). Following dark acclimation of cells for 20 min, light curves were recorded at different light intensities. First, Fv/Fm was measured which defines the maximal PSII yield and indicates the sample limits. ETR (II) was measured at varying actinic light intensities (0–849 µmol photons m−2 s−1 for 600 s) (https://www.walz.com/downloads/manuals/dual-pam-100/Dual-PAM_1e.pdf). Electron transport rate (ETR) was calculated at different light intensities as ETR (II) = Quantum Yield (Y(II)) × PAR × ETR factor, where the ETR factor of 0.5 is assumed. NPQ (non‐photochemical quenching) is also measured at different light intensities and calculated as NPQ = (Fm/Fm′) − 1 (Manual).
4.6. 77K spectra
Fluorescence emission spectra at 77K were recorded using a Jobin Yvon spectrofluorometer. A special quartz flask (VWR International) was used to measure fluorescence at very low temperatures (liquid nitrogen temperature) for which cells were frozen at liquid nitrogen. Furthermore, gaseous nitrogen was used to prevent any condensation on the flask while fluorescence measurement is in progress. The excitation wavelength was 440 nm and the excitation and emission slits were 5 nm each. Both AZD‐treated and untreated cells (3 × 10⁶) were pelleted, the pellets were then resuspended in 500 µl of 20% glycerol + TP media as described previously, and the cells were immediately frozen in liquid nitrogen for fluorescence measurement (Cardol et al., 2003; Snellenburg, Wlodarczyk, Dekker, Grondelle, & Stokkum, 2017). The readings were further normalized to mg−1 of protein. To shift cells to state 1, 2 ml of 106 cells/ml culture was taken and loaded onto a multi‐well plate and subjected to continuous shaking using a glass bead and DCMU (10 µM) was added in each well. Cells were incubated in the presence of light in DCMU for a period of 20 min following which the cells were pelleted and 77K spectra was taken (Allorent et al., 2013). Similarly, to shift the cells to state 2, cells were incubated in CCCP (5 µM) in dark for 20 min followed by pelleting them and processing for 77K spectra (Bulte, Gans, Rebeille, & Wollman, 1990). Fluorescence emission traces were obtained along with noise (Cardol et al., 2003), and the final spectral traces were plotted after subtracting the noise using Prism 6.
4.7. Analysis of state transitions
Chlamydomonas reinhardtii cells were transitioned to state 1 and state 2 as previously described. Cells were pelleted and harvested in extraction buffer (25 mM HEPES‐KOH, pH 7.5; 5 mM MgCl2; 0.3 M Sucrose; 1× Protease Inhibitor Cocktail; 1× PhosSTOP) (Cardol et al., 2003). Thylakoid extraction was carried out by floatation method as shown by Cardol et al., 2003. The thylakoid fraction was extracted and protein quantified using BCA method (Pierce BCA Assay Kit; Thermo Fischer Scientific). Extracted protein (10 µg) was loaded on 15% SDS–polyacrylamide gels containing 6 M urea and electroblotted on Nitrocellulose membrane (Chua & Bennoun, 1975). The membrane was further probed with anti‐Phospho‐Ser/Thr antibody (ab17464) at a dilution of 1:1,000. The molecular weight was detected using known protein markers.
4.8. Seahorse Xf24 flux analyzer assay for mitochondrial respiration
Sample preparation for Seahorse mitochondrial flux assay involved pelleting the cells and resuspending the same in fresh media at a concentration of 1 × 10⁶ in 500 µl. Uniformly resuspended cells (AZD treated and untreated) in fresh TP media were pipetted into each well in the 24 well flux analyzer plate, followed by measurement of oxygen consumption rate (OCR), as follows (https://www.agilent.com/cs/library/usermanuals/public/XF_Cell_Mito_Stress_Test_Kit_User_Guide.pdf). At least, 1 well per assay was left as blank for blank subtraction. CCCP (Sigma, C2759‐100 mg) solution (prepared in DMSO) (56 µl of 1 µM) was pipetted in every injection port A of the Seahorse cartridge. After the injection, the drug solution was diluted by a factor of 8 in the well. Each measurement consisted of an equilibration cycle of 20 min where the cells were mixed and incubated in dark for 20 min, followed by OCR measurement in dark as per the Seahorse program (https://www.agilent.com/cs/library/usermanuals/public/S7894-10000_Rev_B_Wave_2_4_User_Guide.pdf). All respiration measurements were performed at 25°C in the dark.
Oxygen consumption measurement consisted of 1 min mix cycle (which oxygenates the micro chamber), followed by 1 min wait period (to allow the cells and the solution to settle), and finally a 3 min interval for measurement of oxygen levels. Eight of such oxygen consumption measurements were taken for the determination of basal OCR. The drug CCCP was then injected from Port A, and 14 such OCR measurements were taken. The low variability in the measurements suggested that the assay was uniform across multiple technical and biological repeats which was used to obtain reliable and reproducible data. This was essential to ascertain as we were using the flux analyzer to measure OCR for the first time in C. reinhardtii cells. This assay strategy was robust for the measurement of both basal respiration and maximal respiratory capacity of C. reinhardtii cells in the dark. Seahorse analysis and the report generation was done using the MitoStress assay report generator available on the Seahorse webpage, using which the OCR values of each well was obtained, followed by plotting with Prism 6 for further statistical analysis (https://www.agilent.com/en/products/cell-analysis/xf-cell-mito-stress-test-report-generator). Furthermore, the OCR readings were normalized to mg−1 of protein.
Similar protocol was followed for measurement of apparent capacity of AOX and COX respiratory pathways. Either SHAM (1 mM—for AOX inhibition) or KCN (1 mM—for COX inhibition) was injected via port A in untreated and AZD‐treated cells, followed by OCR measurement for 20 min. Thereafter, either KCN/SHAM were injected in Port B followed by OCR measurement for another 20 min to further access the contribution of each pathway to total respiration. OCR values were further normalized to mg−1 of protein.
4.9. ATP bioluminescence assay
An ATP‐luciferase‐based bioluminescence assay kit (Sigma, FLAAM) was used to measure ATP levels in C. reinhardtii cells. Cells (OD750 = 0.11 amounting to 106/ml cells) were collected after 12 hr of AZD treatment. A total 50 ml cells with the specified OD were pelleted down at 800 g for 10 min. The cells were further frozen in liquid nitrogen and kept in −80°C until further investigation.
Standard ATP graph was constructed using varying concentrations of ATP (10–8 to 10–12 M from a stock 10–7 M prepared in ddH2O) diluted in ATP assay dilution buffer [MgSO4 (10 mM), DTT (1 mM), EDTA (500 mM), Tris pH 7.8 (500 mM), and BSA (1%)]. ATP assay was performed using FLAAM reagent at 1:60 dilution (Luciferase + Luciferin in ATP assay dilution buffer) as per the manufacturer's protocol (https://www.sigmaaldrich.com/content/dam/sigma-aldrich/docs/Sigma/Bulletin/flaabul.pdf). FLAAM is highly light sensitive and care was taken to perform the reaction in the dark environment.
In order to get the luciferase assay results that do not deteriorate as a function of time due to ATPases in the extract, the lysis protocol employed involves preparing the cell lysates by adding 500 µl of boiling water to the cell pellet as described( https://www.sigmaaldrich.com/content/dam/sigmaaldrich/docs/Roche/Bulletin/1/11699709001bul.pdf ). It is known that this condition inactivates ATPases in the extract without hydrolyzing ATP and hence is used routinely in this assay protocols. Further, the cells were crushed and kept on ice. The lysates were further heated at 95°C for 15 min and then kept on ice, followed by pelleting the cellular debris by centrifuging the lysate at 12,000 g for 10 min. Each sample assay involved addition of 100 µl FLAAM mix (1:60 diluted in ATP assay dilution buffer) to 50 µl of clear supernatant from the cell extract and immediately measuring the luminescence readings using M1000 Tecan plate reader. ATP concentrations in the extracts were inferred using the standard graph of ATP constructed (as described above). ATP concentrations were further normalized to mg−1 of protein. The data were obtained in an excel sheet, and further analysis was done using Prism 6 software.
4.10. MitoTracker staining and mitochondrial morphology analysis
MitoTracker staining was done as previously described (Tirumani, Kokkanti, Chaudhari, Shukla, & Rao, 2014). Briefly, the cells (106/ml) were treated with MitoTracker Green FM (1:200) (Thermo Fischer, M7514) (final concentration of 1 µM) for 5 min, immobilized on a 0.8% low melting agarose slide followed by imaging the MitoTracker fluorescence (emission at 516 nm for MitoTracker and auto‐fluorescence of the chloroplast (at >600 nm) using appropriate filters) in Zeiss 510 Confocal scanning microscope. Mitochondrial morphology was classified into fragmented and tubular visually following the published protocol (Rambold, Kostelecky, Elia, & Lippincott‐Schwartz, 2011). Moreover, whenever very few branched structures were observed, such mitochondria were categorized as intermediate. Each cell is counted for its mitochondrial (dominant) phenotype and the number of cells (out of a total of 100) marking various phenotypes (tubular, intermediate or fragmented) are plotted in untreated (control samples) and AZD‐treated samples and the plots were processed using Prism 6 software.
4.11. Statistical analysis
All statistical analyses include arithmetic mean and standard deviation, and wherever applicable parametric two‐tailed Student's t test was performed in all cases.
CONFLICT OF INTEREST
The authors declare no conflict of interest associated with the work described in this manuscript.
AUTHOR CONTRIBUTIONS
S.U. and B.J.R. conceived and planned the research. S.U. performed the experiments. S.U. and B.J.R. wrote the Manuscript.
Supporting information
ACKNOWLEDGMENTS
We thank Joanna Porankiewicz‐Asplund for providing us with Hxk1 antibody. We thank Prof. Ranjan Das, DCS, TIFR for help with the 77K spectra and BARC‐facility for providing the PAM fluorometer. We acknowledge JC Bose fellowship grant (DST) [10X‐217 to B.J. Rao], Department of Atomic Energy (Government of India) grant from Tata Institute of Fundamental Research (TIFR), Mumbai [12P0123], and MHRD intramural funding to IISER‐Tirupati to B.J. Rao.
Upadhyaya S, Rao BJ. Reciprocal regulation of photosynthesis and mitochondrial respiration by TOR kinase in Chlamydomonas reinhardtii . Plant Direct. 2019;3:1–17. 10.1002/pld3.184
Funding information
This work is supported by JC Bose fellowship grant (DST) [10X‐217 to B.J. Rao], Department of Atomic Energy (Government of India) grant from Tata Institute of Fundamental Research (TIFR), Mumbai [12P0123], and MHRD intramural funding to IISER‐Tirupati to B.J. Rao.
REFERENCES
- Adams, W. W. , Muller, O. , Cohu, C. M. , & Demmig‐Adams, B. (2013). May photoinhibition be a consequence, rather than a cause, of limited plant productivity? Photosynthesis Research, 117(1–3), 31–44. 10.1007/s11120-013-9849-7 [DOI] [PubMed] [Google Scholar]
- Allorent, G. , Tokutsu, R. , Roach, T. , Peers, G. , Cardol, P. , Girard‐Bascou, J. , … Breyton, C. (2013). A dual strategy to cope with high light in Chlamydomonas reinhardtii . The Plant Cell, 25(2), 545–557. [DOI] [PMC free article] [PubMed] [Google Scholar]
- Arimura, S.‐I. (2017). Fission and fusion of plant mitochondria, and genome maintenance. Plant Physiology, 176(1), 152–161. [DOI] [PMC free article] [PubMed] [Google Scholar]
- Aro, E.‐M. , Virgin, I. , & Andersson, B. (1993). Photoinhibition of photosystem II. Inactivation, protein damage and turnover. Biochimica Et Biophysica Acta (BBA) ‐ Bioenergetics, 1143(2), 113–134. 10.1016/0005-2728(93)90134-2 [DOI] [PubMed] [Google Scholar]
- Baker, N. R. (2008). Chlorophyll fluorescence: A probe of photosynthesis in vivo. Annual Review of Plant Biology, 59, 89–113. 10.1146/annurev.arplant.59.032607.092759 [DOI] [PubMed] [Google Scholar]
- Bakshi, A. , Moin, M. , Datla, R. , & Kirti, P. (2017). Expression profiling of development related genes in rice plants ectopically expressing AtTOR. Plant Signaling & Behavior, 12(9), e1362519. [DOI] [PMC free article] [PubMed] [Google Scholar]
- Bakshi, A. , Moin, M. , Madhav, M. , & Kirti, P. (2019). Target of rapamycin, a master regulator of multiple signalling pathways and a potential candidate gene for crop improvement. Plant Biology, 21(2), 190–205. [DOI] [PubMed] [Google Scholar]
- Bonente, G. , Pippa, S. , Castellano, S. , Bassi, R. , & Ballottari, M. (2012). Acclimation of Chlamydomonas reinhardtii to different growth irradiances. Journal of Biological Chemistry, 287(8), 5833–5847. [DOI] [PMC free article] [PubMed] [Google Scholar]
- Bulte, L. , Gans, P. , Rebeille, F. , & Wollman, F. A. (1990). ATP control on state transitions in vivo in Chlamydomonas reinhardtii . Biochimica Et Biophysica Acta, 1020(1), 72–80. 10.1016/0005-2728(90)90095-l [DOI] [Google Scholar]
- Burgess, S. J. , Taha, H. , Yeoman, J. A. , Iamshanova, O. , Chan, K. X. , Boehm, M. , … Nixon, P. J. (2016). Identification of the elusive pyruvate reductase of Chlamydomonas reinhardtii chloroplasts. Plant and Cell Physiology, 57(1), 82–94. 10.1093/pcp/pcv167 [DOI] [PMC free article] [PubMed] [Google Scholar]
- Caldana, C. , Li, Y. , Leisse, A. , Zhang, Y. , Bartholomaeus, L. , Fernie, A. R. , … Giavalisco, P. (2013). Systemic analysis of inducible target of rapamycin mutants reveal a general metabolic switch controlling growth in Arabidopsis thaliana . The Plant Journal, 73(6), 897–909. 10.1111/tpj.12080 [DOI] [PubMed] [Google Scholar]
- Cardol, P. , Alric, J. , Girard‐Bascou, J. , Franck, F. , Wollman, F.‐A. , & Finazzi, G. (2009). Impaired respiration discloses the physiological significance of state transitions in Chlamydomonas . Proceedings of the National Academy of Sciences, 106(37), 15979–15984. [DOI] [PMC free article] [PubMed] [Google Scholar]
- Cardol, P. , Gloire, G. , Havaux, M. , Remacle, C. , Matagne, R. , & Franck, F. (2003). Photosynthesis and state transitions in mitochondrial mutants of Chlamydomonas reinhardtii affected in respiration. Plant Physiology, 133(4), 2010–2020. 10.1104/pp.103.028076 [DOI] [PMC free article] [PubMed] [Google Scholar]
- Chua, N.‐H. , & Bennoun, P. (1975). Thylakoid membrane polypeptides of Chlamydomonas reinhardtii: Wild‐type and mutant strains deficient in photosystem II reaction center. Proceedings of the National Academy of Sciences, 72(6), 2175–2179. 10.1073/pnas.72.6.2175 [DOI] [PMC free article] [PubMed] [Google Scholar]
- Colin, M. , Dorthu, M. P. , Duby, F. , Remacle, C. , Dinant, M. , Wolwertz, M. R. , … Matagne, R. F. (1995). Mutations affecting the mitochondrial genes encoding the cytochrome oxidase subunit I and apocytochrome b of Chlamydomonas reinhardtii . Molecular and General Genetics MGG, 249(2), 179–184. [DOI] [PubMed] [Google Scholar]
- Couso, I. , Evans, B. S. , Li, J. , Liu, Y. U. , Ma, F. , Diamond, S. , … Umen, J. G. (2016). Synergism between inositol polyphosphates and TOR kinase signaling in nutrient sensing, growth control and lipid metabolism in Chlamydomonas . The Plant Cell, 28(9), 2026–2042. 10.1105/tpc.16.00351 [DOI] [PMC free article] [PubMed] [Google Scholar]
- Dobrenel, T. , Caldana, C. , Hanson, J. , Robaglia, C. , Vincentz, M. , Veit, B. , & Meyer, C. (2016). TOR signaling and nutrient sensing. Annual Review of Plant Biology, 67, 261–285. 10.1146/annurev-arplant-043014-114648 [DOI] [PubMed] [Google Scholar]
- Dobrenel, T. , Mancera‐Martínez, E. , Forzani, C. , Azzopardi, M. , Davanture, M. , Moreau, M. , … Meyer, C. (2016). The Arabidopsis TOR kinase specifically regulates the expression of nuclear genes coding for plastidic ribosomal proteins and the phosphorylation of the cytosolic ribosomal protein S6. Frontiers in Plant Science, 7, 1611 10.3389/fpls.2016.01611 [DOI] [PMC free article] [PubMed] [Google Scholar]
- Dong, P. , Xiong, F. , Que, Y. , Wang, K. , Yu, L. , Li, Z. , & Maozhi, R. (2015). Expression profiling and functional analysis reveals that TOR is a key player in regulating photosynthesis and phytohormone signaling pathways in Arabidopsis . Frontiers in Plant Science, 6, 677 10.3389/fpls.2015.00677 [DOI] [PMC free article] [PubMed] [Google Scholar]
- Dong, Y. , Silbermann, M. , Speiser, A. , Forieri, I. , Linster, E. , Poschet, G. , … Wirtz, M. (2017). Sulfur availability regulates plant growth via glucose‐TOR signaling. Nature Communications, 8(1), 1174 10.1038/s41467-017-01224-w [DOI] [PMC free article] [PubMed] [Google Scholar] [Retracted]
- Erickson, E. , Wakao, S. , & Niyogi, K. K. (2015). Light stress and photoprotection in Chlamydomonas reinhardtii . The Plant Journal, 82(3), 449–465. [DOI] [PubMed] [Google Scholar]
- Fleischmann, M. M. , Ravanel, S. , Delosme, R. , Olive, J. , Zito, F. , Wollman, F.‐A. , & Rochaix, J.‐D. (1999). Isolation and characterization of photoautotrophic mutants of Chlamydomonas reinhardtii deficient in state transition. Journal of Biological Chemistry, 274(43), 30987–30994. [DOI] [PubMed] [Google Scholar]
- Godaux, D. , Bailleul, B. , Berne, N. , & Cardol, P. (2015). Induction of photosynthetic carbon fixation in anoxia relies on hydrogenase activity and Proton‐Gradient Regulation‐Like1‐mediated cyclic electron flow in Chlamydomonas reinhardtii . Plant Physiology, 168(2), 648–658. [DOI] [PMC free article] [PubMed] [Google Scholar]
- Gonzalez, A. , & Hall, M. N. (2017). Nutrient sensing and TOR signaling in yeast and mammals. EMBO Journal, 36(4), 397–408. 10.15252/embj.201696010 [DOI] [PMC free article] [PubMed] [Google Scholar]
- Harris, E. , Stern, D. , & Witman, G. (1989). The Chlamydomonas sourcebook (pp. 607–608). San Diego, CA: Academic Press. [Google Scholar]
- Imamura, S. , Kawase, Y. , Kobayashi, I. , Shimojima, M. , Ohta, H. , & Tanaka, K. (2016). TOR (target of rapamycin) is a key regulator of triacylglycerol accumulation in microalgae. Plant Signaling & Behavior, 11(3), e1149285 10.1080/15592324.2016.1149285 [DOI] [PMC free article] [PubMed] [Google Scholar]
- Jokel, M. , Johnson, X. , Peltier, G. , Aro, E. M. , & Allahverdiyeva, Y. (2018). Hunting the main player enabling Chlamydomonas reinhardtii growth under fluctuating light. The Plant Journal, 94(5), 822–835. [DOI] [PubMed] [Google Scholar]
- Juergens, M. T. , Deshpande, R. R. , Lucker, B. F. , Park, J.‐J. , Wang, H. , Gargouri, M. , … Skepper, J. N. (2015). The regulation of photosynthetic structure and function during nitrogen deprivation in Chlamydomonas reinhardtii . Plant Physiology, 167(2), 558–573. [DOI] [PMC free article] [PubMed] [Google Scholar]
- Juppner, J. , Mubeen, U. , Leisse, A. , Caldana, C. , Wiszniewski, A. , Steinhauser, D. , & Giavalisco, P. (2018). The target of rapamycin kinase affects biomass accumulation and cell cycle progression by altering carbon/nitrogen balance in synchronized Chlamydomonas reinhardtii cells. The Plant Journal, 93(2), 355–376. 10.1111/tpj.13787 [DOI] [PubMed] [Google Scholar]
- Kim, E. , Goraksha‐Hicks, P. , Li, L. , Neufeld, T. P. , & Guan, K.‐L. (2008). Regulation of TORC1 by Rag GTPases in nutrient response. Nature Cell Biology, 10(8), 935 10.1038/ncb1753 [DOI] [PMC free article] [PubMed] [Google Scholar]
- Kleessen, S. , Irgang, S. , Klie, S. , Giavalisco, P. , & Nikoloski, Z. (2015). Integration of transcriptomics and metabolomics data specifies the metabolic response of Chlamydomonas to rapamycin treatment. The Plant Journal, 81(5), 822–835. 10.1111/tpj.12763 [DOI] [PubMed] [Google Scholar]
- Klughammer, C. , & Schreiber, U. (2008). Complementary PS II quantum yields calculated from simple fluorescence parameters measured by PAM fluorometry and the Saturation Pulse method. PAM Application Notes, 1(2), 201–247. [Google Scholar]
- Larosa, V. , Meneghesso, A. , La Rocca, N. , Steinbeck, J. , Hippler, M. , Szabo, I. , & Morosinotto, T. (2018). Mitochondria affects photosynthetic electron transport and photo‐sensitivity in a green alga. Plant Physiology, 176(3), 2305–2314. [DOI] [PMC free article] [PubMed] [Google Scholar]
- Lemeille, S. , Willig, A. , Depège‐Fargeix, N. , Delessert, C. , Bassi, R. , & Rochaix, J.‐D. (2009). Analysis of the chloroplast protein kinase Stt7 during state transitions. Plos Biology, 7(3), e1000045 10.1371/journal.pbio.1000045 [DOI] [PMC free article] [PubMed] [Google Scholar]
- Li, H. , Gao, M. Q. , Xue, R. L. , Wang, D. , & Zhao, H. J. (2015). Effect of hydrogen sulfide on D1 protein in wheat under drought stress. Acta Physiologiae Plantarum, 37(11), 225 10.1007/s11738-015-1975-8 [DOI] [Google Scholar]
- Li, L. , & Sheen, J. (2016). Dynamic and diverse sugar signaling. Current Opinion in Plant Biology, 33, 116–125. 10.1016/j.pbi.2016.06.018 [DOI] [PMC free article] [PubMed] [Google Scholar]
- Li, L. , Song, Y. , Wang, K. , Dong, P. , Zhang, X. , Li, F. , … Ren, M. (2015). TOR‐inhibitor insensitive‐1 (TRIN1) regulates cotyledons greening in Arabidopsis . Frontiers in Plant Science, 6, 861 10.3389/fpls.2015.00861 [DOI] [PMC free article] [PubMed] [Google Scholar]
- Liesa, M. , & Shirihai, O. S. (2013). Mitochondrial dynamics in the regulation of nutrient utilization and energy expenditure. Cell Metabolism, 17(4), 491–506. 10.1016/j.cmet.2013.03.002 [DOI] [PMC free article] [PubMed] [Google Scholar]
- Loewith, R. , & Hall, M. N. (2011). Target of rapamycin (TOR) in nutrient signaling and growth control. Genetics, 189(4), 1177–1201. 10.1534/genetics.111.133363 [DOI] [PMC free article] [PubMed] [Google Scholar]
- Malnoë, A. (2018). Photoinhibition or photoprotection of photosynthesis? Update on the (newly termed) sustained quenching component qH. Environmental and Experimental Botany, 154, 123–133. 10.1016/j.envexpbot.2018.05.005 [DOI] [Google Scholar]
- Menand, B. , Desnos, T. , Nussaume, L. , Berger, F. , Bouchez, D. , Meyer, C. , & Robaglia, C. (2002). Expression and disruption of the Arabidopsis TOR (target of rapamycin) gene. Proceedings of the National Academy of Sciences, 99(9), 6422–6427. 10.1073/pnas.092141899 [DOI] [PMC free article] [PubMed] [Google Scholar]
- Mohammed, B. , Bilooei, S. F. , Dóczi, R. , Grove, E. , Railo, S. , Palme, K. , … López‐Juez, E. (2018). Converging light, energy and hormonal signaling control meristem activity, leaf initiation, and growth. Plant Physiology, 176(2), 1365–1381. 10.1104/pp.17.01730 [DOI] [PMC free article] [PubMed] [Google Scholar]
- Montané, M.‐H. , & Menand, B. (2019). TOR inhibitors: From mammalian outcomes to pharmacogenetics in plants and algae. Journal of Experimental Botany, 70(8), 2297–2312. 10.1093/jxb/erz053 [DOI] [PubMed] [Google Scholar]
- Morita, M. , Gravel, S.‐P. , Chénard, V. , Sikström, K. , Zheng, L. , Alain, T. , … Sonenberg, N. (2013). mTORC1 controls mitochondrial activity and biogenesis through 4E‐BP‐dependent translational regulation. Cell Metabolism, 18(5), 698–711. 10.1016/j.cmet.2013.10.001 [DOI] [PubMed] [Google Scholar]
- Morita, M. , Prudent, J. , Basu, K. , Goyon, V. , Katsumura, S. , Hulea, L. , … Sonenberg, N. (2017). mTOR controls mitochondrial dynamics and cell survival via MTFP1. Molecular Cell, 67(6), 922–935.e5. 10.1016/j.molcel.2017.08.013 [DOI] [PubMed] [Google Scholar]
- Mubeen, U. , Jüppner, J. , Alpers, J. , Hincha, D. K. , & Giavalisco, P. (2018). Target of Rapamycin inhibition in Chlamydomonas reinhardtii triggers de novo amino acid synthesis by enhancing nitrogen assimilation. The Plant Cell, 30(10), 2240–2254. [DOI] [PMC free article] [PubMed] [Google Scholar]
- Müller, P. , Li, X.‐P. , & Niyogi, K. K. (2001). Non‐photochemical quenching. A response to excess light energy. Plant Physiology, 125(4), 1558–1566. [DOI] [PMC free article] [PubMed] [Google Scholar]
- Nath, K. , Jajoo, A. , Poudyal, R. S. , Timilsina, R. , Park, Y. S. , Aro, E.‐M. , … Lee, C.‐H. (2013). Towards a critical understanding of the photosystem II repair mechanism and its regulation during stress conditions. FEBS Letters, 587(21), 3372–3381. 10.1016/j.febslet.2013.09.015 [DOI] [PubMed] [Google Scholar]
- Nishiyama, Y. , Allakhverdiev, S. I. , & Murata, N. (2006). A new paradigm for the action of reactive oxygen species in the photoinhibition of photosystem II. Biochimica et Biophysica Acta (BBA)‐Bioenergetics, 1757(7), 742–749. 10.1016/j.bbabio.2006.05.013 [DOI] [PubMed] [Google Scholar]
- Perez‐Perez, M. E. , Couso, I. , & Crespo, J. L. (2017). The TOR signaling network in the model unicellular green alga Chlamydomonas reinhardtii . Biomolecules, 7(3), E54 10.3390/biom7030054 [DOI] [PMC free article] [PubMed] [Google Scholar]
- Pérez-Pérez, M. E. , & Crespo, J. L. (2010). Elucidating TOR signaling in Chlamydomonas reinhardtii In The enzymes (Vol. 28, pp. 245–261). Chicago, IL: Academic Press. [Google Scholar]
- Quilichini, T. D. , Gao, P. , Pandey, P. K. , Xiang, D. , Ren, M. , & Datla, R. (2019). A role for TOR signaling at every stage of plant life. Journal of Experimental Botany, 70(8), 2285–2296. 10.1093/jxb/erz125 [DOI] [PubMed] [Google Scholar]
- Ramanathan, A. , & Schreiber, S. L. (2009). Direct control of mitochondrial function by mTOR. Proceedings of the National Academy of Sciences, 106(52), 22229–22232. 10.1073/pnas.0912074106 [DOI] [PMC free article] [PubMed] [Google Scholar]
- Rambold, A. S. , Kostelecky, B. , Elia, N. , & Lippincott‐Schwartz, J. (2011). Tubular network formation protects mitochondria from autophagosomal degradation during nutrient starvation. Proceedings of the National Academy of Sciences, 108(25), 10190–10195. 10.1073/pnas.1107402108 [DOI] [PMC free article] [PubMed] [Google Scholar]
- Ren, M. , Qiu, S. , Venglat, P. , Xiang, D. , Feng, L. , Selvaraj, G. , & Datla, R. (2011). Target of rapamycin regulates development and ribosomal RNA expression through kinase domain in Arabidopsis . Plant Physiology, 155(3), 1367–1382. 10.1104/pp.110.169045 [DOI] [PMC free article] [PubMed] [Google Scholar]
- Ren, M. , Venglat, P. , Qiu, S. , Feng, L. , Cao, Y. , Wang, E. , … Chalivendra, S. (2012). Target of rapamycin signaling regulates metabolism, growth, and life span in Arabidopsis . The Plant Cell, 24(12), 4850–4874. [DOI] [PMC free article] [PubMed] [Google Scholar]
- Robey, R. B. , & Hay, N. (2005). Mitochondrial hexokinases: Guardians of the mitochondria. Cell Cycle, 4(5), 654–658. 10.4161/cc.4.5.1678 [DOI] [PubMed] [Google Scholar]
- Rochaix, J.‐D. (2013). Redox regulation of thylakoid protein kinases and photosynthetic gene expression. Antioxidants & Redox Signaling, 18(16), 2184–2201. 10.1089/ars.2012.5110 [DOI] [PMC free article] [PubMed] [Google Scholar]
- Roustan, V. , & Weckwerth, W. (2018). Quantitative phosphoproteomic and system‐level analysis of TOR inhibition unravel distinct organellar acclimation in Chlamydomonas reinhardtii . Frontiers in Plant Science, 9, 1590 10.3389/fpls.2018.01590 [DOI] [PMC free article] [PubMed] [Google Scholar]
- Sabatini, D. M. (2017). Twenty‐five years of mTOR: Uncovering the link from nutrients to growth. Proceedings of the National Academy of Sciences of the United States of America, 114(45), 11818–11825. 10.1073/pnas.1716173114 [DOI] [PMC free article] [PubMed] [Google Scholar]
- Saxton, R. A. , & Sabatini, D. M. (2017). mTOR signaling in growth, metabolism, and disease. Cell, 169(2), 361–371. 10.1016/j.cell.2017.03.035 [DOI] [PubMed] [Google Scholar]
- Schieke, S. M. , Phillips, D. , McCoy, J. P. , Aponte, A. M. , Shen, R. F. , Balaban, R. S. , & Finkel, T. (2006). The mammalian target of rapamycin (mTOR) pathway regulates mitochondrial oxygen consumption and oxidative capacity. Journal of Biological Chemistry, 281(37), 27643–27652. [DOI] [PubMed] [Google Scholar]
- Schmollinger, S. , Mühlhaus, T. , Boyle, N. R. , Blaby, I. K. , Casero, D. , Mettler, T. , … Strenkert, D. (2014). Nitrogen‐sparing mechanisms in Chlamydomonas affect the transcriptome, the proteome, and photosynthetic metabolism. The Plant Cell, 26(4), 1410–1435. [DOI] [PMC free article] [PubMed] [Google Scholar]
- Shi, L. , Wu, Y. , & Sheen, J. (2018). TOR signaling in plants: Conservation and innovation. Development, 145(13), dev160887 10.1242/dev.160887 [DOI] [PMC free article] [PubMed] [Google Scholar]
- Snellenburg, J. J. , Wlodarczyk, L. M. , Dekker, J. P. , van Grondelle, R. , & van Stokkum, I. H. (2017). A model for the 77 K excited state dynamics in Chlamydomonas reinhardtii in state 1 and state 2. Biochimica Et Biophysica Acta (BBA) ‐ Bioenergetics, 1858(1), 64–72. 10.1016/j.bbabio.2016.10.001 [DOI] [PubMed] [Google Scholar]
- Sonoike, K. (2011). Photoinhibition of photosystem I. Physiologia Plantarum, 142(1), 56–64. 10.1111/j.1399-3054.2010.01437.x [DOI] [PubMed] [Google Scholar]
- Speiser, A. , Silbermann, M. , Dong, Y. , Haberland, S. , Uslu, V. V. , Wang, S. , … Hell, R. (2018). Sulfur partitioning between glutathione and protein synthesis determines plant growth. Plant Physiology, 177(3), 927–937. 10.1104/pp.18.00421 [DOI] [PMC free article] [PubMed] [Google Scholar]
- Sun, L. , Yu, Y. , Hu, W. , Min, Q. , Kang, H. , Li, Y. , … Hong, Y. (2016). Ribosomal protein S6 kinase1 coordinates with TOR‐Raptor2 to regulate thylakoid membrane biosynthesis in rice. Biochimica Et Biophysica Acta, 1861(7), 639–649. 10.1016/j.bbalip.2016.04.009 [DOI] [PubMed] [Google Scholar]
- Tatebe, H. , & Shiozaki, K. (2017). Evolutionary conservation of the components in the TOR signaling pathways. Biomolecules, 7(4), 77 10.3390/biom7040077 [DOI] [PMC free article] [PubMed] [Google Scholar]
- Theis, J. , & Schroda, M. (2016). Revisiting the photosystem II repair cycle. Plant Signaling & Behavior, 11(9), e1218587 10.1080/15592324.2016.1218587 [DOI] [PMC free article] [PubMed] [Google Scholar]
- Tian, Y. , Sacharz, J. , Ware, M. A. , Zhang, H. , & Ruban, A. V. (2017). Effects of periodic photoinhibitory light exposure on physiology and productivity of Arabidopsis plants grown under low light. Journal of Experimental Botany, 68(15), 4249–4262. 10.1093/jxb/erx213 [DOI] [PMC free article] [PubMed] [Google Scholar]
- Tirumani, S. , Kokkanti, M. , Chaudhari, V. , Shukla, M. , & Rao, B. J. (2014). Regulation of CCM genes in Chlamydomonas reinhardtii during conditions of light–dark cycles in synchronous cultures. Plant Molecular Biology, 85(3), 277–286. 10.1007/s11103-014-0183-z [DOI] [PubMed] [Google Scholar]
- Trotta, A. , Suorsa, M. , Rantala, M. , Lundin, B. , & Aro, E. M. (2016). Serine and threonine residues of plant STN 7 kinase are differentially phosphorylated upon changing light conditions and specifically influence the activity and stability of the kinase. The Plant Journal, 87(5), 484–494. [DOI] [PubMed] [Google Scholar]
- van Dam, T. J. , Zwartkruis, F. J. , Bos, J. L. , & Snel, B. (2011). Evolution of the TOR pathway. Journal of Molecular Evolution, 73(3–4), 209–220. [DOI] [PMC free article] [PubMed] [Google Scholar]
- Van Leene, J. , Han, C. , Gadeyne, A. , Eeckhout, D. , Matthijs, C. , Cannoot, B. , … De Jaeger, G. (2019). Capturing the phosphorylation and protein interaction landscape of the plant TOR kinase. Nature Plants, 5(3), 316–327. 10.1038/s41477-019-0378-z [DOI] [PubMed] [Google Scholar]
- Wang, P. , Zhao, Y. , Li, Z. , Hsu, C.‐C. , Liu, X. , Fu, L. , … Zhu, J.‐K. (2018). Reciprocal regulation of the TOR kinase and ABA receptor balances plant growth and stress response. Molecular Cell, 69(1), 100–112.e6. 10.1016/j.molcel.2017.12.002 [DOI] [PMC free article] [PubMed] [Google Scholar]
- Werth, E. G. , McConnell, E. W. , Couso Lianez, I. , Perrine, Z. , Crespo, J. L. , Umen, J. G. , & Hicks, L. M. (2019). Investigating the effect of target of rapamycin kinase inhibition on the Chlamydomonas reinhardtii phosphoproteome: From known homologs to new targets. New Phytologist, 221(1), 247–260. [DOI] [PubMed] [Google Scholar]
- Westermann, B. (2012). Bioenergetic role of mitochondrial fusion and fission. Biochimica Et Biophysica Acta (BBA) ‐ Bioenergetics, 1817(10), 1833–1838. 10.1016/j.bbabio.2012.02.033 [DOI] [PubMed] [Google Scholar]
- Wollman, F.‐A. , & Delepelaire, P. (1984). Correlation between changes in light energy distribution and changes in thylakoid membrane polypeptide phosphorylation in Chlamydomonas reinhardtii . The Journal of Cell Biology, 98(1), 1–7. 10.1083/jcb.98.1.1 [DOI] [PMC free article] [PubMed] [Google Scholar]
- Work, V. H. , Radakovits, R. , Jinkerson, R. E. , Meuser, J. E. , Elliott, L. G. , Vinyard, D. J. , … Posewitz, M. C. (2010). Increased lipid accumulation in the Chlamydomonas reinhardtii sta7‐10 starchless isoamylase mutant and increased carbohydrate synthesis in complemented strains. Eukaryotic Cell, 9(8), 1251–1261. [DOI] [PMC free article] [PubMed] [Google Scholar]
- Wu, Y. , Shi, L. , Li, L. , Fu, L. , Liu, Y. , Xiong, Y. , & Sheen, J. (2019). Integration of nutrient, energy, light and hormone signalling via TOR in plants. Journal of Experimental Botany, 70(8), 2227–2238. 10.1093/jxb/erz028 [DOI] [PMC free article] [PubMed] [Google Scholar]
- Xiong, F. , Zhang, R. , Meng, Z. , Deng, K. , Que, Y. , Zhuo, F. , … Ren, M. (2017). Brassinosteriod Insensitive 2 (BIN2) acts as a downstream effector of the Target of Rapamycin (TOR) signaling pathway to regulate photoautotrophic growth in Arabidopsis . New Phytologist, 213(1), 233–249. 10.1111/nph.14118 [DOI] [PubMed] [Google Scholar]
- Xiong, Y. , McCormack, M. , Li, L. , Hall, Q. , Xiang, C. , & Sheen, J. (2013). Glucose‐TOR signalling reprograms the transcriptome and activates meristems. Nature, 496(7444), 181–186. 10.1038/nature12030 [DOI] [PMC free article] [PubMed] [Google Scholar]
- Xiong, Y. , & Sheen, J. (2014). The role of target of rapamycin signaling networks in plant growth and metabolism. Plant Physiology, 164(2), 499–512. 10.1104/pp.113.229948 [DOI] [PMC free article] [PubMed] [Google Scholar]
- Xiong, Y. , & Sheen, J. (2015). Novel links in the plant TOR kinase signaling network. Current Opinion in Plant Biology, 28, 83–91. 10.1016/j.pbi.2015.09.006 [DOI] [PMC free article] [PubMed] [Google Scholar]
- Yoshida, K. , & Noguchi, K. (2011). Interaction between chloroplasts and mitochondria: activity, function, and regulation of the mitochondrial respiratory system during photosynthesis In Plant mitochondria (pp. 383–409). New York, NY: Springer. [Google Scholar]
- Zhang, Y. I. , Zhang, Y. , McFarlane, H. E. , Obata, T. , Richter, A. S. , Lohse, M. , … Giavalisco, P. (2018). Inhibition of TOR represses nutrient consumption, which improves greening after extended periods of etiolation. Plant Physiology, 178(1), 101–117. 10.1104/pp.18.00684 [DOI] [PMC free article] [PubMed] [Google Scholar]
- Zhang, Z. , Zhu, J.‐Y. , Roh, J. , Marchive, C. , Kim, S.‐K. , Meyer, C. , … Wang, Z.‐Y. (2016). TOR signaling promotes accumulation of BZR1 to balance growth with carbon availability in Arabidopsis . Current Biology, 26(14), 1854–1860. 10.1016/j.cub.2016.05.005 [DOI] [PMC free article] [PubMed] [Google Scholar]
Associated Data
This section collects any data citations, data availability statements, or supplementary materials included in this article.
Supplementary Materials