

Abstract
The biotin–streptavidin bond is the strongest noncovalent bond in nature and is thus used extensively in biotechnology applications. However, the difficulty of releasing the bond without high temperatures or corrosive solutions can be a barrier to applications involving nucleic acids and other delicate substrates. Here, room-temperature phenol is employed to release biotin-tagged DNA constructs from streptavidin rapidly and efficiently. It is demonstrated that synthetic biotinylated DNA can be recovered at yields approaching 100% from both solution-phase and bead-bound streptavidin with as little as 12% (v/v) phenol, leaving the biotin tag active and reusable after extraction. As an application of this recovery method, biotinylated DNA fragments are isolated from a mixed solution to provide selectivity for solid-state nanopore detection.
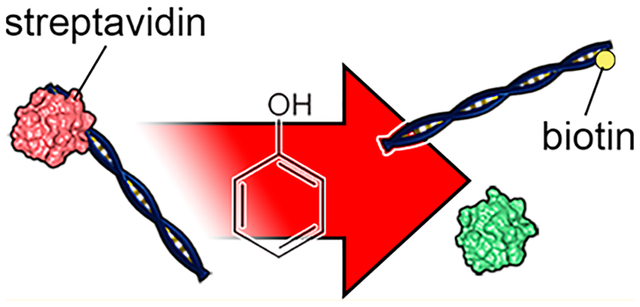
Graphical Abstract
The strong noncovalent bond (K = 10−15 M) between biotin and streptavidin allows for robust biochemical labeling in competitive chemical environments, where the biotin moiety interacts with the highly electronegative binding site of streptavidin.1 Because of this stability, biotin capture has become a foundational technique for the biochemical selection of target molecules, particularly with nucleic acids, where it can play a central role in diverse analytical approaches like single-nucleotide polymorphism detection,2 DNA sequencing,3 and epigenetic labeling.4–6 However, a major disadvantage of the bond strength is that biotinylated molecules are often difficult to recover for downstream isolation, amplification, and other processes. Existing elution methods have significant challenges. For example, modified forms7–9 of biotin and streptavidin have been developed that enable improved release kinetics or enzymatic cleavage. However, the enhanced elution is achieved by reducing binding strength, and cleavage of the biotin tag precludes the possibility of iterative use, both of which diminish the advantages of the system. biotin–streptavidin can also be disrupted chemically but with significant drawbacks. For example, ammonium hydroxide at elevated temperatures has been reported10 to yield up to 96% recovery of bound nucleic acids, but the chemical also damages the nucleic acids themselves. Alternatively, Holmberg et al.11 have reported that the biotin–streptavidin bond can be dissociated with over 95% yield in pure water at temperatures above 70 °C. Although dissociation in water is an improvement in terms of chemical bio compatibility, the practical yield can vary significantly due to the presence of buffer salts.11 In addition, high temperatures are not compatible with all constructs, particularly small nucleic acids with low melting temperatures or DNA nanostructures composed of short staple strands.12
Here, an alternative approach to disrupting the biotin–streptavidin interaction is demonstrated that is highly compatible with nucleic acids and operates at room temperature. The low-polarity solvent phenol is used to reconfigure the structure of streptavidin and release bound nucleic acids. By creating a biphasic system between a binding buffer and a phenol–chloroform mixture,13 as is done widely in conventional biomolecular preparations,14–16 synthetic biotinylated DNA constructs can be recovered from both free streptavidin and streptavidin-coated beads with reproducible yields approaching 100%. Although the process may render the streptavidin nonfunctional, the DNA-conjugated biotin tag remains intact and active for downstream uses. As an application for this release approach, the technique is incorporated into an isolation strategy to enable target selection for solid-state nanopore analysis.
EXPERIMENTAL SECTION
Short DNA Preparation.
Double-stranded (ds)-DNA oligonucleotides (150 bp) containing a single biotin modification were prepared by PCR using λ-phage DNA (New England Biolabs, Ipswich, MA) as a template. The unmodified forward primer (5′-AAC AAC TGT TTC AGC CAC TGC TTC-3′) and the biotinylated reverse primer (5′-CAG TTG AGG ATC CCC ATA ATG CG -3′, where T is a biotinylated base) were synthesized commercially (integrated DNA Technologies, Coralville, IA). The PCR product was subsequently purified using a QIAquick PCR Purification Kit (Qiagen, Valencia, CA) and eluted in deionized water (EMD Millipore, Billerica, MA). The resulting stock solution was determined to have a concentration of 0.6 μM by spectrophotometry (Nanodrop 2000c, Thermo Scientific, Waltham, MA).
Solution-Phase Conjugates.
For measurements involving free streptavidin, a mutant variant of streptavidin, MS,17 was employed consisting of a single active high-affinity biotin-binding region. The binding reaction was performed by mixing 100 nM MS with 50 nM biotinylated dsDNA in 1× PBS and incubating for at least 10 min at room temperature. The single biotin-binding site of MS ensured purely symmetric binding of one protein to one DNA.
Substrate-Bound Conjugates.
For bead capture measurements, 10 μL of streptavidin-conjugated beads (l μm diameter Dynabeads MyOne Streptavidin Cl beads, Invitrogen, Carlsbad, CA) were washed three times in 1× binding/washing buffer (5 mM Tris-HCl, pH 7.5, 0.5 mM EDTA, 1 M NaCl) before being resuspended in 10 μL of 2X binding/washing buffer. Biotinylated dsDNA (10 μL) at a concentration of 50 nM was then added to the beads and agitated for 30 min.
Preparation of Binary Biotinylated and Nonbiotinylated DNA Mixture.
λ-Phage DNA (New England Biolabs, 4.8 μg) was incubated at room temperature for 30 min with 3.3 μM dGTP (New England Biolabs), 3.3 μM biotinylated dCTP (Trilink Biotech, San Diego, CA), 6.7 μM ddATP (Trilink Biotech), and 5 units of Klenow Fragment (New England Biolabs) in 30 μL of 1× NEBuffer 2. Given the cos overhang sequences of λ-phage DNA (5′-GGG CGG CGA CCT-3′ and 5′-AGG TCG CCG CCC-3′), this results in one end of the DNA being biotinylated and the other being capped to prevent further incorporation. The product was purified by conventional phenol–chloroform extraction, and 1 μg of the labeled DNA was incubated at 37 °C for 1 h with 5 units of PspXI (New England Biolabs) in 50 μL of 1×X CutSmart Buffer to cut the DNA into fragments of approximately 33.5 and 15 kbp. The resulting product was purified again by conventional phenol–chloroform extraction. For bead capture, 500 ng of the resulting mixture was incubated with 25 μL of streptavidin beads resuspended in 2× binding/washing buffer, with the rest reserved for solid-state (SS)-nanopore measurements. Note that this is the amount required according to the bead capacity supplied by the manufacturer, which we have determined empirically to be sufficient for capturing all the material. The binding reaction was incubated at room temperature for 1 h under constant agitation. After agitation, the beads were immobilized magnetically, and the supernatant (containing nonbiotinylated DNA) was discarded. Finally, the beads were washed three times with 1× binding/washing buffer to remove any nonspecifically bound DNA and resuspended in 25 μL of deionized water. The bound material was then eluted from the beads at room temperature using 12.5% (v/v) phenol in chloroform for SS-nanopore measurements.
Dissociation by Phenol.
Phenol dilutions were prepared by adding pure chloroform (Ricca Chemical Company, Arlington, TX) to 25:24:1 phenol/chloroform/isoamyl alcohol (Acros Organics, Morris, Nj) until the desired proportion of phenol was obtained. Phenol–chloroform was added to an equal volume of sample (10 or 25 μL) in binding/washing buffer and thoroughly mixed by vortexing for 1 min. In the case of bead-bound streptavidin, beads were removed by placing the sample tube on a magnet and decanting. For both processes, the biphasic mixture was then transferred into a phase-lock tube (5Prime, QuantaBio, Beverly, MA) and centrifuged at 14 000g for 25 min. An additional sample volume of chloroform was added to the aqueous phase, and the mixture was centrifuged at the same speed for an additional 20 min. Finally, the aqueous phase containing eluted DNA was aspirated for subsequent use or analysis. All steps were performed at room temperature. Control experiments were performed with pure chloroform or deionized water instead of phenol–chloroform.
Gel Electrophoresis.
DNA constructs (150 bp, with or without MS) were run on a 2% agarose gel in 1× TBE at a voltage of 165 V for 90 min. λ-DNA and fragmented λ-DNA were run on a 1.5% agarose gel in 1× TBE at a voltage of 165 V for 8 h. Lanes were stained with GelRed (1:100 000 dilution, Phenix Research Products, Candler, NC). Images were acquired with an E-Gel imager and processed in Gel Capture software (Thermo Fisher Scientific, Waltham, MA). Relative band intensities were evaluated using ImageJ.18,19
Solid-State Nanopore Measurement.
Equivalent volumes of the fragmented DNA mixture or isolate were brought to final buffer conditions of 1.3 M NaCl and 1× PBS, reaching an estimated DNA concentration of approximately 130 pM each. The constructs were assayed by introducing 10 μL, of buffered DNA to the negative-potential reservoir of the SS-nanopore. Two nanopores of similar size (6.1 and 6.3 nm, respectively) were fabricated by helium ion milling (Orion Plus Helium ion microscope, Carl Zeiss, Peabody, MA) as described elsewhere.20 An electrical potential of 300 mV was applied to the trans-side of a flow cell housing a device to induce electrophoresis of the negatively charged DNA from the cis-side through the pore. The ionic current was acquired at 200 kHz from an Axopatch 200B patch-clamp amplifier (Molecular Devices, San Jose, CA) with a 100 kHz four-pole Bessel filter applied. Analysis was performed with an additional low-pass filter of 10 kHz applied through custom software (LabView, National Instruments, Austin, TX). The event threshold was set at 4.5 standard deviations above the RMS noise level, and only events with durations between 12.5 μs and 2.5 ms were considered.
RESULTS AND DISCUSSION
The phenol dissociation technique is first demonstrated for solution-phase nucleoprotein complexes of nucleic acids with free monovalent streptavidin (MS). MS is a variant of tetravalent wild-type streptavidin, in which only a single binding region retains its high affinity for biotin.17 The nucleic acid portion of the nucleoprotein complex is a model 150 bp ds-DNA featuring a single biotin tag. The low polarity of phenol relative to water is known to induce conformational changes in proteins21,22 that result in less polar residues on the surface and increased solubility in nonpolar solvent; nucleic acids remain soluble only in the aqueous phase.23 The organic nature of phenol creates a biphasic mixture with aqueous solutions, and so in conventional phenol extraction,13 proteins and nucleic acids are effectively partitioned into separate phases. In the case of a nucleoprotein complex, the dual nature of the construct could cause it to be sequestered to the liquid–liquid interface. However, the biotin–streptavidin interaction is critically dependent on both a sterically defined binding pocket and the highly polar residues within it,24 as is clear from the free energy surface25 of the wild-type (WT) streptavidin–biotin complex displayed26 in Figure 1a. As a consequence, the protein structural changes induced by phenol exposure should both significantly disrupt the bond and segregate the constituents.
Figure 1.

(a) Cut-away diagram of the crystal structure of WT streptavidin (Protein Database structure 1MK5) showing that its biotin-binding regions are highly hydrophobic in their active state. Scale goes from hydrophilic (red) to hydrophobic (green), (b) Liquid-phase elution. Biotinylated DNA–MS complexes (in water) are added to a combination of phenol/chloroform/isoamyl alcohol (yellow) with water (blue) and mixed. As proteins are exposed to phenol (center), they dissociate from the DNA and then segregate into the organic when the phases are allowed to separate (right), (c) Gel analysis of liquid-phase elution. In the first panel, lane 1 is the 150 bp DNA construct alone, lane 2 is the construct bound to MS, lane 3 is the recovered DNA following elution, and lane 4 is the recovered DNA bound to fresh MS. In the second panel, the left lane shows elution with pure chloroform (no phenol), and the right lane shows elution with pure water at room temperature.
Separation of the biotin–streptavidin bond is demonstrated initially by performing conventional phenol extraction (Figure 1b) using a 25:24:1 mixture of phenol/chloroform/isoamyl alcohol on a 150 bp biotinylated dsDNA–MS complex. Chloroform is an organic solvent in which phenol is soluble but is less effective in rearranging protein conformation independently; its central role in the extraction process is to increase the density of the nonpolar solution to aid phase separation. Likewise, isoamyl alcohol is an additive to prevent foaming that does not otherwise impact the protocol. An electromobility shift assay (EMSA) with the as-synthesized 150 bp construct confirms its capacity to bind MS with high affinity, yielding a clear shift to a higher molecular weight upon incubation with MS (Figure 1c, lanes 1–2). The lack of higher-order bands after complex formation (see Supplementary Figure S1) is indicative of the 1:1 binding symmetry with MS. The unshifted band remaining at the 150 bp position (typically <5% of total lane intensity) is minor and is likely due to incomplete biotin incorporation. Upon analysis of the extracted aqueous-phase material (Figure 1c, lane 3), a single band is observed at the unbound 150 bp position. The absence of a significant population remaining at higher molecular weight indicates that MS is removed from the dsDNA with high efficiency. Incubation of the recovered DNA with a fresh aliquot of MS (Figure 1c, lane 4) yields a single, high-molecular-weight band indistinguishable from the initial nucleoprotein complex, demonstrating that biotin is not modified irreversibly by the procedure, and there is no measurable effect on MS binding. A control measurement of the nucleoprotein complex treated identically as above but with 100% chloroform in the incubation (Figure 1c, lane 5) confirms that phenol is critical for separation, whereas incubation in pure water at room temperature results in only a modest release of DNA (~20%, Figure 1c, lane 6), consistent with past reports.11
The low but nonzero solubility of phenol in water can result in trace quantities remaining in the aqueous phase following extraction. Because phenol contamination can have deleterious effects on proteins in downstream processes, avoiding remnant phenol is critical. Although subsequent washing steps can be used to remove most of the residual chemical, reducing total phenol in solution may be an important preventative measure. Moreover, the toxic, corrosive, and flammable nature of phenol make limiting it in experimental protocols valuable. Therefore, the minimum phenol concentration required for efficient dissociation is determined next. Employing the same construct as above (biotinylated 150 bp dsDNA bound to MS), phenol is titrated against chloroform in the separation protocol and the recovered aqueous phase analyzed on gel (Figure 2, top). Qualitatively, there is a transition from no release of biotinylated dsDNA at 0% (v/v) phenol (Figure 1c, lane 5) to total release at 25% (v/v), as described above. Apparent 100% dissociation indicates that protein-associated DNA less than the minimum amount resolvable by our imager (see Experimental Section) is present. Through empirical measurements, this is no more than 5% of the total. By plotting the intensity ratios of shifted to nonshifted bands (Figure 2, bottom), a sigmoidal relationship is observed , from which it can be determined that DNA constructs are fully released from the complex with as little as 12% (v/v) phenol.
Figure 2.

Top: Gel analysis of 150 bp DNA–MS complex treated with a phenol titration. Bottom: DNA dissociation as determined from intensity of the DNA band relative to that of the nucleoprotein complex in each lane across three replicate experiments. Red line is a sigmoidal fit to the data, from which it is determined that complete dissociation occurs at 12% (v/v) phenol. Note that certainty in the apparent 100% dissociation data points is limited by sensitivity of the imaging system (see Experimental Section).
Because streptavidin-coated surfaces are often used for isolation of biotinylated species, the use of phenol to release biotinylated dsDNA from streptavidin-coated magnetic beads is also investigated. For quantitation, samples are incubated with sufficient beads such that all biotinylated dsDNA in solution can be captured. Following elution with phenol above the minimal concentration for dissociation (12.5% v/v in chloroform), the aqueous phase is loaded onto a gel and imaged. From band intensity analysis of the initial and recovered DNA (Figure 3, lanes 1–2), ~90% of bound material is recovered; the minor losses are attributable to nonspecific binding with the beads and plasticware (data not shown). Consistent with results using free MS, eluted biotinylated dsDNA remains active and can be bound to fresh streptavidin beads successively (Figure 3, lane 3). Because the beads themselves are capable of being isolated magnetically from the organic phase, this approach also provides the opportunity to investigate the potential for their reuse as well. Unfortunately, biotinylated dsDNA incubated with used streptavidin beads results in very poor (<3%) yield using either recovered (Figure 3, lane 4) or fresh DNA (Figure 3, lane 5). Given that the attachment of streptavidin to the beads is covalent in nature, it is unlikely that phenol-induced conformational changes could cause protein loss. These observations therefore suggest that streptavidin is altered irreversibly to some degree by the phenol, permanently adopting a nonfunctional conformation even after reintroduction into an aqueous environment. Consequently, although it would be possible in principle to extend the applications of this procedure to retrieve streptavidin and detached biotinylated proteins from the organic phase following phenol extraction,27 it is unclear whether their activity would be recovered.
Figure 3.

Gel analysis of 150 bp biotinylated DNA elution from streptavidin-conjugated magnetic beads. Lanes from left to right show: unprocessed DNA; fresh DNA bound to and eluted from fresh beads; recovered DNA bound to and eluted from fresh beads; recovered DNA bound to and eluted from used beads; and fresh DNA bound to and eluted from used beads. All elutions performed with 12.5% (v/v) phenol at room temperature.
Biotin–streptavidin linkages are used broadly in diverse single-molecule assays for anchoring nucleic acids to substrates,28–30 and SS-nanopores31,32 comprise one technique for which the interaction has been particularly beneficial in recent years.33–35 In the fundamental platform, translocations of charged molecules through a nanometer-scale pore in a thin film membrane are probed electrically through resistive pulse sensing,36 producing a signal that is critically dependent on molecular structure.37,38 However, because each translocating biomolecule typically yields a signal, a remaining challenge in the field has been the general absence of intrinsic discrimination by signal generation. Conventionally, any differentiation has been accomplished through signal analysis. However, although significantly different molecules can typically be resolved,39–41 those with size or structure similarity can be difficult to distinguish. One selective SS-nanopore assay has been demonstrated42 that can be applied to the detection and quantification of diverse molecular biomarkers like DNA base modifications43,44 and sequence motifs,45 but it is viable for short (<250 bp) DNA fragments only, and so, additional capabilities are needed.
A potential solution to this challenge is the isolation or enrichment of target molecules prior to measurement for which phenol elution can be an enabling factor. Therefore, the optimized protocol is finally used to add selectivity to SS-nanopore analysis. As a model, λ-phage DNA is digested by restriction enzyme into two fragments approximately 33.5 and 15 kbp in length, respectively, with the latter containing a single biotin moiety at its end (see Experimental Section). Figure 4a shows the isolation procedure, in which a mixture (1:l) of the two fragments is first added to streptavidin beads for capture of biotinylated fragments (l), then, the beads are held magnetically, while unbound (i.e., nonbiotinylated) fragments are washed away (2), and finally, the biotinylated fragments are eluted with phenol for collection and analysis (3). Gel analysis (Figure 4b) confirms the selective capture of the 15 kbp fragment with this method. SS-nanopore translocations of both the original mixture and the isolate are then measured. We observe no additional contamination, noise (Figure 4c), or increased tendency toward clogging of the pore with the sample eluted with phenol. It is possible that trace amounts of phenol remain in the solution, but these do not affect nanopore performance in any measurable way. The event charge deficit (ECD), or the area defined by each translocation signal,46,47 is used as a primary metric, because it gives an accurate assessment of fragment molecular weight (i.e., length). Indeed, an ECD histogram of the initial mixture of fragments (Figure 4d, top) shows a clear bimodal distribution that indicates the two distinct DNA sizes present. In contrast, the same analysis of the isolated and phenol dissociated material (Figure 4d, bottom) yields a single population that matches the position of the smaller (15 kbp) fragment from the mixture, in agreement with the prepared biotin position. This result demonstrates that biotinylated nucleic acids can be isolated selectively prior to measurement, allowing for simple discrimination by the SS-nanopore. Although the fragments investigated here are considerably different in size for clarity, the approach is equally viable for molecules very close in size or structure that could be difficult to discriminate on subtle differences in signal alone.
Figure 4.

(a) Schematic showing isolation of biotinylated DNA. A mixture of biotinylated (red) and nonbiotinylated (blue) DNA fragments are incubated with streptavidin magnetic beads (l). The beads with bound DNA are collected magnetically, and nonbiotinylated DNA is washed away (2). Biotinylated DNA is eluted with 12.5% (v/v) phenol (3). (b) Gel analysis showing: unprocessed 48.5 kbp (i) λ-phage DNA (lane l); λ-phage DNA biotinylated at one end digested with PspXI to produce fragments approximately 33.5 (ii) and 15 kbp (iii) in length (lane 2); and the fragments after isolation and phenol elution from streptavidin beads (lane 3). The red arrow indicates the biotinylated ~15 kbp fragment, (c) Normalized SS-nanopore event histograms of ECD for the initial admixture (top, n = 1158) and the product of bead isolation (bottom, n = 519). SS-nanopore diameters are 6.1 and 6.1 nm, respectively. Lower ECD corresponds to lower molecular weight (i.e., the 15 kbp biotinylated DNA). Insets show a typical conductance trace for each measurement, with initial (open pore) conductance to the left and after addition of the DNA to the right. Spikes indicate molecular translocations. Scale bars are 500 ms (horizontal) and 1 nS (vertical).
CONCLUSION
The biotin–streptavidin bond can be disrupted efficiently through incubation with phenol at room temperature. Isolation and recovery are demonstrated with biotinylated dsDNA constructs bound first to solution-phase MS and then to substrate-bound streptavidin in the form of conjugated magnetic beads. Extraction with phenol leaves incorporated biotin intact and capable of subsequent binding. Streptavidin was not reusable, although it is not clear from this study whether the protein was denatured in phenol, competitively bound to phenol, or deactivated by some other mechanism. Limited extraction was observed in pure water or pure chloroform at room temperature, showing that phenol is responsible for the high-efficiency extraction. A minimal 12% (v/v) phenol content is sufficient to fully dissociate the biotin–streptavidin bond.
Though affinity labeling and purification are commonly used techniques, the strong biotin–streptavidin bond often results in low yield, substrate damage, or other challenges that produce difficulty in performing sequential experiments on tagged molecules. As such, the capability to reliably and reversibly dissociate biotin-labeled DNA is expected to open up new possibilities in the downstream analysis of biotinylated constructs. The method reported here for breaking the biotin–streptavidin bond is unique for the absence of high temperatures and harsh chemicals while maintaining the integrity of the biotin and biotinylated construct. Consequently, the approach will be valuable not only to SS-nanopore measurements but also in a broad range of diverse nucleic acid preparations and analyses.
Supplementary Material
ACKNOWLEDGMENTS
The authors thank the Howarth lab (Oxford University) for supplying monovalent streptavidin. This work was supported by NIH grant 1R21CA193067. F.W. was supported by a predoctoral fellowship through the Redox Biology and Medicine Training Program (T32GM127261). SS-nanopore fabrication was performed at the Rutgers University Laboratory for Surface Modification.
Footnotes
Supporting Information
The Supporting Information is available free of charge on the ACS Publications website at DOI: 10.1021/acs.anal-chem.9b01873.
Uncropped images of all gels analyzed in this manuscript (PDF)
The authors declare no competing financial interest.
REFERENCES
- (1).Green NM Methods Enzymol. 1990, 184, 51–67. [DOI] [PubMed] [Google Scholar]
- (2).Li S; Liu H; Jia Y; Deng Y; Zhang L; Lu Z; He N Theranostics 2012, 2, 967–975. [DOI] [PMC free article] [PubMed] [Google Scholar]
- (3).Royo JL; Hidalgo M; Ruiz A Nat. Protoc 2007, 2, 1734–1739. [DOI] [PubMed] [Google Scholar]
- (4).Song CX; Szulwach KE; Fu Y; Dai Q; Yi CQ; Li XK; Li YJ; Chen CH; Zhang W; Jian X; et al. Nat. Biotechnol 2011, 29, 68–72. [DOI] [PMC free article] [PubMed] [Google Scholar]
- (5).Song C-X; Yi C; He C Nat. Biotechnol 2012, 30, 1107–1116. [DOI] [PMC free article] [PubMed] [Google Scholar]
- (6).Lu X; Han D; Zhao BS; Song C-X; Zhang L-S; Doré LC; He C Cell Res. 2015, 25, 386–389. [DOI] [PMC free article] [PubMed] [Google Scholar]
- (7).Szychowski J; Mahdavi A; Hodas JJL; Bagert JD; Ngo JT; Landgraf P; Dieterich DC; Schuman EM; Tirrell DA J. Am. Chem. Soc 2010, 132, 18351–18360. [DOI] [PMC free article] [PubMed] [Google Scholar]
- (8).Rudolf GC; Heydenreuter W; Sieber SA Curr. Opin. Chem. Biol 2013, 17, 110–117. [DOI] [PubMed] [Google Scholar]
- (9).Leriche G; Chisholm L; Wagner A Bioorg. Med. Chem 2012, 20, 571–582. [DOI] [PubMed] [Google Scholar]
- (10).Jurinke C; van den Boom D; Collazo V; Lüchow A; Jacob A; Köster H Anal. Chem 1997, 69, 904–910. [DOI] [PubMed] [Google Scholar]
- (11).Holmberg A; Blomstergren A; Nord O; Lukacs M; Lundeberg J; Uhlén M Electrophoresis 2005, 26, 501–510. [DOI] [PubMed] [Google Scholar]
- (12).Rothemund PWK Nature 2006, 440, 297. [DOI] [PubMed] [Google Scholar]
- (13).Sambrook J; Russell DW Cold Spring Harb. Protoc 2006, 2006, No. pdb.prot4455. [Google Scholar]
- (14).Adams MD; Soares MB; Kerlavage AR; Fields C; Venter JC Nat. Genet 1993, 4, 373–380. [DOI] [PubMed] [Google Scholar]
- (15).Cheng H-R; Jiang N Biotechnol. Lett 2006, 28, 55–59. [DOI] [PubMed] [Google Scholar]
- (16).Barnett R; Larson G Ancient DNA 2012, 840, 13–19. [DOI] [PubMed] [Google Scholar]
- (17).Fairhead M; Krndija D; Lowe ED; Howarth MJ Mol. Biol 2014, 426, 199–214. [DOI] [PMC free article] [PubMed] [Google Scholar]
- (18).Rueden CT; Schindelin J; Hiner MC; Dezonia BE; Walter AE; Arena ET; Eliceiri KW BMC Bioinf. 2017, 18, 529. [DOI] [PMC free article] [PubMed] [Google Scholar]
- (19).Schneider CA; Rasband WS; Eliceiri KW Nat. Methods 2017, 9, 671–675. [DOI] [PMC free article] [PubMed] [Google Scholar]
- (20).Yang J; Ferranti DC; Stern LA; Sanford CA; Huang J; Ren Z; Qin L-C; Hall AR Nanotechnology 2011, 22, 285310. [DOI] [PubMed] [Google Scholar]
- (21).Kirby KS Biochem. J 1957, 66, 495–504. [DOI] [PMC free article] [PubMed] [Google Scholar]
- (22).Tan SC; Yiap BC J. Biomed. Biotechnol 2009, 2009, 574398. [DOI] [PMC free article] [PubMed] [Google Scholar]
- (23).Green MR; Sambrook J Cold Spring Harb. Protoc 2017, 2017, No. pdb.prot093450. [DOI] [PubMed] [Google Scholar]
- (24).Grubmüller H; Heymann B; Tavan P Science 1996, 271, 997–999. [DOI] [PubMed] [Google Scholar]
- (25).Hyre DE; Le Trong I; Merritt EA; Eccleston JF; Green NM; Stenkamp RE; Stayton PS Protein Sei. 2006, 15, 459–467. [DOI] [PMC free article] [PubMed] [Google Scholar]
- (26).Rose AS; Bradley AR; Valasatava Y; Duarte JM; Prlic A; Rose PW Bioinformatics 2018, 34, 3755–3758. [DOI] [PMC free article] [PubMed] [Google Scholar]
- (27).Chen Z; FUjiwara S; Bhat NK; Lautenberger JA; Fisher RJ Gene Anal. Tech 1989, 6, 44–46. [DOI] [PubMed] [Google Scholar]
- (28).Strick TR; Allemand JF; Bensimon D; Bensimon A; Croquette V Science 1996, 271, 1835–1837. [DOI] [PubMed] [Google Scholar]
- (29).Smith SB; Cui YJ; Bustamante C Science 1996, 271, 795–799. [DOI] [PubMed] [Google Scholar]
- (30).Smith DE; Tans SJ; Smith SB; Grimes S; Anderson DL; Bustamante C Nature 2001, 413, 748–752. [DOI] [PubMed] [Google Scholar]
- (31).Dekker C Nat. Nanotechnol 2007, 2, 209–215. [DOI] [PubMed] [Google Scholar]
- (32).Wanunu M Phys. Life Rev 2012, 9, 125–158. [DOI] [PMC free article] [PubMed] [Google Scholar]
- (33).Tabard-Cossa V; Wiggin M; Trivedi D; Jetha NN; Dwyer JR; Marziali A ACS Nano 2009, 3, 3009–3014. [DOI] [PMC free article] [PubMed] [Google Scholar]
- (34).Bell NAW; Keyser UF Nat. Nanotechnol 2016, 11, 645–651. [DOI] [PubMed] [Google Scholar]
- (35).Chen K; Juhasz M; Gularek F; Weinhold E; Tian Y; Keyser UF; Bell NA W. Nano Lett 2017, 17, 5199–5205. [DOI] [PMC free article] [PubMed] [Google Scholar]
- (36).Bayley H; Martin CR Chem. Rev 2000, 100, 2575–2594. [DOI] [PubMed] [Google Scholar]
- (37).Sischka A; Galla L; Meyer AJ; Spiering A; Knust S; Mayer M; Hall AR; Beyer A; Reimann P; Gölzhäuser A; Anselmetti D Analyst 2015, 140, 4843–4847. [DOI] [PubMed] [Google Scholar]
- (38).Marshall MM; Ruzicka JA; Taylor EW; Hall AR PLoS One 2014, 9, el01632. [DOI] [PMC free article] [PubMed] [Google Scholar]
- (39).Wanunu M; Sutin J; McNally B; Chow A; Meller A Biophys. J 2008, 95, 4716–4725. [DOI] [PMC free article] [PubMed] [Google Scholar]
- (40).Li J; Talaga DS J. Phys.: Condens. Matter 2010, 22, 454129. [DOI] [PMC free article] [PubMed] [Google Scholar]
- (41).Bell NAW; Muthukumar M; Keyser UF Phys. Rev. E: Stat. Phys., Plasmas, Fluids, Relat. Interdiscip. Top 2016, 93, 022401. [DOI] [PMC free article] [PubMed] [Google Scholar]
- (42).Carlsen AT; Zahid OK; Ruzicka JA; Taylor EW; Hall AR Nano Lett. 2014, 14, 5488–5492. [DOI] [PubMed] [Google Scholar]
- (43).Zahid OK; Zhao BS; He C; Hall AR Sei. Rep 2016, 6, 29565. [DOI] [PMC free article] [PubMed] [Google Scholar]
- (44).Wang F; Zahid OK; Swain BE; Parsonage D; Hollis T; Harvey S; Perrino FW; Kohli RM; Taylor EW; Hall AR Nano Lett. 2017, 17, 7110–7116. [DOI] [PMC free article] [PubMed] [Google Scholar]
- (45).Zahid OK; Wang F; Ruzicka JA; Taylor EW; Hall AR Nano Lett. 2016, 16, 2033–2039. [DOI] [PMC free article] [PubMed] [Google Scholar]
- (46).Fologea D; Gershow M; Ledden B; McNabb DS; Golovchenko JA; Li JL Nano Lett. 2005, 5, 1905–1909. [DOI] [PMC free article] [PubMed] [Google Scholar]
- (47).Rivas F; Zahid OK; Reesink HL; Peal BT; Nixon AJ; DeAngelis PL; Skardal A; Rahbar E; Hall AR Nat. Commun 2018, 9, 1037. [DOI] [PMC free article] [PubMed] [Google Scholar]
Associated Data
This section collects any data citations, data availability statements, or supplementary materials included in this article.