

Abstract
Redox species such as transition metals may, unknowingly, integrate carbon materials that are produced (or supplied) for the assembling of electrodes in batteries, supercapacitors, and fuel cells. The extent to which these species alter the electrochemical profile of carbons and affect the performance and/or degradation of energy storage systems is still not fully appreciated. Alkaline oxidation (or fusion) is a promising approach to disintegrate nanocarbons for the subsequent study of their chemical composition by routine analytical tools. In this work, three commercial carbon powders, relevant for electrochemical applications and bearing varied textural orientation (point, radial, and planar), were selected to evaluate the versatility of fusion as a pretreatment process for elemental analysis. Additionally, the interaction of the flux, a lithium borate salt, with the carbons was elucidated by examining their post-fusion residues. The degree of structural degradation varied and, generally, the doping with Li and/or B (whether substitutional or interstitial) was low to nonexistent. With future developments, fusion could become a relevant pretreatment method to analyze the composition of carbon materials, even when complex mixtures (e.g., cycled battery electrodes) and larger batch scales are considered.
1. Introduction
The textural and structural versatilities of carbon materials explain their diverse properties which range from the gas impermeability of glass-like carbon1 to the outstanding charge carrier mobility measured in graphene.2 For quite some time, one of the main areas of interest of the carbon research community has been energy storage and conversion systems, namely, the application of these materials as electrodes and current conductors. It is notable that three decades after the lithium-ion batteries were first commercialized, processed graphite flakes remain the preferred choice of anode material. Perhaps more surprising is the fact that there is no way to reliably (and routinely) measure the concentration of chemical elements in carbon-based battery electrodes.3
Concerning the elemental analysis of refractory materials such as graphite, there is a limited number of methodologies that one can resort to when sampling at batch scale. In particular, when considering carbon materials, the utilization of analytical tools and metrology protocols by Industry and Academia is, generally, nonstandardized. This could explain many of the uncertainties that populate the nanocarbons’ market and research fields such as commonly reported variations for the nexus structure–composition properties. In a recent report, an example of an uncertainty source was described: two different lots of single-walled carbon nanotube (SWCNT) powder were purchased which, after assessment with neutron activation analysis (NAA) and ion beam analysis (IBA), were seen to present large and undisclosed variations in their chemical composition.4 Overall, without tools and protocols that are both cost-effective and comply with regulatory legislation, it will be challenging to maintain a chain of trust that includes all stakeholders of the nanocarbon field.
Plasma-based analytical methods such as inductively coupled plasma optical emission spectroscopy (ICP-OES) are an interesting option for the routine study of chemical composition of (nano)carbons. However, these materials can be difficult to disaggregate, a critical step to leach elements from the carbonaceous matrix and prepare solutions for ICP-OES analysis.5 To present, ashing and acid digestion are the most popular sample preparation approaches.6 In 2016, we observed that alkaline oxidation (a.k.a. fusion) is also capable to digest different types of carbons.7 The ICP-OES readings from the fusion procedure were compared with those of microwave-assisted acid digestion, but the outcome was not entirely conclusive. In a follow-up study, we validated fusion for ICP-OES by resorting to a chemically certified reference material (CRM), the SWCNT-1, and a lithium (meta)borate salt.8 Additionally, it was shown that the disintegration of the carbonaceous matrix occurred without the formation of compounds such as carbides or the integration of B (by substitution) or Li (by intercalation) in the structure of the nanotubes.
To extend on the above, the next logical step is to apply and validate the fusion approach for other carbon materials. In particular, testing of commercial samples that may present batch-to-batch differences in texture, morphology, and chemical composition could be of relevance to teams that integrate these in energy storage systems. In this work, three types of carbons (carbon black, carbon nanotubes, and expandable graphite) were subjected to alkaline oxidation and their chemical composition studied with ICP-OES. Given the nonexistence of matrix-matched CRMs, the validation of concentration values was done with reference to previously obtained readings from NAA, a primary analytical method.9 When sample residues were obtained, these were structurally and spectroscopically evaluated to shed light on the disintegration path of the carbon materials.
2. Results and Discussion
2.1. Electrochemical Analysis
Generally, research teams investigating intercalation-type batteries assemble their electrochemical cells trusting that the carbon materials they procure are homogeneous and pure. However, this may not always be the case.4,10 To identify electrochemically active substances that are not intrinsic to carbon allotropes, one expeditious tool is cyclic voltammetry (CV). For the three carbonaceous powders studied here, the CV survey revealed that they all presented redox peak pairs (Figure 1). The carbon black (CB) (Figure 1a) showed a mostly capacitive behavior with one pair of broad peaks at 0.3–0.4 V [vs standard calomel electrode (SCE)]. This is typical of a redox reaction of oxygen-containing functional groups11 grafted to the carbon lattice. A similar behavior was observed for the expandable graphite (Figure 1b). While a lower capacitive current was identified, the 0.3–0.4 V peaks were more resolved. This could be due to the presence of an increased number of grafted moieties and/or additional electrochemically active species. Interestingly, the CV of the nanotubes (Figure 1c) presented much larger current values and three distinct redox pairs, in the interval 0.2–0.5 V (vs SCE). Besides the oxygen-containing moieties, several electrochemically active species could be present (such as the molybdenum used to grow nanotubes).12−14 Overall, the disparity in the number of redox pairs and the capacitive current readings is notable, despite all samples being commercialized as carbon materials. While it is not the aim of the present work to study the mechanisms through which foreign elements may affect the performance of electrode materials (capacity, durability, etc.), analogous studies for the electrocatalysis field provided conclusive evidence of the critical impact that metallic impurities have.15−20 Still, as the redox pairs result from the presence of noncarbon elements, understanding the chemical composition of these powders is critical to explain their electrochemical response.
Figure 1.

Cyclic voltammograms of the as-received (a) CB, (b) expandable graphite, and (c) SWCNTs, showing the presence of reversible redox pairs; these peaks are extrinsic to carbon materials.
2.2. Elemental Analysis
In the majority of cases, commercial carbons are sold through a distributor. To validate the product’s quality, the manufacturer provides a technical specifications sheet. Unfortunately, given the lack of standardized protocols and independent quality seals, the information provided on chemical composition of carbon powders may not be entirely reliable. Previously, we used NAA and IBA to characterize the composition of the materials investigated here.4 Given its status of primary metrological tool, the elemental concentrations measured with NAA were considered as benchmark values for the present ICP-OES study. To prepare the three carbon powders, an alkaline oxidation procedure (recently validated for a certified nanocarbon sample)8 was used. The ICP-OES results of eight selected elements are summarized in Table 1 (note that the concentrations derive from the average of three different samples for each carbon powder).
Table 1. ICP-OES Results for the Commercial Carbon Black, Expandable Graphite, and SWCNTs Samples; Average Values and Standard Deviations Calculated from N = 3.
| carbon
black |
expandable graphite |
SWCNTs |
|||||||
|---|---|---|---|---|---|---|---|---|---|
| element | NAA (μg/g) | ICP-OES (mg/L) | recovery (%) | NAA (μg/g) | ICP-OES (mg/L) | recovery (%) | NAA (μg/g) | ICP-OES (mg/L) | recovery (%) |
| As | <0.16 | <LOD | N/A | <1.2 | 0 | N/A | 1318 ± 23 | 916 ± 78 | 70 ± 6 |
| Ca | 62 ± 8 | 33.2 ± 9.4 | 53 ± 15 | 240 ± 30 | 90 ± 5 | 89 ± 11 | <70 | 49.8 ± 0 | N/A |
| Co | <19 | <LOD | N/A | 171 ± 13 | 25 ± 15 | 15 ± 9 | 5820 ± 90 | 5026 ± 192 | 86 ± 3 |
| Cr | 0.56 ± 0.09 | <LOD | N/A | 11.2 ± 3 | 10 ± 0 | 90 ± 2 | 318 ± 6 | 315 ± 4.7 | 97 ± 2 |
| Fe | <13 | <LOD | N/A | 485 ± 19 | 107 ± 9 | 22 ± 2 | <800 | 428 ± 14 | N/A |
| K | <11 | <LOD | N/A | 240 ± 40 | 261 ± 43.4 | 109 ± 18 | <400 | 19.6 ± 8 | N/A |
| Mn | <0.1 | <LOD | N/A | 1186 ± 20 | 1017 ± 12 | 86 ± 1 | 18.6 ± 0.6 | 19.9 ± 0 | 107 ± 0 |
| Mo | <5 | <LOD | N/A | <30 | 0 | N/A | 39 900 ± 800 | 37 230 ± 417 | 93 ± 1 |
In respect to the CB, when the melt was poured into the beaker (half-filled with 10% HNO3), it did not yield a homogeneous transparent solution. Instead, a suspension resulted where black particles were notoriously visible. Using centrifugation and filtration, the residues were separated from the liquid, which was then taken to the ICP-OES. Most of the elements listed in Table 1 could not be identified, either because of their absence or because they were present in quantities below the limit of detection (LOD) of the optical spectrometer (see Experimental Section). The lack of, for instance, transition metals was expected as the CB should be (almost) free of these (as per the vendor technical sheet, it is produced from the thermal decomposition of acetylene). The exception was calcium but, when compared to the benchmark concentration,4 it was possible to recover only 53% of it. One plausible explanation concerns the lack of chemical homogeneity of CB, as one of the three samples gave Ca levels below the LOD.
Differently, pouring the melt containing expandable graphite into the beaker resulted in a clear solution with very few suspended particles. Attending to the benchmark values, the recoveries obtained for Ca, Cr, K, and Mn were quite satisfactory. On the other hand, the concentration of Fe measured with ICP-OES was well below the expected figure (Table 1). It is pertinent to note that, with NAA, it was not possible to achieve similar mass fractions on the duplicates for this element.4 Again, this could be justified by the nonhomogeneity of the powder. Still, and while merely indicative, there is a coincidence of the ICP-OES Fe reading (107 mg/L) with that of IBA in ref (4) (109 mg/L).
As concerns the sample of carbon nanotubes, the highest concentrations were measured for Co, Mo, As, and Cr (Table 1). The first two elements acted as catalysts during the synthesis process of the nanotubes.21 With the exception of As, all recoveries were satisfactory. A possible reason for the low recovery of this element is its relatively low boiling point (613 °C). Considering that the fusion reaction temperature was more than 1000 °C (in an open vessel), it is not surprising that significant mass losses of As occurred.
2.3. Structural Analysis
The generation of byproducts is a possibility that is commonly referred to in the literature of alkaline oxidation. In the case of carbon, possible inorganics that could be formed include intercalation compounds, carbides, or substitutionally doped graphene layers. In view of this, the structural characterization of the as-received powders and their fusion residues (if available) was carried out with electron microscopy and solid-state nuclear magnetic resonance (NMR).
Scanning electron microscopy (SEM) and transmission electron microscopy (TEM) are powerful tools to analyze the morphology and microstructure of carbon materials. Furthermore, they can be complemented with energy-dispersive X-ray spectroscopy (EDXS) to pinpoint the presence of different elements in particles. In Figure 2, a tableau is presented that contains low- and medium-magnification TEM images of the flux and carbon powders, before and after the fusion process.
Figure 2.

Low- and medium-magnification TEM micrographs of the flux and carbons in the as-received and post-fusion states, (a–d) lithium borate (LiBO2), (e–h) acetylene CB, (i–l) EG, and (m–p) SWCNTs.
The first set of panels (Figure 2a,d) refers to the lithium flux. From the TEM micrographs, the as-received salt appeared agglomerated and with an undefined structure. Given its dielectric nature, charging was observed, preventing a more detailed study at higher resolution. In this case, the SEM images were more informative as they showed the spheroidal morphology of the microscaled particles (with several hundreds of micrometers in diameter) and their rough surface (Figure S1a,b). After the (blank) fusion process, the TEM micrographs revealed fragments with a more defined shape, but no microstructural information could be extracted. Still, from the powder X-ray diffraction (XRD) patterns, changes to the overall atomic arrangement of the material took place as it became more crystalline after resolidification (Figure S2). The post-fusion SEM images of the lithium salt were not informative (not shown). The EDXS analysis, before and after melting (Figure S3a,b, respectively), did not identify other elements besides B and O (note that the Li is too light to be detected with this technique).
The as-received CB showed the primary and secondary structures typical of these materials (Figure 2e,f). Larger agglomerates were seen in the SEM images (Figure S4a,b). The EDXS spectrum contained only Cu (from the grid) and C (Figure S5a). Upon the fusion process, identifying the presence of blacks (or residues of these) was not straightforward (Figure S5b). For the most part, the TEM grids showed the presence of irregularly shaped particles that are most likely derived from the lithium salt (Figure 2g,h). Possibly, and despite the pronounced suspension seen in the melt-receiving beaker, the aggregating secondary structure was lost, which made imaging of the isolated blacks challenging.
In the case of expandable graphite, the as-received powder contained faceted flakes with a fair degree of graphitic arrangement (Figure 2i,j). The dimensions of the flakes were clarified with SEM (Figure S6), with an average size of 500 μm measured. The elements identified initially by EDXS were C, O, Na, S, Ca, Cr, and Fe (Figure S7a). After the fusion, few particles were collected from the melt-receiving beaker. Still, these showed an interesting level of resilience, as demonstrated by the images in Figure 2k,l. While the flake facets were lost (i.e., its planar texture at the microscale and above), the carbon was not entirely disintegrated and reorganized into smaller graphitic crystallites (nanotexture) with random orientation. From the EDXS analysis (Figure S7b), the presence of some of the intercalants was identified (e.g., S).
Besides bundles of well-structured nanotubes (observed both with TEM and SEM, Figure S8), the as-received sample of SWCNTs contained nanoparticles and amorphous carbon (Figure 2m,n). In general, the particles were enclosed by graphitic shells and consisted of catalyst remainders (Co and Mo), as identified with EDXS (Figure S9). Post-fusion, there were barely any suspended residues in the melt-receiving beaker, but, after evaporation, a small quantity was collected. The TEM assessment (Figure 2o,p) did not identify nanotubes. Instead, lumps of disordered carbon dominated the residues.
While the microscopical analysis provided insight into the structural organization of the carbon powders, pre- and post-fusion, questions remained regarding the extent of the flux interaction with the samples. In respect to this, solid-state NMR can be a powerful aid as it allows the study of the chemical environments experienced by a range of elements such as Li and B. These two nuclei, along with C, were probed with one-dimensional (1D) magic angle spinning (MAS) NMR and two-dimensional (2D) multiple-quantum (MQ)-MAS NMR. The aim was to identify both structural and chemical changes resulting from the exposure of the carbon materials to the lithium borate melt.
First, the effect of melting and resolidification on the (blank) lithium flux structure was studied. In particular, the B–O network was examined using the 11B quadrupolar nuclei (Figure 3). The single-pulse 11B MAS NMR spectrum of the as-received flux revealed two groups of resonances, centered at 5 and 20 ppm (Figure 3a). The first can be assigned to the tetrahedral BO4 sites because the second-order quadrupolar broadening is small and the peak is clearly resolved. The broader downfield resonance, at 20 ppm, follows a pattern that can be assigned to the triangular BO3 species. As for the corresponding 11B MQMAS (Figure 3b, blue), it shows that the BO4 resonance has a single symmetric site.22,23 By contrast, the as-received salt contains BO3 units exposed to different chemical environments. The range of peaks (marked with blue arrows) is due to the symmetric, or trigonal, sites (i.e., containing three bridging or nonbridging oxygen atoms) and the asymmetric sites (i.e., with one or two bridging oxygen atoms). Post-fusion, the changes occurring to the B–O network are evident from both the 1D and 2D spectra. The 11B MAS NMR (Figure 3a) shows an overall upfield shift for the two peaks. In addition, the BO4/BO3 intensity ratio decreases and the BO3 resonance splits into two well-separated components (at 17 and 23 ppm). In order to show the number of distinct boron sites present in the fused system, 11B MQMAS was employed (Figure 3b, red). For the BO3 sites, the most remarkable variation is in the isotropic distribution, though a slight shift is also present in the anisotropic axis. These are due to the rearrangement of boron coordination and the existence of multiple BO3 sites. The sensitivity of this interaction to the dispersion of the B–O–B bond angle is known.24 Taken together, the BO3 asymmetric fraction increased and became more abundant than its symmetric counterpart. As regards the BO4 sites, it is interesting that the 11B MQMAS points to an increased structural ordering as the corresponding peak loses its lobes, thus becoming comparatively sharper. A higher degree of crystallinity in this salt is corroborated by the XRD powder diffractograms mentioned above (Figure S2) and previous literature reports.25
Figure 3.

11B solid-state NMR for the lithium flux in as-received (blue) and fused (red) states: (a) 1D MAS spectra and (b) 2D MQMAS, where the traced lines are guides to the eye marking the shift differences that occurred between the as-received and fused salt in the B–O arrangements.
Besides the B–O network, the study of the chemical environment of Li is also informative. The 7Li MAS for the blank flux, pre- and post-fusion, shows a single broad peak that results from the existence of different lithium sites (Figure S10).26−28 After the heat treatment, a small upfield shift of this peak was detected. As for the complementary 7Li MQMAS (Figure S11a), it shows different line widths: the sharpness of the post-fusion peak (red) contrasts with the broader fingerprint of the as-received salt (blue). This is in agreement with the 11B and XRD observations. Upon melting, it is possible that the salt oxidized further as it reacted with atmospheric oxygen (for instance, via the production of Br2 from the 1.5 wt % LiBr). Subsequently, there would be a higher density of BO4 units. These would stabilize the structure and create electronically denser sites where the Li+ could be accommodated. In these circumstances, the highly mobile lithium, while experiencing faster exchange rates, would be hoping through well-defined lattice sites. This would then account for the narrower MQMAS shape.
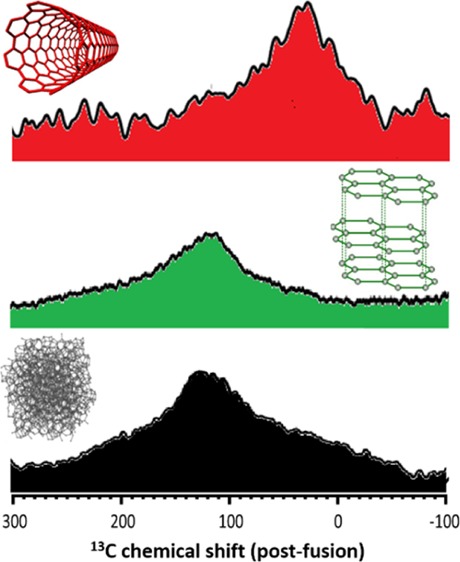
Following the analysis of the flux (blank), its interaction with the three carbon powders was investigated by 13C, 11B, and 7Li NMR. In Figure 4, the 13C MAS NMR spectra for the as-received and fused carbons are shown. The CB exhibited, initially, a broad signal at ca. 100 ppm (Figure 4a, bottom spectrum). After being in contact with the melt of the lithium salt, a slight downfield shift was observed and attributed to bonding with electronegative elements, most likely oxygen (Figure 4a, top spectrum).29 A similar behavior was observed for the expandable graphite (Figure 4b). Here, obtaining a clear signal was challenging because of the presence of paramagnetic iron (Table 1) and the relaxation effect, a phenomenon that was observed in previous studies.30 In the case of the as-received carbon nanotubes (Figure 4c), the spectrum contained an asymmetric peak which could be deconvoluted into two signals (at 119 and 125 ppm). These were assigned to the sp2-hybridized carbon atoms present in metallic and semiconducting tubes.31−33 With the fusion process, the intensity of the entire asymmetric peak was considerably decreased and another broad peak appeared, at 37 ppm. According to the literature, this chemical shift is typical of sp3-hybridized carbon atoms.34,35 Here, its presence is explained by the oxidation process that disintegrates and burns the nanotubes, with the residues being small fragments of disordered carbon material, as confirmed with TEM.
Figure 4.

13C solid-state MAS NMR for (a) CB, (b) EG, and (c) SWCNTs, in the as-received (bottom spectra) and fused states (top spectra).
The 11B analysis was more detailed with both MAS and MQMAS spectra acquired for the three post-fusion carbon samples (Figures 5 and S12). The 11B MAS NMR of the fused CB and expandable graphite showed a response resembling that of the blank flux (Figure 5a). The two resonances, at 5 and 17 ppm, were assigned to the symmetrical tetrahedral BO4 coordination and to the triangular BO3 coordination species, respectively. While the chemical shifts in these samples are constant, the intensity ratio of the two lines varies. The consistent intensity reduction from the blank to the carbons indicates that the tetrahedra are replaced by triangular units. This is more pronounced in the expandable graphite. Given the extended disintegration observed for this sample (when comparing the density of suspended particles in the melt-receiving beakers), one explanation is that the combustion of the carbons was partially assisted by the loss of an oxygen atom from the BO4 units. In addition, a very weak peak appeared at 28 ppm. Slightly more intense in the fused expandable graphite, this was assigned to the chemical environment of B–C bonds with trigonal planar symmetry.28 The 11B MQMAS spectra of these two fused carbons showed similar profiles to that of the resolidified flux. The main difference was a broader peak distribution on the symmetric BO3 sites for the carbons, with this band extending downfield to about 20 ppm (regions marked with squares in the insets of Figure S12). Concerning the nanotubes, these showed a completely different response from the other carbon samples. The 11B MAS spectra of the fused SWCNT (Figure 5a) shows the same two peaks (for the BO4 and BO3 units), but the chemical shifts, intensity ratio, and line widths are surprisingly similar to those of the as-received flux (blank). As for the 11B MQMAS, the two peaks undergo broadening. At 17 ppm, there is a noticeable downfield shift (on both the isotropic and anisotropic components), but a small amount of boron remains in the same position, as indicated by the red arrows in Figure 5b. At 5 ppm, the (relative) intensity of the peak is significantly increased. The similarity in the 1D and 2D spectral profiles indicates that the chemical environment for the BO3 units is more represented by the symmetric than the asymmetric coordination. Also, the BO4 lobes are indicative of a less ordered array of these units. Put together, the presence of the sp3-type fragments and, possibly, the transition metals Co and Mo could have impaired the restructuring of the flux that was seen for the blank and the other two carbon samples. In this regard, the reorganization favored the trigonal BO3 unit dispersion while preventing the BO4 units to generate lattice sites for the lithium.
Figure 5.

11B solid-state NMR for the lithium flux and carbon samples after the fusion procedure: (a) 1D MAS spectra, where the traced lines signal the intensity maxima of the different peaks identified, (b) 2D MQMAS of the flux (red) and the SWCNT (purple), both fused, and where the arrows highlight the changes in the distribution of the BO3-related peaks.
To finalize the study for the carbon samples, high-resolution 7Li MAS and MQMAS spectra were acquired. For the CB and the expandable graphite, the results were similar (Figure S11b,c). In both cases, a broad peak resulted, which means that the lithium had very slow motion. This can be explained by some sort of interaction with the carbon atoms, possibly via intercalation of the alkali metal. In addition, a new upfield peak appears in both cases (indicated by arrows), which was attributed to the presence of the Li+ species in the vicinity of the carbon surface. For the carbon nanotubes (Figure S11d), the 7Li MQMAS showed an even broader peak. The lithium had slower motion, possibly raising the prospect of interstitial trapping in a disordered network of carbons. One additional peak was found downfield (marked with an arrow), which could refer to trapping of lithium in an ordered pore such as the interior of a surviving tubular section or in the interstice of a bundle of sectioned SWCNTs.
2.4. Discussion
In the above, several types of carbon materials were subjected to alkaline oxidation in order to chemically analyze them with ICP-OES. Using the same experimental parameters, the degree of disintegration of the carbon matrix differed, with the SWCNTs being the sample that was best digested. Several factors could explain this, such as the differences in textural orientation (point, radial, and planar), the number of stacked graphene layers (for the EG and SWCNT), or the presence of oxidation accelerators such as metallic impurities (e.g., Co and Mo originating from the production of SWCNT). In the specific case of CB, it was noticed that its powder was less dense (“fluffier”), which made the prefusion homogenization with the lithium flux more challenging. Moreover, it is not clear if wetting by the molten salt is as efficient as for the other two materials. Accordingly, and while the elemental analysis of the CB was unreliable, the measurements performed on the expandable graphite and the nanotubes were satisfactory: clear, transparent solutions were obtained, which enabled recoveries well above 80% for various elements. Here, it is interesting to highlight the values for Co and Mo in the nanotube sample, at 86 and 93%, respectively. These yields are higher than the analogous for a certified SWCNT, also reported by us.8 Given that the matrix was similar, it appears that employing a beaker filled with an acid solution (to directly collect and dissolve the melt) represents a more reliable approach than pouring the fused salt onto a mold and subsequently crush/dissolve the resulting glass-like bead.
Following the structural analysis, it was observed that the type and extent of the lithium borate interaction with a carbon powder can vary. First, despite the post-fusion broadening of the main 13C MAS-NMR resonance (common to all), different displacements took place. For the CB and the expandable graphite, the peak moved upfield, probably because of the proximity of electronegative elements. In the case of nanotubes, the main peak shifted downfield, implying their widespread destruction and dominant presence of sp3 carbon species. This result is in good agreement with our previous study.8 Second, from the 11B MQMAS data, the CB and expandable graphite had responses that were similar to that of the fused flux, the exception being a barely noticeable peak at 28 ppm. Hence, the direct interaction of the B with the C species was minimal, but the formation of some residual B–C bonds is a possibility, in particular for the expandable graphite. By contrast, the SWCNT showed a similar behavior to the as-received flux, with spectral changes referring mainly to the BO4 symmetry. Finally, the 7Li MQMAS analysis suggests the slight occurrence of interstitial trapping of Li+ in the residues of the SWCNT, while in the CB and graphite residues, the interaction is mostly surface-based or related to basal plane intercalation. Note that the identification of interstitial lithium is in contrast to our previous work.8 Several factors could explain this inconsistency: (1) the lithium salt and the SWCNT sample used were different and (2) the 7Li SS-NMR study included a 2D spectral analysis which is, generally, more sensitive to identify multinuclei interactions.
3. Conclusions
Identifying and quantifying the presence of foreign elements in carbon electrode materials are important steps to understand how they may affect the performance and stability of energy storage systems such as batteries. Three commercial carbons—with point, radial, and planar textural orientation—were surveyed with CV, confirming the presence of redox species in the as-received powders. Upon subjecting these to a process of alkaline oxidation (or fusion), it was possible to measure the concentration of several transition metal elements with ICP-OES. Further to this, particulate residues were collected for structural analysis with electron microscopy and NMR.
Although the fusion pretreatment process was unsuccessful for the CB, it did result in clear liquids (to the naked eyes) for the expandable graphite and nanotubes. The elemental levels for these two materials, measured with ICP-OES, were very close to the benchmark concentrations obtained with NAA. Post-fusion, the residues of the expandable graphite kept part of the graphitic structure, while in the case of nanotubes, the carbon lattice became predominantly disordered. In line with the microscopical observations, the multinuclei NMR structural study identified several types of minor interactions between carbon and lithium, with interstitial trapping likely taking place in the residues of the nanotubes.
Overall, alkaline oxidation is a simple and low-cost sample pretreatment approach for ICP-OES, applicable to structurally different carbon materials.
4. Experimental Section
4.1. Reagents, Materials, and Solutions
The CB (acetylene, 99.9%, Lot S20A074, CAS 1333-86-4, Alfa Aesar), the SWCNTs (Lot MKBW7867, CAS 308068-56-6, Sigma-Aldrich), and expandable graphite (grade 3772, Lot 881201B-3, Asbury Carbons) were procured and used as-received. For the flux, a lithium salt containing 98.5 wt % of lithium metaborate, LiBO2 (CAS 13453-69-5), and 1.5 wt % LiBr (CAS 7550-35-8) was purchased from Malvern PANalytical. Pt/Au crucibles (95/5 wt %, Malvern PANalytical) were employed as reaction vessels during the fusion procedure. To dissolve the glass-like beads resulting from the fusion, a 10% nitric acid (HNO3) solution was prepared from 70% HNO3 (Aristar Plus, Lot 1118092, CAS-7697-37-2, BDH, Canada) using deionized water (resistivity = 18 MΩ·cm, produced with a Milli-Q system from Millipore, UK). Standard stock solutions of single elements (PerkinElmer and Inorganic Ventures, US) were used to calibrate the ICP-OES instrument, namely, 2% (v/v) solutions of Ca (CAS 7440-70-2, Lot 16-94 Ca), K (CAS 7440-09-7, Lot 16-26 K), Co (CAS 7440-48-4, Lot 16-76 Co), Mn (CAS 7439-96-5, Lot 15-91 Mn), As (CAS 7440-38-2, Lot 15-64 As), Cr (CAS 7440-47-3, Lot 15-65 Cr), and Fe (CAS 7439-89-6, Lot 15-185 Fe) and a Mo standard derived from Inorganic Ventures, with a matrix of H20/tr NH4OH (Lot D2-MO02036, CAS 7732-18-5 for water, CAS 1636-21-6 for ammonium hydroxide, and CAS 13106-76-8 for ammonium molybdate).
4.2. Electrochemical and Structural Analyses
4.2.1. Cyclic Voltammetry
Electrodes were prepared according to a procedure reported elsewhere.11 In short, 5 mg of the carbonaceous material was mixed with 15 μL of Nafion (5 wt % in water and isopropanol), 500 μL of deionized water, and 500 μL of isopropanol, to obtain a mixture which was then ultrasonicated for 30 min. This slurry was drop-cast onto a glassy carbon electrode (3 mm in diameter) and dried under an incandescent bulb lamp for 15 min, in atmospheric conditions. All electrochemical experiments were carried out on a Bio-Logic VMP3 electrochemical workstation, using 1 M H2SO4 as the electrolyte, a Pt wire as the counter electrode, and a SCE as the reference electrode. Cyclic voltammograms were obtained at scan rates of 50 mV s–1 in the 0–1 V (vs SCE) range and at room temperature.
4.2.2. Transmission Electron Microscopy
Microstructural imaging and energy-dispersive X-ray spectroscopy (EDXS) were performed at 300 kV using a Thermo Fisher Scientific Titan SuperTWIN microscope incorporating an EDAX octane silicon drift detector. Samples were prepared by suspending a few milligrams of the powder materials in ethanol and then drop-cast these onto Holey-carbon Cu grids. For the glass-like beads (blank or sample), an agate pestle and mortar was used to crush and grind these to a powder.
4.2.3. Magic Angle Spinning Nuclear Magnetic Resonance
All samples were grinded with an agate pestle and mortar. For the 1D 13C MAS NMR, a known amount of powder material was filled into zirconia rotors and the spectra recorded on a Bruker AVANCE III spectrometer, operating at a resonance frequency of 100 MHz and using a conventional double resonance 4 mm MAS probe. The spinning frequency was set to 10–15 kHz. NMR chemical shifts are reported with respect to tetramethylsilane, which acted as the external reference. Spectra were recorded via a spin echo pulse sequence (pulse length of 3.4 μs) with four-phase alternation, synchronized with the spinning rate for the MAS experiments (to delete all background signals from the probe). The interscan delay was set to 15 s to allow complete relaxation. 5000 to 30 000 scans were performed. An apodization function (exponential), corresponding to a line broadening of 80 Hz, was applied prior to the Fourier transformation. For the 1D 11B (I = 3/2) MAS NMR, the experiments were recorded on a 21.1 T Bruker AVANCE III spectrometer (vL(11B) = 288.826 MHz) with a double-resonance 3.2 mm MAS probe and a spinning frequency of 20 kHz with short pulse (π/12 with a pulse width of 1 μs and repetition time of 2 s). For the 11B multiple-quantum (MQ)MAS experiments, a three-pulse MQMAS sequence with a z-filter and a spinning frequency of 20 kHz was used. The excitation and conversion pulse lengths were 5.7 and 1.9 μs, respectively, and the read pulse length was 20 μs. The t1 increment was 50 μs to ensure rotor-synchronized data acquisition. Chemical shifts are referenced to an external sample of 1 M boric acid. For the 1D 7Li MAS NMR, experiments were carried out on a 21.1 T Bruker AVANCE III spectrometer (vL(11B) = 288.826 MHz) with a double resonance 3.2 mm MAS probe and a spinning frequency of 20 kHz. A single-pulse sequence with phase cycling was employed. Sixty-four scans were performed with a 3 s pulse duration and a 1 s repetition time. The external reference (0 ppm) was LiCl powder. For the 7Li MQMAS, the experiments were carried out using a three-pulse MQMAS sequence with a z-filter and a spinning frequency of 20 kHz. The excitation and conversion pulse lengths were 3.6 and 1.3 μs, respectively, and the read pulse length was 20 μs.
4.3. Alkaline Oxidation
The Pt crucibles were thoroughly washed with a diluted acid solution for 1 h and then cleaned with 70% (v/v) ethanol. The fusion blank (control) was prepared by weighing 250 mg of the flux. The fusion sample was prepared by adding 25 mg of the carbonaceous material to 250 mg of the flux (1:10 ratio) and carefully mixing these, inside the Pt crucible, with the assistance of a vortex. The vessel was then taken to the furnace (Claisse LeNeo, Malvern PANalytical) where the melting process started at 1050 °C and lasted for 6 min. For the structural analysis, the glass-like samples were carefully broken with a manual press followed by grinding with an agate pestle and mortar until a powder was obtained. For TEM, around 1 mg of sample was dissolved in 10 mL of ethanol. For the ICP-OES analysis, the crucible was tilted and the melt dropped into a polypropylene beaker filled with a 10% HNO3 solution. Stirring took place for 4 min, that is, until the total dissolution of the melt.
4.4. Elemental Analysis
For the ICP-OES measurements, an Agilent 5110, bearing a synchronous vertical dual-view configuration and a wavelength window between 167 and 785 nm, was employed. The instrumental parameters used are listed in Table 2. To calibrate the equipment, single-element solutions of As, Co, Cr, Mn, Mo, Ca, Fe, and K, at concentrations of 0.5, 5, and 50 ppm, were used. All were derived from the respective 1000 ppm single-element standards. In order to check the instrument performance and ensure that its precision was not degrading over the period of the analysis, a quality control sample (1 ppm) and solutions for continuing calibration verification (5 ppm) were prepared.
Table 2. Operating Parameters for ICP-OES.
| RF power | 1.20 kW |
| plasma Ar gas flow | 12.0 L/min |
| auxiliary Ar gas flow | 1.00 L/min |
| nebulizer gas flow | 0.7 L/min |
| stabilization time | 15 s |
The LODs will vary according to the element of interest. In the present conditions, the values are given in Table 3.
Table 3. Limits of Detection for the Elements Measured by ICP-OES.
| elements | LOD (ppm) |
|---|---|
| As | 3.7 |
| Ca | 0.02 |
| Co | 2.7 |
| Cr | 1.1 |
| Fe | 1.6 |
| K | 15 |
| Mn | 0.2 |
| Mo | 2.8 |
Acknowledgments
The technical assistance of the Analytical Core Lab staff at KAUST is appreciated. The authors thank the advice of Prof Jan Kucera and Dr Jan Kamenik. KAUST is acknowledged for funding (URF/1/2980-01-01).
Supporting Information Available
The Supporting Information is available free of charge on the ACS Publications website at DOI: 10.1021/acsomega.9b02664.
Additional characterization for the salt and carbon materials: SEM, EDXS, XRD, 11B MQMAS-NMR, and 7Li MQMAS-NMR (PDF)
The authors declare no competing financial interest.
Supplementary Material
References
- Kotlensky W. V.; Martens H. E. Tensile Properties of Glassy Carbon to 2900° C. Nature 1965, 206, 1246–1247. 10.1038/2061246a0. [DOI] [Google Scholar]
- Brownson D. A. C.; Banks C. E. Graphene electrochemistry: an overview of potential applications. Analyst 2010, 135, 2768–2778. 10.1039/c0an00590h. [DOI] [PubMed] [Google Scholar]
- Nowak S.; Winter M. Elemental analysis of lithium ion batteries. J. Anal. At. Spectrom. 2017, 32, 1833–1847. 10.1039/c7ja00073a. [DOI] [Google Scholar]
- Kameník J.; Simões F. R. F.; Costa P. M. F. J.; Kučera J.; Havránek V. INAA and ion-beam analysis of elemental admixtures in carbon-based nanomaterials for battery electrodes. J. Radioanal. Nucl. Chem. 2018, 318, 2463–2472. 10.1007/s10967-018-6200-y. [DOI] [Google Scholar]
- Simoes F. R. F.; Batra N. K.; Warsama B. H.; Canlas C. G.; Patole S.; Yapici T. F.; Costa P. M. Elemental Quantification and Residues Characterization of Wet Digested Certified and Commercial Carbon Materials. Anal. Chem. 2016, 88, 11783. 10.1021/acs.analchem.6b03407. [DOI] [PubMed] [Google Scholar]
- Mortari S. R.; Cocco C. R.; Bartz F. R.; Dresssler V. L.; Flores E. M. d. M. Fast Digestion Procedure for Determination of Catalyst Residues in La- and Ni-Based Carbon Nanotubes. Anal. Chem. 2010, 82, 4298–4303. 10.1021/ac100429v. [DOI] [PubMed] [Google Scholar]
- Patole S. P.; Simões F.; Yapici T. F.; Warsama B. H.; Anjum D. H.; Costa P. M. F. J. An evaluation of microwave-assisted fusion and microwave-assisted acid digestion methods for determining elemental impurities in carbon nanostructures using inductively coupled plasma optical emission spectrometry. Talanta 2016, 148, 94–100. 10.1016/j.talanta.2015.10.053. [DOI] [PubMed] [Google Scholar]
- Simoes F. R. F.; Batra N. M.; Emwas A.-H.; Costa P. M. F. J. Validation of alkaline oxidation as a pre-treatment method for elemental quantification in single-walled carbon nanotubes. Anal. Methods 2019, 11, 1884–1890. 10.1039/c8ay02213e. [DOI] [Google Scholar]
- Greenberg R. R.; Bode P.; De Nadai Fernandes E. A. Neutron activation analysis: A primary method of measurement. Spectrochim. Acta, Part B 2011, 66, 193–241. 10.1016/j.sab.2010.12.011. [DOI] [Google Scholar]
- Wong C. H. A.; Sofer Z.; Kubeova M.; Kuera J.; Matjkova S.; Pumera M. Synthetic routes contaminate graphene materials with a whole spectrum of unanticipated metallic elements. Proc. Natl. Acad. Sci. U.S.A. 2014, 111, 13774–13779. 10.1073/pnas.1413389111. [DOI] [PMC free article] [PubMed] [Google Scholar]
- Alazmi A.; El Tall O.; Rasul S.; Hedhili M. N.; Patole S. P.; Costa P. M. F. J. A process to enhance the specific surface area and capacitance of hydrothermally reduced graphene oxide. Nanoscale 2016, 8, 17782–17787. 10.1039/c6nr04426c. [DOI] [PubMed] [Google Scholar]
- Pumera M. The Electrochemistry of Carbon Nanotubes: Fundamentals and Applications. Chem.—Eur. J. 2009, 15, 4970–4978. 10.1002/chem.200900421. [DOI] [PubMed] [Google Scholar]
- Guo J.; Wang J.; Xuan C.; Wu Z.; Lei W.; Zhu J.; Xiao W.; Wang D. Molybdenum carbides embedded on carbon nanotubes for efficient hydrogen evolution reaction. J. Electroanal. Chem. 2017, 801, 7–13. 10.1016/j.jelechem.2017.07.020. [DOI] [Google Scholar]
- Zhou K.; Zhou W.; Liu X.; Sang Y.; Ji S.; Li W.; Lu J.; Li L.; Niu W.; Liu H.; Chen S. Ultrathin MoO 3 nanocrystalsself-assembled on graphene nanosheets via oxygen bonding as supercapacitor electrodes of high capacitance and long cycle life. Nano Energy 2015, 12, 510–520. 10.1016/j.nanoen.2015.01.017. [DOI] [Google Scholar]
- Stuart E. J. E.; Pumera M. Impurities within carbon nanotubes govern the electrochemical oxidation of substituted hydrazines. Phys. Chem. Chem. Phys. 2011, 13, 10818–10822. 10.1039/c1cp20176j. [DOI] [PubMed] [Google Scholar]
- Pumera M.; Miyahara Y. What amount of metallic impurities in carbon nanotubes is small enough not to dominate their redox properties?. Nanoscale 2009, 1, 260–265. 10.1039/b9nr00071b. [DOI] [PubMed] [Google Scholar]
- Wang L.; Chua C. K.; Khezri B.; Webster R. D.; Pumera M. Remarkable electrochemical properties of electrochemically reduced graphene oxide towards oxygen reduction reaction are caused by residual metal-based impurities. Electrochem. Commun. 2016, 62, 17–20. 10.1016/j.elecom.2015.10.020. [DOI] [Google Scholar]
- Pumera M.; Iwai H. Metallic ImpuritieswithinResidual Catalyst Metallic Nanoparticles Are in Some Cases Responsible for ″Electrocatalytic″ Effect of Carbon Nanotubes. Chem.—Asian J. 2009, 4, 554–560. 10.1002/asia.200800420. [DOI] [PubMed] [Google Scholar]
- Pumera M.; Ambrosi A.; Chng E. L. K. Impurities in graphenes and carbon nanotubes and their influence on the redox properties. Chem. Sci. 2012, 3, 3347–3355. 10.1039/c2sc21374e. [DOI] [Google Scholar]
- Mazánek V.; Luxa J.; Matějková S.; Kučera J.; Sedmidubský D.; Pumera M.; Sofer Z. Ultrapure Graphene Is a Poor Electrocatalyst: Definitive Proof of the Key Role of Metallic Impurities in Graphene-Based Electrocatalysis. ACS Nano 2019, 13, 1574–1582. 10.1021/acsnano.8b07534. [DOI] [PubMed] [Google Scholar]
- Resasco D.; Silvy R.; Nanotechnologies S.. Structure and Applications of Single-Walled Carbon Nanotubes (SWCNTs) Synthesized Using the CoMoCAT Method; Sigma-Aldrich: Norman, OK, 2011. [Google Scholar]
- Ananthanarayanan A.; Kothiyal G. P.; Montagne L.; Revel B. MAS-NMR investigations of the crystallization behaviour of lithium aluminum silicate (LAS) glasses containing P2O5 and TiO2 nucleants. J. Solid State Chem. 2010, 183, 1416–1422. 10.1016/j.jssc.2010.04.011. [DOI] [Google Scholar]
- Angeli F.; Villain O.; Schuller S.; Charpentier T.; de Ligny D.; Bressel L.; Wondraczek L. Effect of temperature and thermal history on borosilicate glass structure. Phys. Rev. B: Condens. Matter Mater. Phys. 2012, 85, 054110. 10.1103/physrevb.85.054110. [DOI] [Google Scholar]
- Chen B.; Werner-Zwanziger U.; Nascimento M. L. F.; Ghussn L.; Zanotto E. D.; Zwanziger J. W. Structural Similarity on Multiple Length Scales and Its Relation to Devitrification Mechanism: A Solid-State NMR Study of Alkali Diborate Glasses and Crystals. J. Phys. Chem. C 2009, 113, 20725–20732. 10.1021/jp907259e. [DOI] [Google Scholar]
- Loubser M.Chemical and physical aspects of lithium borate fusion; CiteSeer, 2009. [Google Scholar]
- Lelong G.; Radtke G.; Cormier L.; Bricha H.; Rueff J.-P.; Ablett J. M.; Cabaret D.; Gélébart F.; Shukla A. Detecting Non-bridging Oxygens: Non-Resonant Inelastic X-ray Scattering in Crystalline Lithium Borates. Inorg. Chem. 2014, 53, 10903–10908. 10.1021/ic501730q. [DOI] [PubMed] [Google Scholar]
- Lelong G.; Cormier L.; Hennet L.; Michel F.; Rueff J.-P.; Ablett J. M.; Monaco G. Lithium borate crystals and glasses: How similar are they? A non-resonant inelastic X-ray scattering study around the B and O K -edges. J. Non-Cryst. Solids 2017, 472, 1–8. 10.1016/j.jnoncrysol.2017.06.012. [DOI] [Google Scholar]
- Michaelis V. K.; Levin K.; Germanov Y.; Lelong G.; Kroeker S. Ultrahigh-Resolution 7Li Magic-Angle Spinning Nuclear Magnetic Resonance Spectroscopy by Isotopic Dilution. Chem. Mater. 2018, 30, 5521–5526. 10.1021/acs.chemmater.8b01626. [DOI] [Google Scholar]
- Darmstadt H.; Roy C.; Kaliaguine S.; Xu G.; Auger M.; Tuel A.; Ramaswamy V. Solid state 13C-NMR spectroscopy and XRD studies of commercial and pyrolytic carbon blacks. Carbon 2000, 38, 1279–1287. 10.1016/s0008-6223(99)00259-6. [DOI] [Google Scholar]
- Hung W.-C.; Wang J.-C.; Wu K.-H. Adsorption and decomposition of dimethyl methylphosphonate (DMMP) on expanded graphite/metal oxides. Appl. Surf. Sci. 2018, 444, 330–335. 10.1016/j.apsusc.2018.03.082. [DOI] [Google Scholar]
- Abou-Hamad E.; Babaa M. R.; Bouhrara M.; Kim Y.; Saih Y.; Dennler S.; Mauri F.; Basset J. M.; Goze-Bac C.; Wågberg T. Structural properties of carbon nanotubes derived from 13C NMR. Phys. Rev. B: Condens. Matter Mater. Phys. 2011, 84, 165417. 10.1103/physrevb.84.165417. [DOI] [Google Scholar]
- Goze-Bac C.; Latil S.; Lauginie P.; Jourdain V.; Conard J.; Duclaux L.; Rubio A.; Bernier P. Magnetic interactions in carbon nanostructures. Carbon 2002, 40, 1825–1842. 10.1016/s0008-6223(02)00061-1. [DOI] [Google Scholar]
- Stadie N. P.; Billeter E.; Piveteau L.; Kravchyk K. V.; Döbeli M.; Kovalenko M. V. Direct Synthesis of Bulk Boron-Doped Graphitic Carbon. Chem. Mater. 2017, 29, 3211–3218. 10.1021/acs.chemmater.7b00376. [DOI] [Google Scholar]
- Goze Bac C.; Bernier P.; Latil S.; Jourdain V.; Rubio A.; Jhang S. H.; Lee S. W.; Park Y. W.; Holzinger M.; Hirsch A. 13C NMR investigation of carbon nanotubes and derivatives. Curr. Appl. Phys. 2001, 1, 149–155. 10.1016/s1567-1739(01)00009-8. [DOI] [Google Scholar]
- Tomaselli M.; Meier B. H.; Riccò M.; Shiroka T.; Sartori A. NMR evidence for sp3 carbon in the low-temperature phase of LixC60. Phys. Rev. B: Condens. Matter Mater. Phys. 2001, 63, 113405. 10.1103/physrevb.63.113405. [DOI] [Google Scholar]
Associated Data
This section collects any data citations, data availability statements, or supplementary materials included in this article.