

Abstract

B3LYP calculations were carried out to study the insertion of iridium (Ir) and rhodium (Rh) clusters into a C–H bond of ethane, which is often the rate-limiting step of the catalytic cycle of oxidative dehydrogenation of ethane. Our previous research on Ir catalysis correlates the diffusivity of the lowest unoccupied molecular orbital of the Ir clusters and the relative activities of the various catalytic sites. The drawback of this research is that the molecular orbital visualization is qualitative rather than quantitative. Therefore, in this study on C–H bond activation by the Ir and Rh clusters, we conducted analyses of natural bond orbital (NBO) charges and Wiberg bond indexes (WBIs), both of which are not only quantitative but also independent of the basis sets. We found strong correlation between the NBO charges, the WBIs, and the relative activities of the various catalytic sites on the Ir and Rh clusters. Analyses of the NBO charges and the WBIs provide a fast and reliable means of prescreening the most active sites on the Ir and Rh clusters and potentially on other similar transition-metal clusters that activate the C–H bonds of ethane and other light alkanes.
Introduction
Catalyzed dehydrogenation of alkanes is an important petroleum industrial process. Approximately 134 million tons of ethene (ethylene) and 94 million tons of propene (propylene) were produced in 2014.1,2 These numbers are expected to increase continuously as the consumption of ethene and propene is expected to increase continuously. Consequently, transition-metal (TM) catalysts used for the dehydrogenation of ethane and other light alkanes have been extensively studied both experimentally and theoretically.3−29 The energy consumption for converting alkanes to alkenes is tremendous because it takes more than 400 kJ/mol of energy to break a C–H bond. Although the traditional vanadium oxide catalysts can reduce the energy barrier of the oxidative dehydrogenation (ODH) of alkanes to 100–200 kJ/mol,5,27−29 a high-temperature environment is still required to provide enough thermal energy for this catalyzed reaction. More effective TM catalysts are desirable for the mass production of ethene and propene at a lower energy cost.
Recently, platinum (Pt) atomic clusters were found to have an extraordinary ability to break C–H bonds at lower temperatures by reducing the energy barrier to ∼20 kJ/mol, both in the gas phase and on a metal oxide surface.6,7 This is a breakthrough toward the catalysis of the ODH of alkanes. However, Pt clusters can easily coalesce in the gas phase and lose their catalytic activity. When they are supported by a metal oxide surface, coalescence may still occur at high reaction temperatures.30,31 Similar catalytic abilities and shortcomings are observed for several other TM clusters. Iridium (Ir), rhodium (Rh), and palladium (Pd) atomic clusters have shown tremendous potential toward activating the C–H bonds of ethane and propane, both in the gas phase and on metal oxide surfaces.12−19 However, studies also show that small TM clusters such as Ir3 migrate easily on metal oxide surfaces.32 Apart from enhancing the catalytic ability of these TM clusters, preventing their migration, coalescence, and deactivation are equally important. One strategy we proposed in a previous study was to find catalytically active Ir clusters with large enough surfaces that can bond strongly to their support to hinder migration.16
In our previous research,16 the ODH of ethane and propane catalyzed by the Ir8, Ir12, and Ir18 atomic clusters was investigated. The reaction cycle of the Ir cluster-catalyzed ODH of ethane involves five steps, as shown in Figure 1: first, C2H6 approaches an Irn cluster to form the Irn···C2H6 reactant complex. Second, the Irn cluster enters a C–H bond of ethane and forms H–Irn–C2H5. This was found to be the rate-limiting step. Third, the Irn cluster enters a second C–H bond and forms (H)2–Irn–C2H4, in which ethylene is formed and bonded to Irn. The formation of the C–C π bond facilitates the second H elimination. Fourth, O2 is adsorbed on the Irn surface and decomposed into two O atoms, each bonded to the Irn cluster. The H atoms migrate on the Ir cluster until encountering an O atom. O–H bonds and eventually H2O are formed and heat is released. Fifth, water and ethylene are evaporated from the Irn surface assisted by the heat released from the formation of the O–H bonds.
Figure 1.

Reaction cycle of the Irn cluster-catalyzed ODH of ethane.
We had chosen Ir8, Ir12, and Ir18 atomic clusters to model this catalytic cycle for two reasons:16 first, CCSD(T) and density functional theory (DFT) calculations predicted that the global minimum structures of these Ir atomic clusters adopt a cubic or cuboid shape.33,34 These predictions provided a starting point for us to focus on the modeling of these cubic/cuboid structures of Ir clusters and their activities toward ethane and propane. Second, these cubic or cuboid structures may have up to half of the Ir atoms (4, 6, or 9) bonded to a supporting surface, which may reduce their chances of migrating on the surfaces compared with the much smaller Ir clusters such as Ir3.32
It was straightforward to study the insertion of Ir8 clusters into a C–H bond of ethane because all Ir atoms are identical in the Ir8 cube. There are, however, two types of atoms in the 3 cube. 2 cuboid structure of Ir12: eight atoms on the corner sites and four on the edges. In the 3 × 3 × 2 cuboid structure of Ir18, there are corner, edge, and face center sites. In total, we studied six different reaction paths of Irn (n = 8, 12, and 18) interacting with ethane on various catalytic sites.16 The six corresponding transition-state (TS) structures are illustrated in Figure 2. Because of the many nearly degenerate electronic structures of the Irn clusters, we computed each reaction path in at least seven electronic states with the electron spin quantum number (S) ranging from 0 to 6. The reaction path with the lowest energy barrier was then used to characterize the activity of the cluster size and the catalytic site of interest.16 We found that the catalytic ability of the Ir clusters depends both on the cluster size and on the catalytic site. The corner sites of Ir18 (ΔH⧧ = 3 kJ/mol) are more active than the corner sites of Ir12 (ΔH⧧ = 21 kJ/mol) and Ir8 (ΔH⧧ = 65 kJ/mol). Because the Mulliken analysis suggests that electrons flow from ethane to the Irn cluster in the Irn + C2H6 → H–Irn–C2H5 reaction, we conjectured that larger Ir clusters disperse the negative charge better than the smaller ones and thus stabilize the TS. The molecular orbital (MO) visualization shows that the lowest unoccupied MOs (LUMOs) are more diffuse at the corner sites and thereby more readily accept the C–H bonding electrons. The LUMOs are tighter at the edge sites and the tightest at the face center sites. Consequently, the corner sites are more active than the edge sites, which are in turn more active than the face center sites. For example, the enthalpy of activation (ΔH⧧) of Ir18 + C2H6 → H–Ir18–C2H5 is 3, 48, or 71 kJ/mol at the corner, edge, or face center site, respectively.
Figure 2.

Previously studied TS structures of Irn + C2H6 → H–Irn–C2H5 reaction taking place at the corner, edge, and/or face center sites of the Ir8, Ir12, Ir18 cubic, or cuboid structures with the electron spin quantum number S ranging from 0 to 6.
The Mulliken analysis and the visualization of MOs supported our explanation of the size and site effects on the catalytic abilities of Ir clusters.16 However, these two means are rather qualitative and dependent on the basis sets. The MO visualization also depends on the isovalues chosen for the MO graphing. Therefore, quantitative indicators that are independent of basis sets, such as natural bond orbital (NBO) charges35,36 and Wiberg bond indexes (WBIs),37−39 are desirable for predicting the activity of the various catalytic sites.
In this paper, we conducted the NBO charge and WBI analyses for the previously studied Ir clusters. We then extended these analyses to the Rhn clusters that catalyze the dehydrogenation of ethane. Rh and Ir are both group 9 TM elements. Rh is in the fifth period and Ir is in the sixth. Because of the lanthanide contraction, Rh and Ir have a similar atomic radius (∼1.34 Å vs ∼1.36 Å). However, Rh and Ir clusters may behave differently in their reactions with ethane because the Rh and Ir atoms have different electronic structures. The Rh atom has a [36Kr]4d85s1 electronic configuration, notably different from the [54Xe]4f145d76s2 configuration of Ir in the numbers of the valence d and s electrons. Finding the lowest-energy structures of the Rh clusters becomes the first considerable challenge before we can study their catalytic behaviors. The results of the global optimization heavily depend on the computational methods used to model the Rh clusters. For example, Lecours et al.40 searched for the global minimum structures of Rhn+1+ and RhnS+ using the Perdew–Burke–Ernzerhof (PBE)41 and PBE042 generalized gradient approximation (GGA) method. The PBE pure GGA calculations suggest a cubic lowest-energy structure for Rh8+ with an electron spin number (S) of 8, whereas the PBE0 hybrid GGA calculations suggest a bicapped octahedron structure with a C2v point group and S = 14.40 The PBE0 results differ from the PBE results drastically for other Rh species as well.40 Which method, or which category of the DFT methods (e.g., hybrid vs pure GGA), is more accurate for modeling the Rh clusters? This question prompted us to assess the accuracy of various DFT methods in the next section before eventually choosing the B3LYP hybrid GGA method for the study of the Rh clusters and their interaction with ethane.
Other than the method selection, there is another issue that hinders a comprehensive study of the catalytic activities of the Rh clusters. Unlike the previous Ir study16 in which we knew Ir18 prefers a cuboid structure that contains only three different catalytic sites, the Rh18 clusters may adopt less symmetrical structures, each with a larger number of unique catalytic sites. This poses a grave challenge in the study of the Rh18 clusters as we learned that the catalytic activity of a TM cluster may heavily depend on the reaction site.16Figure 3 illustrates how complicated the study on Rh catalysis can be. We need to study various cluster sizes. For each size, we need to find the lowest energy structures, including their electron spin quantum numbers. We then need to study all different catalytic sites for each of these lowest-energy structures—this task is much more daunting for many other less symmetrical atomic structures of the larger Rh clusters. A fast and reliable method of prescreening the various catalytic sites is desirable to make a comprehensive study on Rh catalysis feasible.
Figure 3.

Flow chart of a comprehensive modeling of the Rhn + C2H6 → H–Rhn–C2H5 reaction.
In this paper, we first carried out the NBO35,36 calculations for the Ir8, Ir12, and Ir18 clusters. The NBO charges correlate strongly with the activities of the various catalytic sites. Equally, or even more strongly than the NBO charges, the WBIs37−39 of the Ir atoms at different sites correlate with their activities toward the dehydrogenation of ethane. We then extended these analyses to similar Rh clusters and found similar correlations. These findings may result in a fast and reliable means of prescreening the catalytic sites of the Irn and Rhn clusters and potentially other similar TM clusters that activate the C–H bonds of alkanes.
In the next section, we introduce the computational methods chosen for this study and justify our choice. In the Results and Discussion section, we present the strong correlations between the NBO charges, the WBIs, and the catalytic ability of the various sites on the Ir and Rh clusters. Concluding remarks are given at the end.
Computational Methods
The B3LYP hybrid GGA method43−45 implemented in Gaussian 0946 was used in this study. The D3 empirical dispersion formulated by Grimme with Becke–Johnson damping47 (D3BJ) was included in all calculations. In the geometry optimization and vibrational frequency calculations, polarized double-ζ (DZ) basis sets were used. The LANL2DZ basis set and the LANL2 effective core potential,48 augmented with f-type polarization functions,49 were employed on the Rh atoms. The 6-31G(d) basis sets were employed on the C, H, and O atoms.50,51 This computing scheme is similar to Liu et al.’s calculations on the functionalization of C–H bonds,52 Yang et al.’s calculations on the C–H activation by Rh complexes,53 and Karmel et al.’s calculations on the Rh-catalyzed silylation of alkyl C–H bonds.54 The only difference is that we also included the f-type polarization functions on the Rh atoms for enhanced accuracy. Similarly, Sundermann et al. studied C–C and C–H activation by Rh complexes using the B3LYP/LANL2DZ+p method.55 DeAngelis et al. studied the Rh-complex-catalyzed C–H functionalization of indoles using B3LYP calculations with the 6-311G(d,p) basis sets on main group elements and LANL2DZ on Rh.56 In a recent article on the assessment of DFT studies of Rh-mediated chemical transformations, the inclusion of the D3 empirical dispersion is shown to be important.57 While PBE0 and MPWB1K-D3 are found to be the most accurate methods for the test cases used in this article,57 the B3LYP-D3 method is reasonably accurate and clearly outperform B3LYP. Our choice of the B3LYP-D3BJ method was partially justified by these previous studies on the Rh-containing systems.
In addition to the literature review, we assessed several categories of the DFT methods before eventually choosing the B3LYP hybrid GGA method for this study. Figure 4 shows the comparison between eight popular DFT methods—all coupled with the D3BJ empirical dispersion—against the CCSD(T, full) benchmark calculations of the bond energies of small Rh species. The assessed DFT methods include the double-hybrid B2PLYP58 with HF exchange and MP2-type correlation (purple color), the B3LYP,43−45 B3PW91,43,59−62 and PBE042 hybrid GGA methods with HF exchange (red color), the BLYP,44,63 BPW91,59,60,63 and PBE41 pure GGA methods (green color), and the SVWN64−67 local method (black color). The B3LYP, B3PW91, and PBE0 hybrid GGA methods differ from the BLYP, BPW91, PBE pure GGA method mainly in their inclusion of 20% (B3) or 25% (PBE0) Hartree–Fock exchange energy. The bond energies of 16 Rh species, 1RhH, 3RhH, 5RhH, 2RhC, 4RhC, 2RhO, 4RhO, 1Rh2, 3Rh2, 5Rh2, 1RhCH3, 3RhCH3, 5RhCH3, 1RhOH, 3RhOH, and 5RhOH, were calculated. The numeric superscripts in front of these formulas are the spin multiplicities (M = 2S + 1), where S is the electron spin quantum number. The triple-ζ (TZ) LANL2TZ(f) basis set on the Rh atoms48,49,68 and the 6-311G(d,p) basis sets on the light atoms69 were used consistently in the DFT and CCSD(T, full) calculations. Figure 4 shows that the double-hybrid B2PLYP method and the hybrid GGA methods clearly outperform the pure GGA methods and the local SVWN method. Practical consideration of the limited computing resources ruled out the double-hybrid B2PLYP method because computing the MP2-type correlation is prohibitively expensive for larger Rh clusters. Our earlier research on the Irn-catalyzed dehydrogenation of ethane and propane19 also justified the choice of using the B3LYP hybrid GGA method for this study.
Figure 4.

Rh–X (X = H, C, O, and Rh) bond energies of small Rh species: the DFT results vs the benchmark CCSD(T, full) results. The four categories of the double-hybrid, hybrid GGA, pure GGA, and local DFT calculations are colored purple, red, green, and blue, respectively. The benchmark is in black color. Species 1–16 are 1RhH, 3RhH, 5RhH, 2RhC, 4RhC, 2RhO, 4RhO, 1Rh2, 3Rh2, 5Rh2, 1RhCH3, 3RhCH3, 5RhCH3, 1RhOH, 3RhOH, and 5RhOH, respectively.
The B3LYP-D3BJ frequency calculations ensured that all local minima have zero imaginary frequencies, whereas all TS structures have one imaginary frequency. Intrinsic reaction coordinate calculations were carried out to ensure that each TS connects the desired reactant (i.e., the Rhn···C2H6 reactant complex) and product (i.e., H–Rhn–C2H5) via the minimum energy path of the imaginary frequency. To further improve the accuracy of the thermochemistry of the Rhn-activated C–H bond cleavage of ethane, single-point energies were calculated using polarized TZ basis sets. The LANL2TZ(f) basis set48,49,68 was employed on the Rh atoms and the 6-311G(d,p) basis sets on the light atoms.69 The NBO charges and the WBIs were obtained via using the same computational schemes. The NBO analysis was carried out using version 3.1 of the NBO program70 implemented in Gaussian 09.46
Results and Discussion
Two mechanisms account for inserting a TM atom into a C–H bond: (1) the C–H bonding electrons flow into empty d orbitals of the TM atom. (2) The d-electrons of the TM atom flow into the empty σ* C–H antibonding orbital. The Mulliken charge analysis showed that the first mechanism accounts for the Ir-activated C–H bond breaking.16 However, this is not conclusive as the Mulliken population analysis depends heavily on the basis sets.71−73 Therefore, in this paper, we computed the NBO charges, which are generally independent of the basis sets.72,73 The NBO charge analysis agrees with the previous Mulliken charge analysis that C–H bonding electrons flow into the partially empty d orbitals of the Ir clusters. In the previous research, we found that the LUMO of the Irn clusters are much more diffuse on the corner sites and thus better overlap with the C–H σ bonding orbital.16 In this study, we observed similar shapes of the LUMOs of the Rh clusters: The part of the LUMO around the corner site of Rh18 appears more diffuse than that around the edge and face center sites. As a result, the corner sites are the most active: the enthalpies of activation (ΔH⧧) of Rh18 + C2H6 → H–Rh18–C2H5 are 0, 20, and 32 kJ/mol on the corner, edge, and face center site, respectively. The zero ΔH⧧ at the corner site is due to the fortuitous and complete cancellation between the enthalpy decrease in the formation of the Rh18···C2H6 reactant complex and the enthalpy increase in the formation of TS from the reactant complex. This trend of the Rh18 catalysis is similar to that of the Ir18 catalysis: ΔH⧧ = 3, 48, and 71 kJ/mol on the corner, edge, and face center sites, respectively, as Ir18 enters a C–H bond of ethane.16 The prominent site effects of the Rh and Ir catalysis can be explained by the MO visualization. The drawbacks of the MO visualization are, however, that the shapes of the MOs depend on the isovalues chosen for graphing and that the MO visualization is rather qualitative. Therefore, in addition to the MO visualization, we studied the correlations between the TS energy (in atomic unit or au) of the TMn + C2H6 → H–TMn–C2H5 reactions and two quantitative indicators: NBO charges and WBIs on the corner, edge, and face center sites. The TS energy is a quantitative indicator of the catalytic activity: the more negative the TS energy is, the more active the TM cluster is. Figures 5–8 show the strong correlations between the NBO charges, the WBIs, and the activities of the various catalytic sites of Ir and Rh clusters.
Figure 5.

(a–g) Electron spin S = 0–6: Correlation between the TS energy of the Ir18 + C2H6 → H–Ir18–C2H5 reaction and the NBO charges of the face center, edge, and corner (from left to right) catalytic sites of Ir18. (h) NBO charges of the three catalytic sites of Ir18 (S = 0–6).
Figure 8.

(a–g) Electron spin S = 0–6: Correlation between the TS energy of the Rh18 + C2H6 → H–Rh18–C2H5 reaction and the WBIs of the corner, edge, and face center (from left to right) catalytic sites of Rh18. (h) WBIs of the three catalytic sites of Rh18 (S = 0–6).
The NBO charges of the various catalytic sites of Ir18 correlate strongly with their activities toward the C–H bonds of ethane. Figure 5a–g shows that the TS energy for the Ir18 + C2H6 → H–Ir18–C2H5 reaction occurring at the corner, edge, and face center sites is linear to the NBO charges on these sites. This nearly perfect linear correlation is observed for each of the seven electron spin quantum number (S = 0–6). The R2 values (a.k.a., coefficient of determination) range from 0.873 (S = 5) to 0.999 (S = 0) with an average of 0.960. Figure 5h clearly shows that, regardless of the electron spin, the corner sites are consistently positively charged, while the edge and face center sites are consistently negatively charged. The positive charge on the corner sites makes it easier for the electrons to flow from the C–H bonding orbital to the Ir clusters. For the seven reaction paths each with a different electron spin number S from 0 to 6, the spin-averaged NBO charges of the corner, edge, and face center sites of the free Ir18 cluster are 0.10 ± 0.01, −0.07 ± 0.01, and −0.12 ± 0.01, respectively. The spin-averaged NBO charges on these sites become −0.26 ± 0.01, −0.39 ± 0.03, and −0.45 ± 0.01 in the corresponding TS structures. The net changes of the NBO charge of the Ir atoms are −0.36, −0.32, and −0.33. The NBO charge analysis confirms that electrons flow from the C–H σ bonding orbital to the activating Ir atom, and the positively charged Ir atoms at the corner sites accept the electron more readily.
In addition to the NBO charges, the WBIs of the corner, edge, and face center atoms are also strong indicators of their ability to enter a C–H bond. Herein, the WBI of a catalytic site (or a TM atom) refers to the sum of the WBI values of all the links of the site (or atom), unless specified otherwise. Figure 6a–g shows a clear trend: The lower the WBI of the catalytic site, the lower the corresponding TS energy, and thus the more active the site. The R2 values range from 0.791 (S = 4) to 1.000 (S = 2) with an average of 0.959. Figure 6h shows that the corner site has consistently lower WBI than the edge and face center sites, which suggests that the corner Ir atoms are the least coordinated in the Ir18 cuboid structures. Because of their severe undercoordination, the corner sites are more likely electron-deficient and therefore more likely to accept electrons from the C–H bonding orbital of ethane. Figures 5 and 6 show that, prior to finding the TS structures, we can rank the activities of the corner, edge, and face center site, quantitatively, solely based on the NBO charges and WBI of these sites in the Irn clusters. This could have saved tremendous amount of computing time in the study of Ir catalysis. For example, the efficiency of finding the lowest-energy path of Ir18-catalyzed dehydrogenation of ethane would have increased 3-fold, had we known that the most positively charged corner sites with the lowest WBIs would be the most active sites and thus omitted the edge and face center sites.
Figure 6.

(a–g) Electron spin S = 0–6: Correlation between the TS energy of the Ir18 + C2H6 → H–Ir18–C2H5 reaction and the WBIs of the corner, edge, and face center (from left to right) catalytic sites of Ir18. (h) WBIs of the three catalytic sites of Ir18 (S = 0–6).
Besides the WBIs of the catalytic sites, the WBIs of the Ir–C partial bond in the TS structure also strongly correlate with the TS energy. The greater the Ir–C WBI, the lower the TS energy. The Ir–C WBI serves as another useful indicator of the catalytic activity. Its value can be determined, however, only after the TS structure is optimized. In contrast, the WBIs of the catalytic sites on the Ir atomic clusters can serve as a prescreening tool before the TS structure is obtained. Similarly, the Rh–C WBIs correlate well with the corresponding TS energies (with one exception when S = 1) but cannot serve as a prescreening tool like the WBIs of the sites on the Rh atomic clusters. For more detail, the 14 plots of TS energy versus the Ir–C (or Rh–C) WBI for Ir18 and Rh18 (S = 0–6) are included in Appendix E of the Supporting Information.
We then extended the NBO charge analysis to the Rh18 clusters. The correlation between the NBO charges on the corner, edge, and face center sites and the TS energies of Rh18 is weaker than Ir18 but still quite prominent (Figure 7). The R2 values range from 0.529 (S = 1) to 0.999 (S = 2) with an average value of 0.763. The weaker correlation mainly results from the TS energy of the edge site being slightly higher (instead of lower) than that of the face center site, when S = 0, 1, or 3. However, the corner site consistently has the most positive NBO charge and the lowest TS energy, which makes the NBO charge of the free Rhn cluster a useful indicator for finding the most active sites. The NBO charges of the corner, edge, and face center sites of the free Rh18 cluster are 0.13 ± 0.02, −0.05 ± 0.01, and −0.29 ± 0.05. The NBO charges on the corresponding sites become −0.22 ± 0.01, −0.35 ± 0.03, and −0.61 ± 0.01 in the TS structures. The net changes of the NBO charge of the Rh atoms are −0.35, −0.30, and −0.32 as the Rh atoms at the corner, edge, and face center sites enter a C–H bond of ethane. Similar to the Ir18 analysis, we found that electrons flow from the C–H σ bonding orbital to the activating Rh atom and that the positively charged Rh atoms at the corner sites accept the electron more readily. This explains why the corner sites weaken the C–H bonds of ethane more efficiently than the edge and face center sites.
Figure 7.

(a–g) Electron spin S = 0–6: Correlation between the TS energy of the Rh18 + C2H6 → H–Rh18–C2H5 reaction and the NBO charges of the face center, edge, and corner (from left to right) catalytic sites of Rh18. (h) NBO charges of the three catalytic sites of Rh18 (S = 0–6).
Figure 8a–g shows that the WBIs act as a slightly better indicator than the NBO charges for the Rh18 case. The R2 values range from 0.630 (S = 3) to 1.000 (S = 5) with an average of 0.813. Although exceptions to the linear relationships were found for the S = 0, S = 1, and S = 3 cases, the corner sites have the lowest WBIs and also the lowest TS energies consistently for each spin (S = 0–6). Figure 8h shows that the corner sites always have the lowest WBIs, followed by the edge and face center sites, in that order. As anticipated, the most severely undercoordinated corner sites interact with the C–H bonds more strongly, which lowers the TS energy of the reaction taking place on the corner site. Collectively, Figures 5–8 suggest that the NBO and WBI analyses are excellent prescreening tools for ranking the catalytic sites in both Ir18 and Rh18. The corner sites always have the most positive NBO charges, the lowest WBIs, and the strongest activities toward the C–H bonds of ethane.
How do the NBO and WBI analyses work for the Ir and Rh clusters with a different size such as Ir12 and Rh12? Because the Ir12 and Rh12 clusters have only two different sites (corner and edge), we pooled the correlations (S = 0–6) between the NBO charges and the TS energy of Ir12 in Figure 9a and that of Rh12 in Figure 9b. Figure 9a for Ir12 exhibits similar “TS energy versus NBO charge” slopes for all seven electron spin numbers from 0 to 6. The correlation for Rh12 is also prominent but weaker than Ir12 especially for the S = 0 case, in which the edge site with a negative NBO charge has lower (instead of higher) TS energy than the corner site with a positive charge. Figure 9c,d shows that a lower WBI is still an excellent indicator of the stronger catalytic ability for the Ir12 clusters for each electron spin. There is again an exception (S = 0) for the Rh12 case, but overall, the WBI correlates strongly with the catalytic ability of the corner and edge sites of Rh12. In summary, Figures 5–9 suggest that the NBO charge and WBI analyses rank the catalytic sites accurately for both Ir and Rh clusters with various sizes. However, will this high level of accuracy change when different basis sets are used in the calculations?
Figure 9.

(a,b) Correlation between the TS energy of TM12 + C2H6 → H–TM12–C2H5 (TM = Ir and Rh) and the NBO charges of the corner and edge catalytic sites (S = 0–6). (c,d) Correlation between the TS energy and the WBIs at the corner and edge catalytic sites of the Ir12 and Rh12 cuboid structures. Enclosed in the ellipses are the corner site data.
It is well known that Mulliken charges heavily depend on the basis sets,71−73 whereas NBO charges do not.72,73 We compared the NBO charges of the corner, edge, and face center sites of the Ir and Rh clusters using two different basis sets: the DZ basis sets and the TZ basis sets, both described in the Computational Methods section. The Ir8 plot is not displayed as each atom in cubic Ir8 has a zero NBO charge because of its high symmetry. Figure 10 shows that the NBO charges on the Ir clusters are virtually independent of the basis set. The TZ charges are 0.95–0.98 times the DZ charges for the Irn (n = 12 or 18) clusters with a R2 value of 1. Similarly, the NBO charges are independent of the basis sets for the Rhn (n = 12 or 18) clusters. Figure 10 shows that the TZ charges are 1.00–1.02 times the DZ charges with a R2 value of 1. In short, the NBO charge analyses of Ir and Rh clusters are basis set-independent.
Figure 10.

DZ vs TZ NBO charges of the atoms in the TM18 and TM12 (TM = Ir and Rh) with the electron spin quantum number S ranging from 0 to 6.
For comparison, we also examined the DZ and TZ Mulliken charges on the Ir18 and Rh18 clusters and saw dramatic differences. For example, the DZ Mulliken charges on the face center sites of Ir18 are significantly positive ranging from 0.60 to 0.66, while the corresponding TZ charges are slightly negative ranging from −0.12 to −0.04. The discrepancies between the DZ and TZ Mulliken charges at the face center sites of the Ir and Rh clusters are even more significant than many other example systems (e.g., CO) used to demonstrate the basis set dependence of the Mulliken charges.71−73 While the TZ Mulliken charges are not too far from the size-independent NBO charges, the DZ Mulliken charges are completely different. Similar patterns were observed for Rh18. The DZ Mulliken charges on the face center sites of Rh18 range from 0.55 to 0.56, while the corresponding TZ Mulliken charges range from −0.17 to 0.04. The DZ and TZ Mulliken charges disagree notably on the corner and edge sites as well. For more detail, the plots of DZ versus TZ Mulliken charges are included in Appendix F of the Supporting Information. The significant dependence on the basis sets renders the Mulliken population analysis much less reliable than the NBO charge analysis and thus should be carried out with caution. In our previous research, the change of the TZ Mulliken charge when Ir inserts into C–H bond was used to determine the direction of the electron flow.16 The shape of the LUMO on the Ir18 cluster was used to explain the site effect.16 In this work, the NBO charge analysis of the Ir18 (or Rh18) atomic clusters is not only independent of the basis set but can also potentially predict the site effect before the TS structures are optimized. In addition, Figures 5 and 7 demonstrate quantitatively a strong correlation between the NBO charges on the Ir or Rh atomic clusters and the TS energy. The quantitative analyses of the NBO charges and WBIs agree with and complement the visualization of LUMO of the TM clusters,16 the latter being qualitative and slightly dependent on the isovalue chosen for plotting the MOs.
How do the WBIs depend on the basis set? Not much either, as shown by Figure 11. Compared with the overlap population analysis, the WBI analysis is much less dependent on the basis sets and correlate much better with the bond strength. The WBIs also have clearer physical interpretations as they agree with the bond orders predicted by valence bond theory.38,39 We computed the WBIs of the corner, edge, and face center sites on the Ir and Rh clusters. Figure 11 shows that the WBIs of the Ir and Rh atoms are virtually independent of the basis sets. The TZ WBIs matches with the DZ WBIs for all cases with a R2 value of ∼1.00 for the Ir clusters with S = 0–6; similar patterns were observed for the Rh clusters. The intercepts are not exactly zeroes but fairly small. The Ir8 plot clearly shows that WBI indexes strongly depend on the electron spin. The seven data points from the top right to the bottom left in the Ir8 plot are associated with electron spin (S) from 0 to 6, in that order. The higher the spin number (or more unpaired electrons), the lower the WBI, and vice versa. This suggests that more Ir–Ir bonds are formed when more electrons are paired. However, lower-spin clusters with higher WBIs do not always have lower energies because of their less negative exchange energies. The relative magnitudes of the bonding energies and the exchange energies are hardly predictable, which makes it difficult to globally optimize the Ir or Rh clusters and their catalytic abilities. Fortunately, Figures 10 and 11 suggest that the NBO charges and WBIs of the Ir and Rh clusters are independent of the basis sets. Given the atomic structures and the electronic spin state of an Ir or Rh cluster, the WBI and NBO charge analyses rank the catalytic sites reliably regardless of the basis sets used in the calculations.
Figure 11.
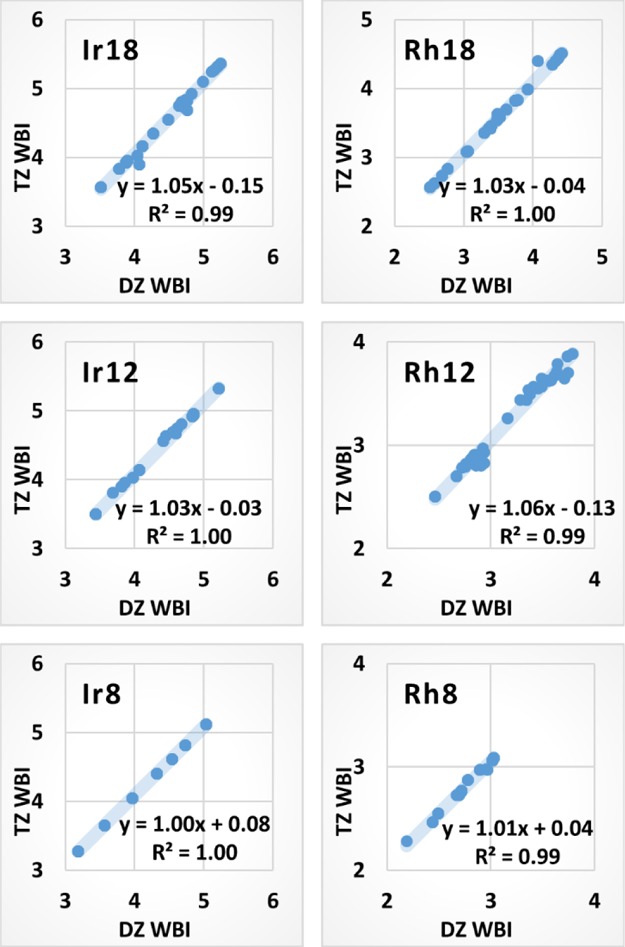
DZ vs TZ WBIs of the atoms in the TM18, TM12, and TM8 clusters (TM = Ir and Rh) with the electron spin quantum number S ranging from 0 to 6.
Thus far, the NBO charges and WBIs have been demonstrated to correlate strongly with the catalytic activities at various sites of Irn or Rhn (n = 12 or 18). It would be more beneficial if these two parameters also systematically correlated with the size of the TM clusters, but unfortunately, such correlations were not observed. In order to examine the size effect, we plotted the energy barrier versus the NBO charges at the corner site of TMn (n = 8, 12, and 18) for S = 0–6. The energy barriers were defined to be E(2S+1TS) – E(2S+1TMn) – E(C2H6), where 2S + 1 is the spin multiplicity—this treatment is used to separate out the electron spin effect. Unfortunately, both positive and negative correlations are observed in these plots, some having negligible R2 values. Similarly, the energy barrier versus WBI plots lack consistent trends. The NBO charges and WBIs are not reliable indicators for predicting the size effect of the Ir and Rh clusters. For more details, the NBO charges and WBIs at the corner sites of the Irn and Rhn clusters (n = 8, 12, and 18), as well as their (lack of) correlation with the reaction energy barrier, are presented in Appendix G of the Supporting Information.
Conclusions
The B3LYP calculations reveal a strong correlation between the NBO charges and the catalytic abilities of the various sites on the Ir and Rh clusters. The more positive the NBO charge, the more active the catalytic site. Similarly, the WBIs are also strong indicators of the activities of different catalytic sites. The lower the WBI, the more active the catalytic site. Compared to the MO visualization and the Mulliken analysis that are basis-set-dependent and qualitative rather than quantitative,16 both the NBO charges and the WBIs are quantitative and virtually independent of the basis sets. The NBO charges and WBIs are expected to provide a reliable means of fast prescreening the best catalytic sites on the Ir and Rh clusters and potentially other TM clusters for the dehydrogenation of ethane and other light alkanes. This fast and reliable prescreening tool is expected to expedite our future work on the global optimization of the TM catalysts used for the production of ethene and propene at low temperatures.
Acknowledgments
The donors of the American Chemical Society Petroleum Research Fund are acknowledged for partial support of this research. Y.G. thanks the Central Washington University (CWU) School of Graduate Studies and Research for the Faculty Research Support Award. M.S. thanks the CWU Office of Undergraduate Research for the travel fund. The authors thank Hao (Joseph) Jiang, Russell Kato, and Prasuna Gummagatta for their earlier research on Ir catalysis and Gabriel Borrello for proofreading the manuscript. The authors also thank CWU for access to the high-performance computers and particularly Bill Glessner for his technical assistance.
Supporting Information Available
The Supporting Information is available free of charge on the ACS Publications website at DOI: 10.1021/acsomega.9b02813.
Cartesian coordinates and vibrational frequencies of the Ir and Rh clusters and the corresponding TS structures calculated using the B3LYP-D3BJ method with the DZ basis sets; B3LYP-D3BJ single-point energies of the Ir and Rh clusters and the corresponding TS structures using the TZ basis sets; plots of TZ TS energy versus Ir–C (Rh–C) WBI for Ir18 and Rh18; DZ versus TZ Mulliken charges on Ir18 and Rh18; and NBO charges and WBIs at the corner sites of the Irn and Rhn clusters (n = 8, 12, and 18) as well as their (lack of) correlation with the reaction energy barrier (PDF)
The authors declare no competing financial interest.
Supplementary Material
References
- Ethene (Ethylene). http://www.essentialchemicalindustry.org/chemicals/ethene.html (accessed Aug 4, 2019).
- Propene (Propylene). http://www.essentialchemicalindustry.org/chemicals/propene.html (accessed Aug 4, 2019).
- Sattler J. J. H. B.; Ruiz-Martinez J.; Santillan-Jimenez E.; Weckhuysen B. M. Catalytic Dehydrogenation of Light Alkanes on Metals and Metal Oxides. Chem. Rev. 2014, 114, 10613–10653. 10.1021/cr5002436. [DOI] [PubMed] [Google Scholar]
- Zhang W.; Wang L. The Effect of Cluster Thickness on the Adsorption of CH4 on Pdn. Comput. Theor. Chem. 2011, 963, 236–244. 10.1016/j.comptc.2010.10.027. [DOI] [Google Scholar]
- Redfern P. C.; Zapol P.; Sternberg M.; Adiga S. P.; Zygmunt S. A.; Curtiss L. A. Quantum chemical study of mechanisms for oxidative dehydrogenation of propane on vanadium oxide. J. Phys. Chem. B 2006, 110, 8363–8371. 10.1021/jp056228w. [DOI] [PubMed] [Google Scholar]
- Vajda S.; Pellin M. J.; Greeley J. P.; Marshall C. L.; Curtiss L. A.; Ballentine G. A.; Elam J. W.; Catillon-Mucherie S.; Redfern P. C.; Mehmood F.; et al. Subnanometre platinum clusters as highly active and selective catalysts for the oxidative dehydrogenation of propane. Nat. Mater. 2009, 8, 213–216. 10.1038/nmat2384. [DOI] [PubMed] [Google Scholar]
- Cameron Shore T.; Mith D.; Deprekel D.; McNall S.; Ge Y. A B3LYP Study on the C-H Activation in Propane by Neutral and +1 Charged Low-Energy Platinum Clusters with 2-6 Atoms. React. Kinet., Mech. Catal. 2013, 109, 315–333. 10.1007/s11144-013-0572-3. [DOI] [Google Scholar]
- Ferguson G. A.; Mehmood F.; Rankin R. B.; Greeley J. P.; Vajda S.; Curtiss L. A. Exploring Computational Design of Size-Specific Subnanometer Clusters Catalysts. Top. Catal. 2012, 55, 353–365. 10.1007/s11244-012-9804-4. [DOI] [Google Scholar]
- Russell J.; Zapol P.; Král P.; Curtiss L. A. Methane Bond Activation by Pt and Pd Subnanometer Clusters Supported on Graphene and Carbon Nanotubes. Chem. Phys. Lett. 2012, 536, 9–13. 10.1016/j.cplett.2012.03.080. [DOI] [Google Scholar]
- Uzun A.; Dixon D. A.; Gates B. C. Prototype Supported Metal Cluster Catalysts: Ir4 and Ir6. ChemCatChem 2011, 3, 95–107. 10.1002/cctc.201000271. [DOI] [Google Scholar]
- Argo A. M.; Odzak J. F.; Lai F. S.; Gates B. C. Observation of ligand effects during alkene hydrogenation catalysed by supported metal clusters. Nature 2002, 415, 623–626. 10.1038/415623a. [DOI] [PubMed] [Google Scholar]
- Argo A. M.; Odzak J. F.; Gates B. C. Role of Cluster Size in Catalysis: Spectroscopic Investigation of γ-Al2O3-Supported Ir4 and Ir6 during Ethene Hydrogenation. J. Am. Chem. Soc. 2003, 125, 7107–7115. 10.1021/ja027741f. [DOI] [PubMed] [Google Scholar]
- Xu Z.; Xiao F.-S.; Purnell S. K.; Alexeev O.; Kawi S.; Deutsch S. E.; Gates B. C. Size-Dependent Catalytic Activity of Supported Metal Clusters. Nature 1994, 372, 346–348. 10.1038/372346a0. [DOI] [Google Scholar]
- Kulkarni A.; Lobo-Lapidus R. J.; Gates B. C. Metal clusters on supports: synthesis, structure, reactivity, and catalytic properties. Chem. Commun. 2010, 46, 5997–6015. 10.1039/c002707n. [DOI] [PubMed] [Google Scholar]
- Xiao L.; Wang L. Methane Activation on Pt and Pt4: A Density Functional Theory Study. J. Phys. Chem. B 2007, 111, 1657–1663. 10.1021/jp065288e. [DOI] [PubMed] [Google Scholar]
- Ge Y.; Jiang H.; Kato R.; Gummagatta P. Size and Site Dependence of the Catalytic Activity of Iridium Clusters toward Ethane Dehydrogenation. J. Phys. Chem. A 2016, 120, 9500–9508. 10.1021/acs.jpca.6b09882. [DOI] [PubMed] [Google Scholar]
- Cui Q.; Musaev D. G.; Morokuma K. Molecular Orbital Study of H2 and CH4 Activation on Small Metal Clusters. 2. Pd3 and Pt3. J. Phys. Chem. A 1998, 102, 6373–6384. 10.1021/jp982273a. [DOI] [Google Scholar]
- Ciebien J. F.; Cohen R. E.; Duran A. Catalytic Properties of Palladium Nanoclusters Synthesized within Diblock Copolymer Films: Hydrogenation of Ethylene and Propylene. Supramol. Sci. 1998, 5, 31–39. 10.1016/s0968-5677(97)00075-8. [DOI] [Google Scholar]
- Bell A. T. The impact of nanoscience on heterogeneous catalysis. Science 2003, 299, 1688–1691. 10.1126/science.1083671. [DOI] [PubMed] [Google Scholar]
- Keränen J.; Auroux A.; Ek S.; Niinistö L. Preparation, Characterization and Activity Testing of Vanadia Catalysts Deposited onto Silica and Alumina Supports by Atomic Layer Deposition. Appl. Catal., A 2002, 228, 213–225. 10.1016/s0926-860x(01)00975-9. [DOI] [Google Scholar]
- Adlhart C.; Uggerud E. C–H Activation of Alkanes on Rhn+ (n=1–30) Clusters: Size Effects on Dehydrogenation. J. Chem. Phys. 2005, 123, 214709. 10.1063/1.2131066. [DOI] [PubMed] [Google Scholar]
- Adlhart C.; Uggerud E. Mechanisms for the Dehydrogenation of Alkanes on Platinum: Insights Gained from the Reactivity of Gaseous Cluster Cations, Ptn+, n=1–21. Chem.—Eur. J. 2007, 13, 6883–6890. 10.1002/chem.200700501. [DOI] [PubMed] [Google Scholar]
- Venegas J. M.; McDermott W. P.; Hermans I. Serendipity in Catalysis Research: Boron-Based Materials for Alkane Oxidative Dehydrogenation. Acc. Chem. Res. 2018, 51, 2556–2564. 10.1021/acs.accounts.8b00330. [DOI] [PubMed] [Google Scholar]
- Raveendran Shiju N.; Guliants V. V. Recent Developments in Catalysis Using Nanostructured Materials. Appl. Catal., A 2009, 356, 1–17. 10.1016/j.apcata.2008.11.034. [DOI] [Google Scholar]
- Gärtner C. A.; van Veen A. C.; Lercher J. A. Oxidative Dehydrogenation of Ethane: Common Principles and Mechanistic Aspects. ChemCatChem 2013, 5, 3196–3217. 10.1002/cctc.201200966. [DOI] [Google Scholar]
- Liu M.; Wu J.; Hou H. Metal-Organic Framework (MOF)-Based Materials as Heterogeneous Catalysts for C-H Bond Activation. Chem.—Eur. J. 2019, 25, 2935–2948. 10.1002/chem.201804149. [DOI] [PubMed] [Google Scholar]
- Chen K.; Bell A. T.; Iglesia E. Kinetics and Mechanism of Oxidative Dehydrogenation of Propane on Vanadium, Molybdenum, and Tungsten Oxides. J. Phys. Chem. B 2000, 104, 1292–1299. 10.1021/jp9933875. [DOI] [Google Scholar]
- Argyle M. D.; Chen K. D.; Bell A. T.; Iglesia E. Effect of Catalyst Structure on Oxidative Dehydrogenation of Ethane and Propane on Alumina-Supported Vanadia. J. Catal. 2002, 208, 139–149. 10.1006/jcat.2002.3570. [DOI] [Google Scholar]
- Heracleous E.; Machli M.; Lemonidou A. A.; Vasalos I. A. Oxidative Dehydrogenation of Ethane and Propane over Vanadia and Molybdena Supported Catalysts. J. Mol. Catal. A: Chem. 2005, 232, 29–39. 10.1016/j.molcata.2005.01.027. [DOI] [Google Scholar]
- Susu A. A.; Ogogo E. O.; Ngomo H. M. The Effect of Sintering-Redispersion on the Selective Aromatic Yield on Supported Platinum Catalysts. Chem. Eng. Res. Des. 2006, 84, 664–676. 10.1205/cherd.04220. [DOI] [Google Scholar]
- Tanabe T.; Nagai Y.; Dohmae K.; Sobukawa H.; Shinjoh H. Sintering and Redispersion Behavior of Pt on Pt/MgO. J. Catal. 2008, 257, 117–124. 10.1016/j.jcat.2008.04.012. [DOI] [Google Scholar]
- Han C. W.; Iddir H.; Uzun A.; Curtiss L. A.; Browning N. D.; Gates B. C.; Ortalan V. Migration of Single Iridium Atoms and Tri-Iridium Clusters on MgO Surfaces: Aberration-Corrected STEM Imaging and Ab Initio Calculations. J. Phys. Chem. Lett. 2015, 6, 4675–4679. 10.1021/acs.jpclett.5b01884. [DOI] [PubMed] [Google Scholar]
- Chen M.; Dixon D. A. Low-Lying Electronic States of Irn Clusters with n = 2-8 Predicted at the DFT, CASSCF, and CCSD(T) Levels. J. Phys. Chem. A 2013, 117, 3676–3688. 10.1021/jp4014465. [DOI] [PubMed] [Google Scholar]
- Davis J. B. A.; Shayeghi A.; Horswell S. L.; Johnston R. L. The Birmingham parallel genetic algorithm and its application to the direct DFT global optimisation of IrN(N = 10-20) clusters. Nanoscale 2015, 7, 14032–14038. 10.1039/c5nr03774c. [DOI] [PubMed] [Google Scholar]
- Foster J. P.; Weinhold F. Natural Hybrid Orbitals. J. Am. Chem. Soc. 1980, 102, 7211–7218. 10.1021/ja00544a007. [DOI] [Google Scholar]
- Reed A. E.; Weinhold F. Natural Bond Orbital Analysis of Near-Hartree–Fock Water Dimer. J. Chem. Phys. 1983, 78, 4066–4073. 10.1063/1.445134. [DOI] [Google Scholar]
- Wiberg K. B. Application of the Pople-Santry-Segal CNDO Method to the Cyclopropylcarbinyl and Cyclobutyl Cation and to Bicyclobutane. Tetrahedron 1968, 24, 1083–1096. 10.1016/0040-4020(68)88057-3. [DOI] [Google Scholar]
- Harper L. K.; Shoaf A. L.; Bayse C. A. Predicting Trigger Bonds in Explosive Materials through Wiberg Bond Index Analysis. ChemPhysChem 2015, 16, 3886–3892. 10.1002/cphc.201500773. [DOI] [PubMed] [Google Scholar]
- Mayer I. Bond order and valence indices: a personal account. J. Comput. Chem. 2007, 28, 204–221. 10.1002/jcc.20494. [DOI] [PubMed] [Google Scholar]
- Lecours M. J.; Chow W. C. T.; Hopkins W. S. Density Functional Theory Study of RhnS0,± and Rhn+10,± (n = 1–9). J. Phys. Chem. A 2014, 118, 4278–4287. 10.1021/jp412457m. [DOI] [PubMed] [Google Scholar]
- Perdew J. P.; Burke K.; Ernzerhof M. Generalized Gradient Approximation Made Simple. Phys. Rev. Lett. 1996, 77, 3865–3868. 10.1103/physrevlett.77.3865. [DOI] [PubMed] [Google Scholar]
- Adamo C.; Barone V. Toward Reliable Density Functional Methods without Adjustable Parameters: The PBE0 Model. J. Chem. Phys. 1999, 110, 6158–6170. 10.1063/1.478522. [DOI] [Google Scholar]
- Becke A. D. Density-functional thermochemistry. III. The role of exact exchange. J. Chem. Phys. 1993, 98, 5648–5652. 10.1063/1.464913. [DOI] [Google Scholar]
- Lee C.; Yang W.; Parr R. G. Development of the Colle-Salvetti correlation-energy formula into a functional of the electron density. Phys. Rev. B: Condens. Matter Mater. Phys. 1988, 37, 785–789. 10.1103/physrevb.37.785. [DOI] [PubMed] [Google Scholar]
- Stephens P. J.; Devlin F. J.; Chabalowski C. F.; Frisch M. J. Ab Initio Calculation of Vibrational Absorption and Circular Dichroism Spectra Using Density Functional Force Fields. J. Phys. Chem. 1994, 98, 11623–11627. 10.1021/j100096a001. [DOI] [Google Scholar]
- Frisch M. J.; Trucks G. W.; Schlegel H. B.; Scuseria G. E.; Robb M. A.; Cheeseman J. R.; Scalmani G.; Barone V.; Petersson G. A.; Nakatsuji H.; et al. Gaussian 09, Revision D.1; Gaussian, Inc.: Wallingford CT, 2009.
- Grimme S.; Ehrlich S.; Goerigk L. Effect of the Damping Function in Dispersion Corrected Density Functional Theory. J. Comput. Chem. 2011, 32, 1456–1465. 10.1002/jcc.21759. [DOI] [PubMed] [Google Scholar]
- Hay P. J.; Wadt W. R. Ab Initio Effective Core Potentials for Molecular Calculations. Potentials for K to Au Including the Outermost Core Orbitals. J. Chem. Phys. 1985, 82, 299–310. 10.1063/1.448975. [DOI] [Google Scholar]
- Ehlers A. W.; Böhme M.; Dapprich S.; Gobbi A.; Höllwarth A.; Jonas V.; Köhler K. F.; Stegmann R.; Veldkamp A.; Frenking G. A Set of F-Polarization Functions for Pseudo-Potential Basis Sets of the Transition Metals Sc–Cu, Y–Ag and La–Au. Chem. Phys. Lett. 1993, 208, 111–114. 10.1016/0009-2614(93)80086-5. [DOI] [Google Scholar]
- Hehre W. J.; Ditchfield R.; Pople J. A. Self-Consistent Molecular Orbital Methods. XII. Further Extensions of Gaussian-Type Basis Sets for Use in Molecular Orbital Studies of Organic Molecules. J. Chem. Phys. 1972, 56, 2257–2261. 10.1063/1.1677527. [DOI] [Google Scholar]
- Hariharan P. C.; Pople J. A. The Influence of Polarization Functions on Molecular Orbital Hydrogenation Energies. Theor. Chim. Acta 1973, 28, 213–222. 10.1007/bf00533485. [DOI] [Google Scholar]
- Liu W.; Ren Z.; Bosse A. T.; Liao K.; Goldstein E. L.; Bacsa J.; Musaev D. G.; Stoltz B. M.; Davies H. M. L. Catalyst-Controlled Selective Functionalization of Unactivated C-H Bonds in the Presence of Electronically Activated C-H Bonds. J. Am. Chem. Soc. 2018, 140, 12247–12255. 10.1021/jacs.8b07534. [DOI] [PubMed] [Google Scholar]
- Yang Y.-F.; Houk K. N.; Wu Y.-D. Computational Exploration of RhIII/RhV and RhIII/RhI Catalysis in Rhodium(III)-Catalyzed C–H Activation Reactions of N-Phenoxyacetamides with Alkynes. J. Am. Chem. Soc. 2016, 138, 6861–6868. 10.1021/jacs.6b03424. [DOI] [PubMed] [Google Scholar]
- Karmel C.; Li B.; Hartwig J. F. Rhodium-Catalyzed Regioselective Silylation of Alkyl C–H Bonds for the Synthesis of 1,4-Diols. J. Am. Chem. Soc. 2018, 140, 1460–1470. 10.1021/jacs.7b11964. [DOI] [PMC free article] [PubMed] [Google Scholar]
- Sundermann A.; Uzan O.; Milstein D.; Martin J. M. L. Selective C–C vs C–H Bond Activation by Rhodium(I) PCP Pincer Complexes. A Computational Study. J. Am. Chem. Soc. 2000, 122, 7095–7104. 10.1021/ja000943w. [DOI] [Google Scholar]
- DeAngelis A.; Shurtleff V. W.; Dmitrenko O.; Fox J. M. Rhodium(II)-Catalyzed Enantioselective C–H Functionalization of Indoles. J. Am. Chem. Soc. 2011, 133, 1650–1653. 10.1021/ja1093309. [DOI] [PMC free article] [PubMed] [Google Scholar]
- Shiekh B. A. Hierarchy of Commonly Used DFT Methods for Predicting the Thermochemistry of Rh-Mediated Chemical Transformations. ACS Omega 2019, 4, 15435–15443. 10.1021/acsomega.9b01563. [DOI] [PMC free article] [PubMed] [Google Scholar]
- Grimme S. Semiempirical Hybrid Density Functional with Perturbative Second-Order Correlation. J. Chem. Phys. 2006, 124, 034108. 10.1063/1.2148954. [DOI] [PubMed] [Google Scholar]
- Perdew J. P.; Chevary J. A.; Vosko S. H.; Jackson K. A.; Pederson M. R.; Singh D. J.; Fiolhais C. Atoms, molecules, solids, and surfaces: Applications of the generalized gradient approximation for exchange and correlation. Phys. Rev. B: Condens. Matter Mater. Phys. 1992, 46, 6671–6687. 10.1103/physrevb.46.6671. [DOI] [PubMed] [Google Scholar]
- Perdew J. P.; Wang Y. Accurate and simple analytic representation of the electron-gas correlation energy. Phys. Rev. B: Condens. Matter Mater. Phys. 1992, 45, 13244–13249. 10.1103/physrevb.45.13244. [DOI] [PubMed] [Google Scholar]
- Perdew J. P.Electronic Structure of Solids; Ziesche P., Eschrig H., Eds.; Akademie Verlag: Berlin, 1991. [Google Scholar]
- Perdew J. P.; Burke K.; Wang Y. Generalized Gradient Approximation for the Exchange-Correlation Hole of a Many-Electron System. Phys. Rev. B: Condens. Matter Mater. Phys. 1996, 54, 16533–16539. 10.1103/physrevb.54.16533. [DOI] [PubMed] [Google Scholar]
- Becke A. D. Density-Functional Exchange-Energy Approximation with Correct Asymptotic Behavior. Phys. Rev. A: At., Mol., Opt. Phys. 1988, 38, 3098–3100. 10.1103/physreva.38.3098. [DOI] [PubMed] [Google Scholar]
- Hohenberg P.; Kohn W. Inhomogeneous Electron Gas. Phys. Rev. 1964, 136, B864–B871. 10.1103/physrev.136.b864. [DOI] [Google Scholar]
- Kohn W.; Sham L. J. Self-Consistent Equations Including Exchange and Correlation Effects. Phys. Rev. 1965, 140, A1133–A1138. 10.1103/physrev.140.a1133. [DOI] [Google Scholar]
- Slater J. C.The Self-Consistent Field for Molecular and Solids. Quantum Theory of Molecular and Solids; McGraw-Hill: New York, 1974; Vol. 4. [Google Scholar]
- Vosko S. H.; Wilk L.; Nusair M. Accurate Spin-Dependent Electron Liquid Correlation Energies for Local Spin Density Calculations: A Critical Analysis. Can. J. Phys. 1980, 58, 1200–1211. 10.1139/p80-159. [DOI] [Google Scholar]
- Roy L. E.; Hay P. J.; Martin R. L. Revised Basis Sets for the LANL Effective Core Potentials. J. Chem. Theory Comput. 2008, 4, 1029–1031. 10.1021/ct8000409. [DOI] [PubMed] [Google Scholar]
- Krishnan R.; Binkley J. S.; Seeger R.; Pople J. A. Self-consistent molecular orbital methods. XX. A basis set for correlated wave functions. J. Chem. Phys. 1980, 72, 650–654. 10.1063/1.438955. [DOI] [Google Scholar]
- Glendening E. D.; Reed A. E.; Carpenter J. E.; Weinhold F.. NBO Program, Version 3.1; Gaussian Inc., 2003.
- Szabo A.; Ostlund N. S.. Modern Quantum Chemistry, 1st ed.; McGraw-Hill: New York, 1982. [Google Scholar]
- Jensen F.Introduction to Computational Chemistry, 2nd ed.; John Wiley & Sons Ltd.: Chichester, 2007. [Google Scholar]
- Cramer C. J.Essentials of Computational Chemistry, 2nd ed.; John Wiley & Sons Ltd.: Chichester, 2004. [Google Scholar]
Associated Data
This section collects any data citations, data availability statements, or supplementary materials included in this article.