Abstract
Background
Novel biomarkers provide clinicians more critical information on tumor genetic features and patients’ prognosis. Here, we aimed to establish prognosis-predicting signatures for endometrial carcinoma (EC) patients based on the miRNA information.
Material/Methods
The Cancer Genome Atlas (TCGA) website was available for dataset extraction. Prognosis-associated miRNAs were generated by univariate Cox regression test. Online websites were used to predict the targeted genes of these enrolled miRNAs. The miRNA-mRNA network was described by Cytoscape software, while the relevant signaling pathways of these targeted genes were enriched by Gene ontology (GO) and Kyoto Encyclopedia of Genes and Genomes (KEGG) analyses.
Results
The miRNA-based overall survival (OS) and recurrence-free survival (RFS) predicting signatures were constructed by LASSO Cox regression analyses, respectively, by which, the endometrial carcinoma patients were separated into high- and low-risk groups in both the discovery and validation sets. Univariate Cox regression analyses suggested that these high-risk patients had elevated death and recurrence risk compared to low-risk patients. In addition, multivariate Cox regression analysis confirmed that our signatures were independent prognosticate factors with or without clinicopathological features for endometrial carcinoma patients. Moreover, the miRNA-mRNA network was displayed by Cytoscape software, and the pathway enrichment analyses found that the targeted genes of these enrolled miRNAs were enriched in tumor progression and drug resistance-related pathways.
Conclusions
The OS and RFS predicting classifiers serve as independent prognosis-associated determiners for EC patients.
MeSH Keywords: Endometrial Neoplasms, MicroRNAs, Prognosis, Transcriptome
Background
Since endometrial carcinoma (EC) belongs to one of the dominant gynecological cancers, more than 61 000 endometrial cancer patients were diagnosed in 2017, while the anticipated death number was 10 920 [1]. The overall survival rate has been obviously increased by the application of early detection; however, 20% of the tumor cases still have unsatisfied prognosis rates with the median survival time of just 1-year [2]. Disease recurrence or chemotherapy resistance has been the major threaten for EC patients, and lack of precise molecular targets that could be served as favorable diagnostic or prognosticate biomarkers at this time for EC patients [3–6]. Therefore, identifying prognosticate markers would be much beneficial to these EC patients since they served as predictors for the treatment response.
Previously, many studies focused on mRNA or protein expression on EC prognosis or progression [7,8], such as MACC1 and c-Myc, which are upregulated in the serum or tumor tissues generated from EC patients, and both are associated with primary infiltration, TNM stage, and metastases [9]. Recently, with the advance of microRNA (miRNA) sequencing, we tried to focus on whether the variations of miRNAs could be served as prognosis markers in endometrial cancer. MiRNAs are defined as small, non-coding RNA, with 18 to 25 nucleotides long [10]. Studies found that miRNAs commonly participate in epigenetic regulation, while the most crucial role of miRNA is post-transcriptional regulation of targeted genes. Commonly, miRNA could result in mRNA cleavage, translational repression, or mRNA decay via interacting with the 3′ untranslated region (3′ UTR) of the targeted genes’ mRNA [11,12]. Through which, these miRNAs contribute to the regulation of cancer cell proliferation or progression [13,14]. MiRNAs, such as miR-181c and miR-522, have been found that play a critical role during the tumorigenesis or progression of EC [15,16]. Studies also pointed out that miRNAs’ features indicate a possible role as prognosis-related markers. Wang et al. [17] found that in primary or metastatic EC tissues, miR-29b was lower expressed compared with the normal controls, and using miR-29b expression to diagnose EC output 0.976 area under the curve (AUC), with the 96.1% sensitivity and 97.9% specificity, suggesting that lower expression of miR-29b correlated with poor prognosis of EC patients. Similarly, upregulation of miR-200c in endometrioid-EC tissues compared with normal controls was revealed by Wilczynski et al. [18]; they also found that lower expression of miR-200c was linked to unfavorable survival.
Currently, few studies have systematically explored the value of miRNA signature in predicting the prognosis of EC patients. Thus, we defined 2 miRNA-based prognosis predicting signatures according to the miRNA profile of EC patients released by The Cancer Genome Atlas (TCGA).
Material and Methods
Data source
The miRNA matrix was extracted from TCGA database, comprising 185 EC cases and 13 controls. The clinical parameters, including sex, age, overall survival (OS), recurrence-free survival (RFS), pathological grade, and tumor stage, were also collected. In addition, these patients were randomly separated into the discovery and validation sets (94 patients versus 40 patients).
MiRNA-based prognosis signature construction and risk classification
We first used the univariate analysis to figure out the connection between miRNA expression and OS or RFS. Then, we performed the LASSO bagging Cox regression test to obtain the resample model inclusion proportion (RMIP) data. Based on the hazard ratio (HR) and coefficient (co-ef) of each miRNA, we established the prognosis signatures for OS and RFS, respectively.
Prognostic signature validation and receiver operating characteristic (ROC)
K-M curve was applied to determine the survival difference between high- and low-risk groups in both the discovery set and internal validation set. After that, the AUC values of the receiver operating characteristic (ROC) curve were calculated to reflect the predictive value and stability of our signatures. Moreover, we also conducted subgroup analyses based on the clinicopathological parameters, including age, pathological grade, etc. We would try to combine our signature with these features and generate a synthesis nomogram model to enlarge the synthesis effects of our signatures further.
Functional annotation
Determining the targeted genes of the enrolled miRNAs, which related to the OS and RFS signature, is critiqued to investigate the function of miRNA in endometrioid carcinoma. For the prediction, we mainly relied on 3 online databases, miRanda (match sequence length/mismatch sequence length >4; and align score >140), miRDB (target prediction score >60), and TargetScan (cumulative weighted context ++ score <−0.3). Then, Gene Ontology (GO), Reactome, and Kyoto Encyclopedia of Genes and Genomes (KEGG) analyses were performed for these genes. The interaction network of miRNA-mRNA was constructed by Cytoscape software [19].
Result
Establish miRNA-based prognosis predicting signature for EC patients
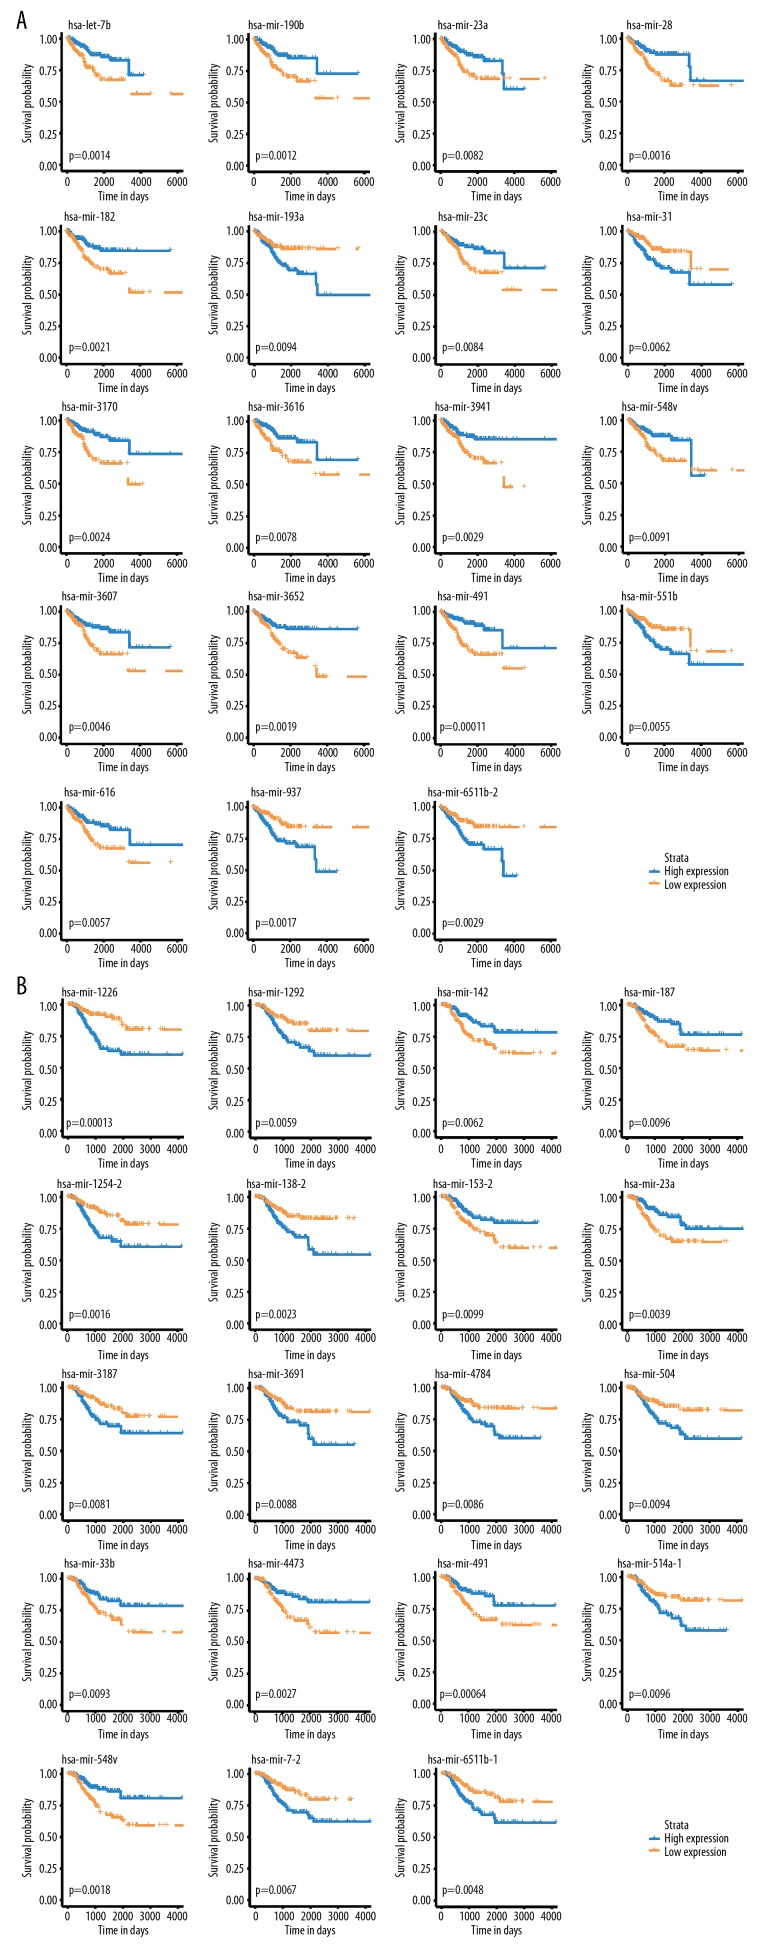
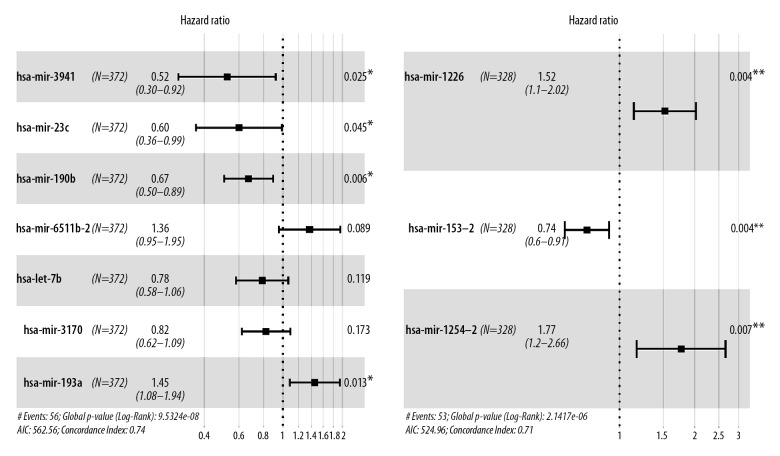
The EC patients were randomly divided into discovery and validation groups. The univariate analysis was conducted to figure out the correlation between miRNA expression and OS or RFS (Figure 1A, 1B). Then, the LASSO bagging Cox regression test was applied to select potential miRNAs (Tables 1, 2) and established the prognosis signatures based on the HR and co-ef values generated from each miRNA (Figure 2A, 2B).
Figure 1.
K-M analyses. (A) K-M curves of OS-associated miRNA detected by Univariate Cox Regression analyses. (B) K-M curves of RFS-related miRNAs revealed by univariate Cox Regression analysis. OS – overall survival; RFS – recurrence-free survival; K-M – Kaplan-Meier.
Table 1.
The RMIP for each of the 19 overall survival related miRNAs was measured by LASSO Bagging Cox Regression Analysis.
| Variate | Frequency |
|---|---|
| hsa-mir-3941 | 653 |
| hsa-mir-23c | 595 |
| hsa-mir-190b | 578 |
| hsa-mir-6511b-2 | 574 |
| hsa-let-7b | 555 |
| hsa-mir-3170 | 512 |
| hsa-mir-193a | 505 |
| hsa-mir-3616 | 490 |
| hsa-mir-551b | 437 |
| hsa-mir-616 | 326 |
| hsa-mir-31 | 214 |
| hsa-mir-28 | 212 |
| hsa-mir-23a | 205 |
| hsa-mir-491 | 196 |
| hsa-mir-3652 | 141 |
| hsa-mir-182 | 129 |
| hsa-mir-548v | 78 |
| hsa-mir-937 | 70 |
| hsa-mir-3607 | 58 |
RMIP – resample model inclusion proportion.
Table 2.
The RMIP for each of the 19 recurrence-free survival related miRNAs was measured by LASSO Bagging Cox Regression Analysis.
| Variate | Frequency |
|---|---|
| hsa-mir-1226 | 559 |
| hsa-mir-153-2 | 530 |
| hsa-mir-1254-2 | 529 |
| hsa-mir-3187 | 467 |
| hsa-mir-514a-1 | 378 |
| hsa-mir-23a | 369 |
| hsa-mir-548v | 366 |
| hsa-mir-4473 | 277 |
| hsa-mir-138-2 | 270 |
| hsa-mir-187 | 250 |
| hsa-mir-7-2 | 218 |
| hsa-mir-1292 | 161 |
| hsa-mir-491 | 150 |
| hsa-mir-142 | 149 |
| hsa-mir-33b | 133 |
| hsa-mir-6511b-1 | 121 |
| hsa-mir-3691 | 84 |
| hsa-mir-504 | 53 |
| hsa-mir-4784 | 32 |
RMIP – resample model inclusion proportion.
Figure 2.
Construction of miRNA-based prognosis predicting signature of endometrial cancer. Hazard ratio of enrolled OS related miRNA (A) and enrolled RFS-related miRNA (B), conducted by LASSO Cox regression analysis. miRNA – microRNA; OS – overall survival; RFS – recurrence-free survival.
Seven miRNAs were enrolled to establish OS predicting signature in EC cases (Figure 2A). Among the 7 miRNAs, 5 of them (miR-3941, miR-23c, miR-190b, miR-let-7b, and miR-3170) were identified and played protective roles (HR <1), while 2 miRNAs (miR-6511b and miR-193a) identified as risk factors (HR >1). Besides, miR-1226, miR-153-2, and miR-1254-2 might benefit the evolution of RFS for EC patients (Figure 2B). A formula was generated related to OS=0.372 * miR-193a −0.650 * miR-3941 −0.512 * miR-23c−0.400 * miR-190b +0.311 * miR-6511b-2 −0.242 * let-7b − 0.196 * miR-3170. For predicting the RFS of EC patients, the risk score applied=0.418 * miR-1226 −0.300 * miR-153-2 +0.568 * miR-1254-2. The OS and RFS-related risk classification scores for EC patients were generated according to the OS and RFS predicting signatures. Then, the low- and high-risk population were defined according to the cutoff risk score (median).
Validation of the miRNA-based signatures
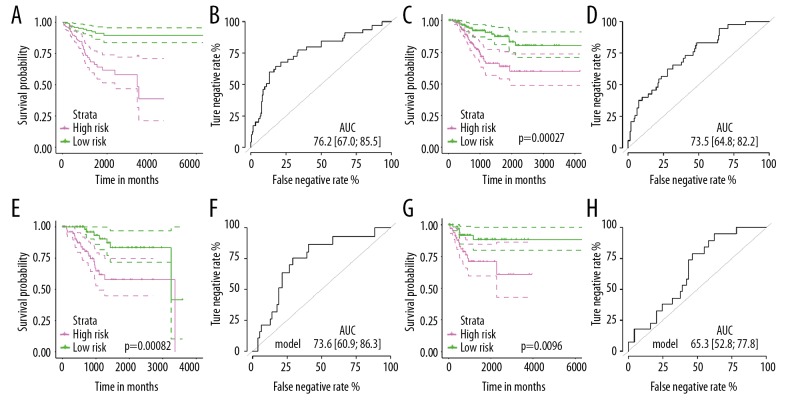
K-M plot was used to discriminate the difference of OS/RFS between the low- and high-risk population in discovery/validation dataset, respectively. For OS predictive signature, the results indicated that patients in a high-risk group have poorer OS compared to low risk-groups both in the discovery cohort (Figure 3A, P<0.001) and validation cohort (Figure 3C, P=0.00082). Then, ROC analyses confirmed the accuracy of the 7-miRNA-based classifier in predicting OS, and the classifiers showed similar and stable accuracy in the discovery set [Figure 3B, AUC=76.2 (95%CI: 67.0–85.5)] and independent validation set (Figure 3D, AUC=73.6 (95%CI: 60.9–86.3)].
Figure 3.
The miRNA-based OS and RFS predicting classifiers’ performance in endometrial cancer. (A) Kaplan-Meier curve at the low- and risky groups verified by the seven-miRNA-based OS predicting classifier in the training set. (B) ROC curve at the low- and risky sets verified by the 7-miRNA-based OS predicting classifier in the training set. (C) Kaplan-Meier curve at the low and risky groups verified by the 7-miRNA-based OS predicting classifier in the internal validation set. (D) ROC curve at the low and risky sets verified by the 7-miRNA-based OS predicting classifier in the internal validation set. (E) Kaplan-Meier curve at the low- and risky groups verified by the 3-miRNA-based RFS predicting classifier in the training set. (F) ROC curve at the low and risky sets verified by the 3-miRNA-based RFS predicting classifier in the training set. (G) Kaplan-Meier curve at the low and risky groups verified by the 3-miRNA-based RFS predicting classifier in the internal validation set. (H) ROC curve at the low and risky sets verified by the 3-miRNA-based RFS predicting classifier in the internal validation set. miRNA – microRNA; OS – overall survival; RFS – recurrence-free survival, ROC – receiver operating characteristic.
Consistently, the results suggested that for these patients in the high-risk group assigned by risk formula had unfavorable prognosis than these low-risk patients (Figure 3E, 3G). Areas under ROC curve for RFS classifier were 73.5 (64.8–82.2) and 65.3 (52.8–77.8) in the discovery and validation group, respectively (Figure 3F–3H), which also showed excellent performance on recurrence prediction.
Functional enrichment and network visualization
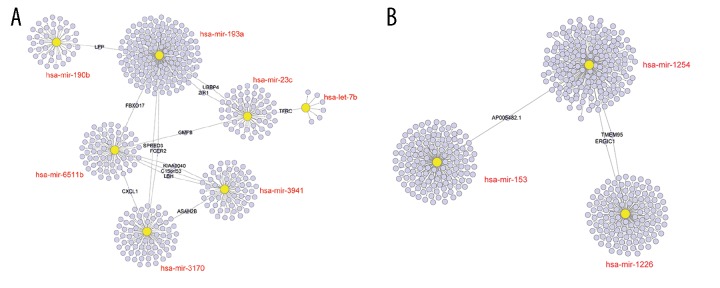
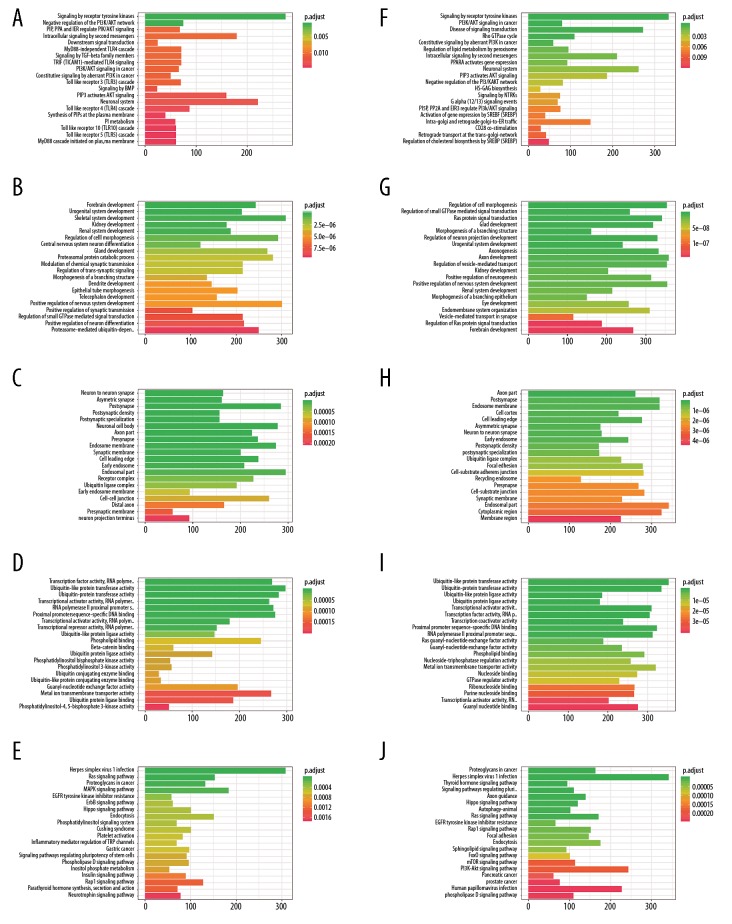
We predicted the downstream genes of these enrolled miRNAs with the web interactive prediction tools. The interaction network of miRNA-mRNA was displayed in Figure 4. GO (BP, biological process; CC, cellular component; MF, molecular function), Reactome, hallmark, and KEGG analyses were performed to explore the biological function/potential mechanisms of the targeted genes (Figure 5). The targeted genes of OS-related miRNAs were significantly enriched in Signaling by Receptor Tyrosine Kinases, Negative regulation of the PI3K/AKT network, transcription factor activity, PI5P, PP2A, and IER3 regulate PI3K/AKT signaling, ubiquitin-like protein transferase activity, Ras signaling pathway, MAPK signaling pathway, etc., which are reported significantly related to tumorigenesis and drug resistance processes. For the RFS-related genes, they were significantly enriched in cancer progression-related pathways, such as signaling by receptor tyrosine kinases, PI3K/AKT signaling in cancer.
Figure 4.
Prediction of miRNAs down-stream target genes. (A) The targeted genes of miR-193a, miR-3941, miR-23c, miR-190b, miR-6511b, let-7b, and miR-3170. (B) Downstream gene prediction of RFS-related miR-1226, miR-153-2, miR-1254-2. miRNA – microRNA; RFS – recurrence-free survival.
Figure 5.
(A–J) Functional enrichment analyses: GO-BP, GO-CC, GO-MF, hallmark, KEGG, and Reactome. BP – biological process; CC – cellular component; MF – molecular function.
Stratified analyses
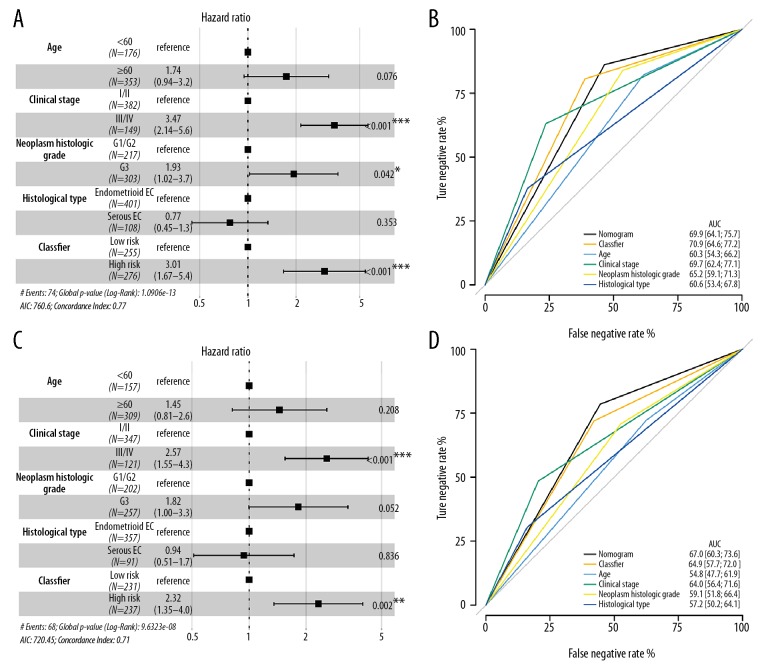
The OS-related classifier was an independent factor for EC patients after adjusting clinical-pathological parameters (HR=3.01, 95%CI: 1.67–5.4, P<0.001) (Figure 6A). Although our classifier was less efficient than the clinical stage (HR=3.47, 95%CI: 2.14–5.6, P<0.001), it was much superior to histological type and neoplasm histological grade. The discriminatory ability or stability for the OS prediction signature was executed. Our classifier showed moderate performance with the AUC value up to 70.9, which was higher than the clinical stage (AUC=69.7) and histological grade (AUC=60.6) (Figure 6B). Besides, we also established a nomogram to estimate the synthesis effects by combining our classifier and clinicopathological features, whereas the result was similar to our classifier itself.
Figure 6.
Multivariate analyses. (A, C) A hazard ratio of enrolled clinicopathological features and the miRNA-based OS/RFS classifiers in the overall set, respectively. (B, D) ROC curve showed the difference between clinicopathological features and the miRNA-based OS/RFS classifiers in the overall set, respectively. Nomogram was a synthesis model by combining the miRNA-based overall survival classifier and clinicopathological features. miRNA – microRNA; OS – overall survival; RFS – recurrence-free survival; AUC – area under the curve; ROC – receiver operating characteristic.
For the miRNA-based RFS classifier, it could also be used to precisely identify patients with the high-risk of recurrence in the overall cohort (HR=2.32, 95%CI: 1.35–4.0, P=0.002) (Figure 6C). Similar to OS-classifier, we found the clinical stage had the most efficient power to classify the high-risk patients (HR=2.57, 95%CI: 1.55–4.3, P<0.001) than our RFS classifier. The AUC value for RFS classifier was 64.9 (95%CI: 57.7–72.0, Figure 6D), which was higher than clinical stage, pathological grade (AUC=64.0, 95%CI: 56.4–71.6), histological type (AUC=57.2, 95%CI: 50.2–64.1). However, at this time, we found a synthesis effect by combining our RFS classifier and clinicopathological features, and the AUC value was 67.0 (95%CI: 60.3–73.6), which was higher than any of the other subtypes.
Notably, we set up a nomogram by merging the clinicopathological parameters with our classifier and found the OS-related nomogram had less capacity than our OS classifier. While for the RFS-related nomogram, it displayed the best predictive value than any of other classifiers (Figure 6B, 6D).
Stratified survival analyses
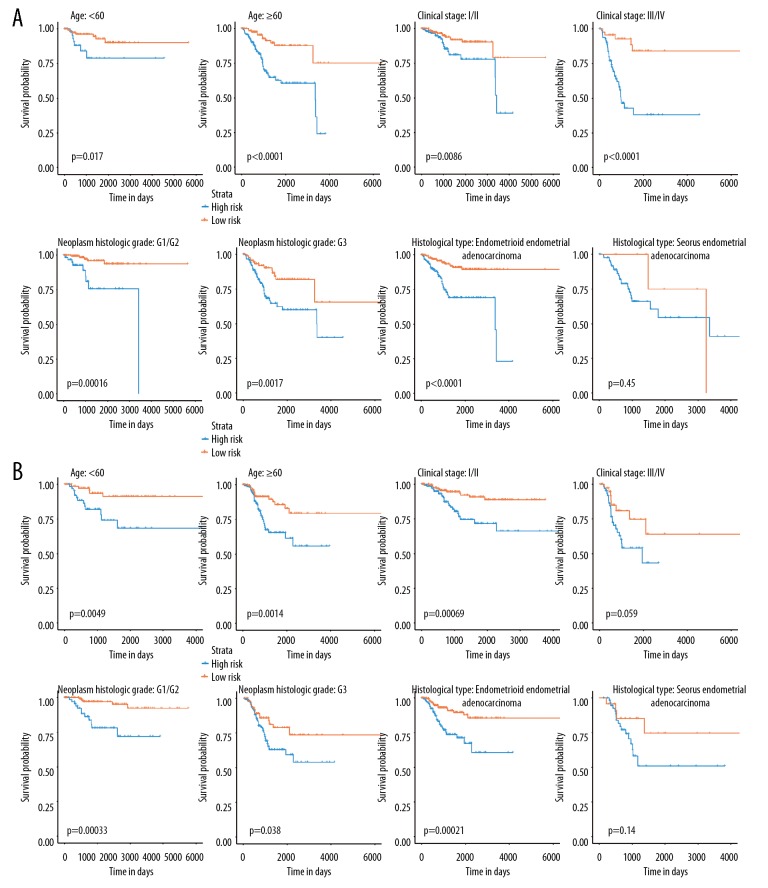
When stratified by age, clinical stage, and neoplasm histological grade, the seven-miRNA-based classifier was still clinically and statistically significant for prognosticating prediction of OS (Figure 7A). The classifier defined high-risk patients had a worse prognosis than that of low-risk patients in the clinical stage I/II (P=0.0005), as well as in stage III/IV (P<0.001). We also assessed the prognostic prediction ability of the seven-miRNA-based signature for different histological type, and we found that the classifier was suitable for endometrioid-EC (P<0.001) rather than serious EC (P=0.450).
Figure 7.
Subgroup analyses revealed by Kaplan-Meier survival curve. (A) Stratified survival analyses based on the clinicopathological features age, clinical stage, histological stage, and neoplasm histological grade for the 7-miRNA-based OS classifier. (B) Stratified survival analyses based on the clinicopathological features age, clinical stage, histological stage, and neoplasm histological grade for the seven-miRNA-based RFS classifier. The blue line suggested the high-risk group, while the yellow line indicated the low-risk group. miRNA – microRNA; OS – overall survival; RFS – recurrence-free survival.
For the 3-miRNA-based RFS signature, we found it displayed a favorable discrimination performance regardless of different age groups (<60 years or >60 years), different histological grades (G1/G2 or G3) (Figure 7B), and the patients with low-risk scores had significantly better RFS than patients with high-risk scores in age <60 (P<0.001), age >60 (P=0.0014), G1/G2 (P<0.001), and G3 (P=0.038). On the other side, we also assessed the prognostic ability of the RFS signature based on clinical stage and histological type. The result showed that this miRNA based signature was more suitable to classify the high-risk group and the low-risk group for clinical stage I+II (P=0.00069) instead of III+IV (P=0.059), and endometrioid-EC (P=0.00021) rather than serious EC (P=0.140) (Figure 7B).
Discussion
Referring to the dualistic model, the EC patients are separated into 2 types, including type I (~75%, endometrioid EC) and type II (<25%, non-endometrioid tumors) [20]. The study found that 15% of the type II cases have the tendency to invade the surrounding tissues [21], and these patients mostly have a reduced 5-year survival rate [22,23]. Herein, developing more prognostic-related markers for EC patients are urgent.
To reveal the miRNA signatures’ characteristic exclusively for EC patients, we established and validated 2 signatures to predict the OS and RFS prognosis of EC patients. The 2 signatures were described to be reliable classifiers in the univariate analyses and remained to be robust predictive factors with or without clinicopathological factors in multivariate analyses. In addition, the prognostic ability and stability of the 2 signatures were well replicated in the overall set, and better than any of the other clinicopathological factors (such as age, clinical stage, histological stage, and histological type). More meaningfully, our signatures could offer additional predictive information combining current stage classification systems, which is a high priority for EC.
According to the reports of previous publications related with the miRNAs enrolled in our model, downregulation of miR-23C, miR-3170, and miR-let-7 has a connection to tumorigenic pathways implicated in hepatocellular carcinoma, Merkle cell carcinoma, squamous-cell carcinoma and so on [24–26]. In the Wang et al. study [27], miR-3170 was validated to be significantly correlated with the OS of EC. Kou et al. [28] discovered that H19 increases the migration and invasion of tongue squamous cell carcinoma via sponging miR-let-7, which involves the mitochondrial dynamic regulation [28] and proliferation potential [29]. For miR-193a to function as a diagnostic biomarker and therapeutic target, several studies have revealed that miR-193 family participates in various tumors’ biological processes by interaction unique targeting and signaling [29–31], regulating cell growth, apoptosis, proliferation, and cell motility. In addition, functional prediction analyses suggested that the predicted genes of the enrolled miRNAs are highly enriched in tumor progression/drug resistance-related pathways, such as receptor tyrosine kinase signaling pathway, PI3K-AKT network, regulation of cell morphogenesis [17,32,33]
Conclusions
Our miRNA-based classifiers seem to be independent and reliable prognosticate tools for endometrial cancer. It can provide predictive value to complement the existing clinical staging system for OS and RFS for EC patients, which can enable clinicians to identify the candidates with poor prognosis or high-risk of recurrence at an early stage to administrate personalized treatment.
Footnotes
Conflict of interests
None.
Source of support: This work was supported by the National Natural Science Foundation of China grants 81600404, Project funded by China Postdoctoral Science Foundation 2017M622916, Jiangmen City Returned Overseas Students Innovation and Entrepreneurship Project, The First Batch of Innovative and Entrepreneurial Talents in Jiangmen City, The Fourth Batch of Medical and Health Science and Technology projects in Jiangmen City 2017A3019. The Guangzhou Key Laboratory of Molecular and Functional Imaging for Clinical Translation (Project No. 201905010003). The Engineering Research Center of Medical Imaging Artificial Intelligence for Precision Diagnosis and Treatment, Guangdong Province. The Key Program of the Natural Science Foundation of Guangdong Province (Project No. 2018B0303110011). The National Natural Science Foundation of China (Project No. 81771973)
References
- 1.Siegel RL, Miller KD, Jemal A. Cancer Statistics, 2017. Cancer J Clin. 2017;67(1):7–30. doi: 10.3322/caac.21387. [DOI] [PubMed] [Google Scholar]
- 2.Sonoda Y, Barakat RR. Screening and the prevention of gynecologic cancer: Endometrial cancer. Best Pract Res Clin Obstet Gynaecol. 2006;20(2):363–77. doi: 10.1016/j.bpobgyn.2005.10.015. [DOI] [PubMed] [Google Scholar]
- 3.Creasman WT, Eddy GL. Recent advances in endometrial cancer. Semin Surg Oncol. 1990;6(6):339–42. doi: 10.1002/ssu.2980060608. [DOI] [PubMed] [Google Scholar]
- 4.Oliveto S, Mancino M, Manfrini N, Biffo S. Role of microRNAs in translation regulation and cancer. World J Biol Chem. 2017;8(1):45–56. doi: 10.4331/wjbc.v8.i1.45. [DOI] [PMC free article] [PubMed] [Google Scholar]
- 5.Ring KL, Garcia C, Thomas MH, Modesitt SC. Current and future role of genetic screening in gynecologic malignancies. Am J Obstet Gynecol. 2017;217(5):512–21. doi: 10.1016/j.ajog.2017.04.011. [DOI] [PubMed] [Google Scholar]
- 6.Yanokura M, Banno K, Iida M, et al. MicroRNAS in endometrial cancer: Recent advances and potential clinical applications. EXCLI J. 2015;14(5):190–98. doi: 10.17179/excli2014-590. [DOI] [PMC free article] [PubMed] [Google Scholar]
- 7.Ayakannu T, Taylor AH, Marczylo TH, et al. Identification of novel predictive biomarkers for endometrial malignancies: N-acylethanolamines. Front Oncol. 2019;9:430. doi: 10.3389/fonc.2019.00430. [DOI] [PMC free article] [PubMed] [Google Scholar]
- 8.Cheng L, Zhao T, Li S, et al. Overexpression of HPIP as a biomarker for metastasis and prognosis prediction in endometrial cancer patients. J Clin Lab Anal. :2019. doi: 10.1002/jcla.22959. [Epub ahead of print] [DOI] [PMC free article] [PubMed] [Google Scholar]
- 9.Zhang Q, Xu P, Lu Y, Dou H. Correlation of MACC1/c-Myc expression in endometrial carcinoma with clinical/pathological features or prognosis. Med Sci Mont. 2018;24:4738–44. doi: 10.12659/MSM.908812. [DOI] [PMC free article] [PubMed] [Google Scholar]
- 10.Lagos-Quintana M, Rauhut R, Lendeckel W, Tuschl T. Identification of novel genes coding for small expressed RNAs. Science. 2001;294(5543):853–58. doi: 10.1126/science.1064921. [DOI] [PubMed] [Google Scholar]
- 11.Bartel DP. MicroRNAs: Genomics, biogenesis, mechanism, and function. Cell. 2004;116(2):281–97. doi: 10.1016/s0092-8674(04)00045-5. [DOI] [PubMed] [Google Scholar]
- 12.Victor A. The functions of animal microRNAs. Nature. 2004;431(7006):350–55. doi: 10.1038/nature02871. [DOI] [PubMed] [Google Scholar]
- 13.Gammell P. MicroRNAs: Recently discovered key regulators of proliferation and apoptosis in animal cells. Cytotechnology. 2007;53(1–3):55–63. doi: 10.1007/s10616-007-9049-4. [DOI] [PMC free article] [PubMed] [Google Scholar]
- 14.Michael C, Cleary MA, Linsley PS. MicroRNAs and cell cycle regulation. Cell Cycle. 2007;6(17):2127–32. doi: 10.4161/cc.6.17.4641. [DOI] [PubMed] [Google Scholar]
- 15.Zhang HC, Han YY, Zhang XM, et al. MiR-522 facilitates the prosperities of endometrial carcinoma cells by directly binding to monoamine oxidase B. Kaohsiung J Med Sci. 2019 doi: 10.1002/kjm2.12107. Epub ahead of print] [DOI] [PMC free article] [PubMed] [Google Scholar]
- 16.Zhuang L, Qu H, Cong J, et al. MiR-181c affects estrogen-dependent endometrial carcinoma cell growth by targeting PTEN. Endocr J. 2019;66(6):523–33. doi: 10.1507/endocrj.EJ18-0538. [DOI] [PubMed] [Google Scholar]
- 17.Wang H, Wang T-T, Lv X-P. Expression and prognostic value of miRNA-29b in peripheral blood for endometrial cancer. Future Oncol. 2018;14(3954):1365–76. doi: 10.2217/fon-2017-0594. [DOI] [PubMed] [Google Scholar]
- 18.Wilczynski M, Danielska J, Domanska-Senderowska D, et al. Association of microRNA-200c expression levels with clinicopathological factors and prognosis in endometrioid endometrial cancer. Acta Obstet Gynecol Scand. 2018;97(5):560–69. doi: 10.1111/aogs.13306. [DOI] [PubMed] [Google Scholar]
- 19.Shannon P, Markiel A, Ozier O, et al. Cytoscape: A software environment for integrated models of biomolecular interaction networks. Genome Res. 2003;13(11):2498–504. doi: 10.1101/gr.1239303. [DOI] [PMC free article] [PubMed] [Google Scholar]
- 20.Bokhman JV. Two pathogenetic types of endometrial carcinoma. Gynecol Oncol. 1983;15(1):10–17. doi: 10.1016/0090-8258(83)90111-7. [DOI] [PubMed] [Google Scholar]
- 21.Amant F, Moerman P, Neven P, et al. Endometrial cancer. Lancet. 2005;366(9484):491–505. doi: 10.1016/S0140-6736(05)67063-8. [DOI] [PubMed] [Google Scholar]
- 22.Chambers JT, Merino M, Kohorn EI, et al. Uterine papillary serous carcinoma. Obstet Gynecol. 2010;115(16):3594–96. [PubMed] [Google Scholar]
- 23.Mhawech-Fauceglia P, Wang D, Kesterson J, et al. Gene expression profiles in stage I uterine serous carcinoma in comparison to grade 3 and grade 1 stage I endometrioid adenocarcinoma. PLoS One. 2012;6(3):e18066. doi: 10.1371/journal.pone.0018066. [DOI] [PMC free article] [PubMed] [Google Scholar]
- 24.Kou N, Liu S, Li X, et al. H19 facilitates tongue squamous cell carcinoma migration and invasion via sponging miR-let-7. Oncol Res. 2019;27(2):173–82. doi: 10.3727/096504018X15202945197589. [DOI] [PMC free article] [PubMed] [Google Scholar]
- 25.Ning MS, Kim AS, Prasad N, et al. Characterization of the Merkle cell carcinoma miRNome. J Skin Cancer. 2014;2014 doi: 10.1155/2014/289548. 289548. [DOI] [PMC free article] [PubMed] [Google Scholar]
- 26.Zhang L, Wang Y, Wang L, et al. MiR-23c suppresses tumor growth of human hepatocellular carcinoma by attenuating ERBB2IP. Biomed Pharmacother. 2018;107:424–32. doi: 10.1016/j.biopha.2018.07.155. [DOI] [PubMed] [Google Scholar]
- 27.Wang Y, Xu M, Yang Q. A six-microRNA signature predicts survival of patients with uterine corpus endometrial carcinoma. Curr Probl Cancer. 2019;43(2):167–76. doi: 10.1016/j.currproblcancer.2018.02.002. [DOI] [PubMed] [Google Scholar]
- 28.Kou N, Liu S, Li X, et al. H19 facilitates tongue squamous cell carcinoma migration and invasion via sponging miR-let-7. Oncol Res. 2019;27(2):173–82. doi: 10.3727/096504018X15202945197589. [DOI] [PMC free article] [PubMed] [Google Scholar]
- 29.Mohanty V, Shah A, Allender E, et al. Folate receptor alpha upregulates Oct4, Sox2 and Klf4 and downregulates miR-138 and miR-let-7 in cranial neural crest cells. Stem Cells. 2016;34(11):2721–32. doi: 10.1002/stem.2421. [DOI] [PubMed] [Google Scholar]
- 30.Kong L, Wei Q, Hu X, et al. MiR-193a-3p promotes radio-resistance of nasopharyngeal cancer cells by targeting SRSF2 gene and hypoxia signaling pathway. Med Sci Monit Basic Res. 2019;25:53–62. doi: 10.12659/MSMBR.914572. [DOI] [PMC free article] [PubMed] [Google Scholar]
- 31.Liu X, Min S, Wu N, et al. MiR-193a-3p inhibition of the Slug activator PAK4 suppresses non-small cell lung cancer aggressiveness via the p53/Slug/L1CAM pathway. Cancer Lett. 2019;447:56–65. doi: 10.1016/j.canlet.2019.01.027. [DOI] [PubMed] [Google Scholar]
- 32.Taurin S, Yang CH, Reyes M, et al. Endometrial cancers harboring mutated fibroblast growth factor receptor 2 protein are successfully treated with a new small tyrosine kinase inhibitor in an orthotopic mouse model. Int J Gynecol Cancer. 2018;28(1):152–60. doi: 10.1097/IGC.0000000000001129. [DOI] [PMC free article] [PubMed] [Google Scholar]
- 33.Winterhoff B, Konecny GE. Targeting fibroblast growth factor pathways in endometrial cancer. Curr Probl Cancer. 2016;41(1):37–47. doi: 10.1016/j.currproblcancer.2016.11.002. [DOI] [PubMed] [Google Scholar]


