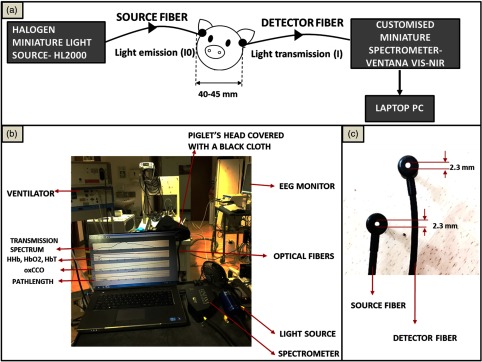
Fig. 1.
miniCYRIL setup in a preclinical study of neonatal HIE. (a) A schematic diagram of the experimental design. (b) miniCYRIL’s components including a miniature white-light source (HL2000-HP), a customized Ventana VIS-NIR miniature spectrometer, optical fibers, and a laptop for the real-time display of concentration data. Light from the halogen light source is emitted onto the piglet brain () through a 0.57-NA optical fiber with 2.3-mm diameter (c). Light transmitted through the brain (I) is collected at tissue surface (SDS: 40 to 45 mm) through an identical optical fiber and transferred to the miniature spectrometer. A MATLAB program then converts the collected spectral data to changes in attenuation and accordingly calculates changes in the concentration of HHb, , and oxCCO based on the measured optical pathlength. The spectral and concentration data are displayed in real time on a laptop screen (b) and saved in a CSV file after each measurement.

