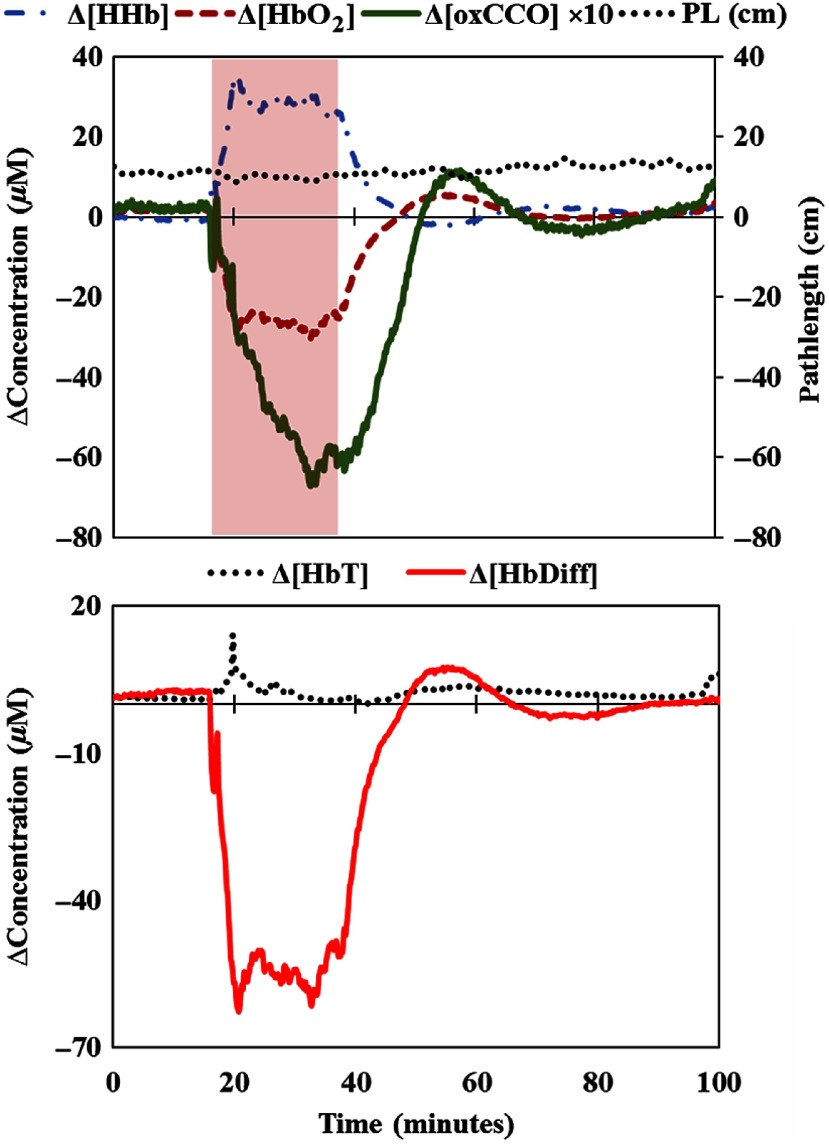
Fig. 8.
An example of changes in the bNIRS measurements during baseline, HI, and recovery in a piglet (LWP498) as measured by miniCYRIL based on the second derivative spectroscopy technique for pathlength change measurement. The shaded area indicates the HI period. There is no change in the optical pathlength during HI and recovery. In this piglet, the HbDiff and oxCCO signals demonstrate a hyperemia and hyperactivation phase after HI (above baseline).

