Abstract
Conventional methods have limitations in measuring femoral neck torsion angle (FNTA) of patients with femoral deformities. A new method of three-dimensional (3D) reconstruction technology based on computer tomography (CT) was proposed to enhance measurement accuracy and applicability in this study.
Bilateral FNTA of 50 developmental dysplasia of the hip (DDH) patients (DDH group) and 81 volunteers (normal group) were measured by Mimics software based on CT data with the marker lines determined by centerline and curvature. Each FNTA was measured by observer A and observer B for twice separately. 50 DDH patients were classified into 3 groups (group I, II, III) according to Hartofilakidis classification. The statistical analysis of the differences was made among the measurements of the FNTA.
The FNTA values were 27.56° ± 12.48° in DDH group and 21.22° ± 8.14° in normal group with significant difference (t = 4.516, P < .001). The FNTA values were 24.53° ± 2.40° in group I, 29.78° ± 1.83° in group II and 39.08° ± 3.13° in group III, with significant difference (F = 7.568, P = .001).
The accuracy, reliability and applicable scope of FNTA measurement can be improved by 3D reconstruction in clinical practice. The applicable scope of this method included normal people and patients with femoral deformities. The FNTA of DDH patients is significantly larger than normal volunteers with a positive correlation between the severity of classification. This study will also provide references for preoperative design of Chinese population.
Keywords: CT measurement, developmental dysplasia of the hip, femoral neck torsion angle, Hartofilakidis classification, three-dimensional reconstruction
1. Introduction
Femoral neck torsion angle (FNTA) is the angle between the coronal plane of the femoral neck and the coronal plane of the femoral condyles. It refers to the twist between distal and proximal parts of the femur on the transverse plane, forming as a result of heredity, fetal development, and mechanical forces.[1,2] Several publications reported that torsional deformities could cause various diseases in hip and knee, including femoroacetabular impingement, patella femoral instability, pediatric in-toeing or out-toeing gait and so on.[3,4] For the patients with DDH, which usually have torsional deformities, femoral derotational osteotomy around the hip joint, and total hip replacement have been used for decades.[5,6] During the operation, the torsional deformities should be corrected according to the preoperative measurement of FNTA. Beyond these, FNTA is commonly measured in patients with femoral neck fracture, slipped capital femoral epiphysis, hip instability, osteoarthritis, cerebral palsy and so on. Therefore, finding an accurate and reproducible way to measure FNTA preoperatively is essential.[7–9] Published results vary widely in different studies, which indicates that difficulties persist in carrying out exact measurements.[10] One of the problems is that researchers used to confuse FNTA with femoral neck anteversion angle (FNA). FNA is the angle between the axis of femoral neck and the coronal plane of the femoral condyles. FNTA can be regarded as the projection of FNA when the femur is viewed along its proximal axis from above (Fig. 1). The other problem is that it is hard to select marker points or axes, especially the femoral neck axis, in conventional methods since FNTA is an angle in three-dimension. In this research, we decided to define femoral neck axis through centerline and curvature three-dimensionally. Compared with other methods normally used now, 3D reconstruction technology can be the most intuitive and direct method to measure FNTA without series of limitations.[11] Also the result of measurement can be the most reliable with minimum error since the definitions of marker lines are the most precise. FNTA is commonly measured in surgical treatment of DDH, to an extent it can affect clinical decisions, so we decided to explore the relation between FNTA and the classification of DDH on clinic.[12] The aim of this study was to provide accurate reference data for the femoral anatomical morphology of Chinese population and help with preoperative design of DDH patients.
Figure 1.
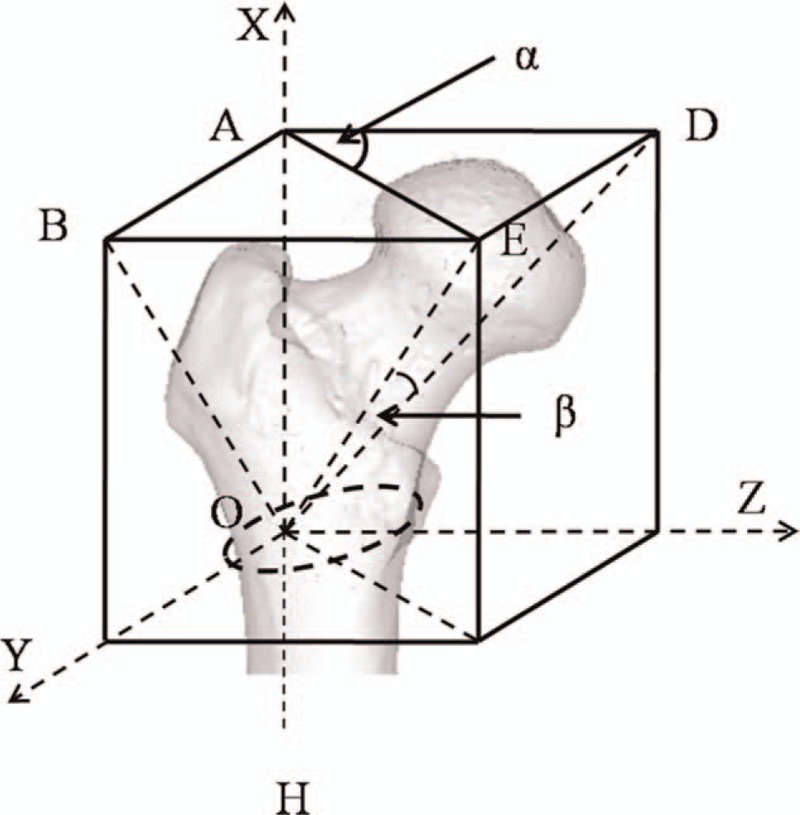
Definition of FNTA and FNA. E: femoral head center OE: femoral neck axis OH: femoral proximal shaft axis ∠α: FNTA ∠β: FNA.
2. Materials and methods
2.1. Groups
This study was approved by our institutional internal review board (No. 146 in 2018). All patients and volunteers enrolled in the study provided written informed consent. The radiation of CT was informed to all volunteers and every volunteer was compensated by 400 RMB. 51 DDH patients and 84 normal volunteers attended in this study. 1 DDH patients were excluded due to the age. 3 volunteers were excluded due to the history of femoral fracture. At last, 50 DDH patients and 81 volunteers were adopted in this study. The inclusion criteria were listed as follows:
DDH patients:
-
1.
age: >18 years
-
2.
diagnosed as DDH patients without the history of femoral fracture.
Normal volunteers:
-
1.
age: >18 years
-
2.
volunteers without the history of femoral fracture
-
3.
volunteers without congenital malformation.
Examinations were carried out on a Philips iCT 256 CT scanner at 156 mA and 120 KVP with a slice thickness of 0.602 mm. The CT-scan data was collected from 50 patients with primary diagnoses of DDH and 81 normal volunteers, it contained the section from hip to the distal end of the femur in this research. The DDH group consisted of DDH patients with a mean age of 53 years (age range, 23–84). The normal group consisted of normal volunteers with a mean age of 20 years (age range, 18–21). Bilateral FNTA of each person were measured by Mimics software (v19.0, Materialise, Belgium) with CT data. According to the classification of Hartofilakidis I, II, and III,[13] 100 femora of all 50 DDH patients were classified into 3 groups: 27 femora in group I, 38 femora in group II and 13 femora in group III (22 of the whole 100 femora were normal in structure and function, considered as group 0).
2.2. Reconstruction of 3D femur model
Mimics software was used to observe and analyze CT images in sagittal, coronal, and frontal planes after the CT data was imported (Fig. 2A, 2E). At first, the function of bone CT segmentation was used to detect the femur and distinguish it from muscles, ligaments, soft tissues and other physical structure (Fig. 2B, 2F). Then the femur was filled with markers in order to make preparation for 3D calculation. Finally the femur could be analyzed in any angle of view since the 3D reconstruction had been completed.
Figure 2.
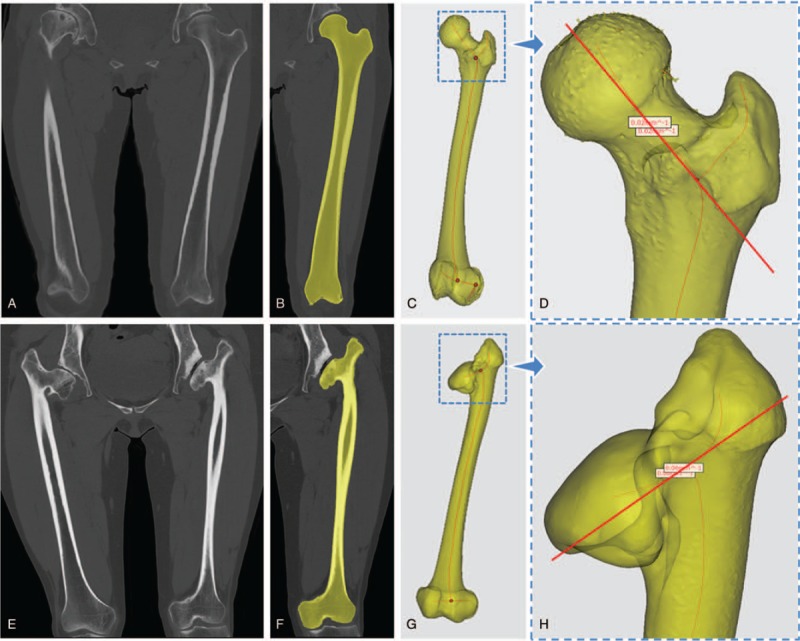
Femoral nack axis determined by centerline and curvature. A, E: CT images of normal volunteer and DDH patient. B, F: mask of the femur separated from muscles, liagments and soft tissues. C, G: femoral centerline in the mode of transparency. D, H: points with minimal curvature to determin femoral neck axis.
2.3. Selection of marker lines
In the mode of transparency, the centerline could be extracted within the femur if the parameters had been adjusted to appropriate numeric values (Fig. 2C, 2G). When we zoomed in the 3D image and focused on the middle part of femoral neck, 2 points could be selected with minimal curvature by the function of curvature in the measurement menu. The coordinates of these 2 points could be exported and recorded in order to draw femoral neck axis manually by keyboarding the 2 coordinates (Fig. 2D, 2H). Another essential line to determine FNTA was the femoral proximal shaft axis. It was defined as the line connecting the central part of the intercondylar notch and trochanteric fossa.[14] The posterior condylar line was the line which connected the posterior condyles of distal femur (Fig. 3).
Figure 3.
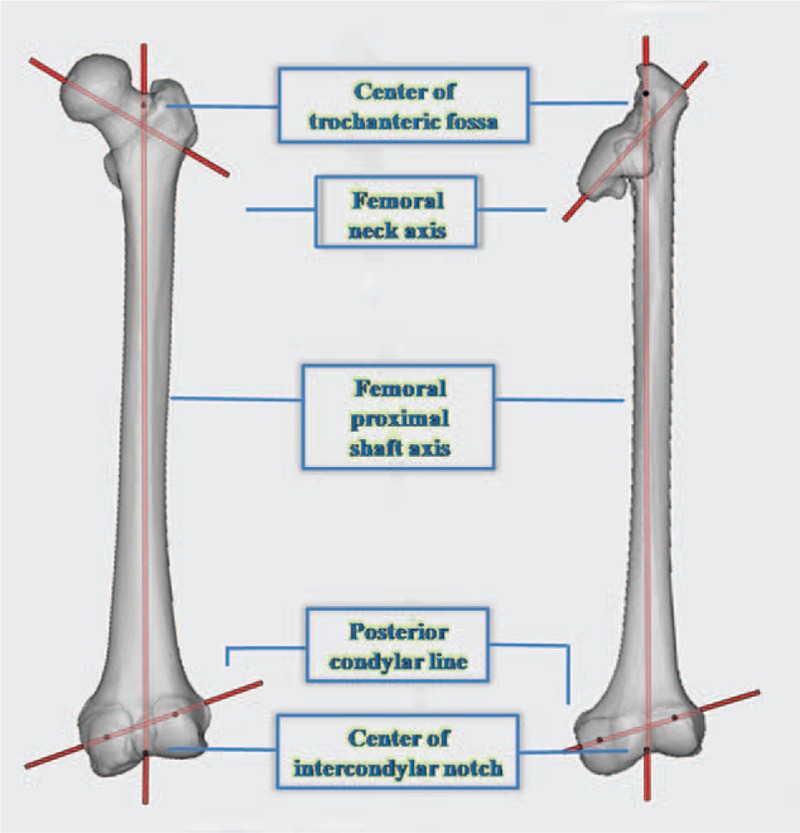
Marker points and lines to determin FNTA. Center of trochanteric fossa and center of intercondylar notch can determin the femoral proximal shaft axis. Femoral neck axis, posterior condylar line and femoral proximal shaft axis can determin the FNTA.
2.4. Measurement of FNTA by X-ray projection
When the femoral proximal shaft axis was defined, the function of X-ray reconstruction could be used to measure FNTA (Fig. 4A). Compared with conventional X-ray in 2D, the X-ray reconstruction could actually indicate the projection which was perpendicular to the femoral proximal shaft. The angle of view should be slowly adjusted until the femoral proximal shaft axis gradually shortened to be a point, which illustrated the view was observed along the femoral proximal shaft axis (Fig. 4B). When the virtual X-ray was created, the angle between the femoral neck axis and posterior condylar line was FNTA (Fig. 4C). FNTA was measured by the tools in Mimics software.
Figure 4.
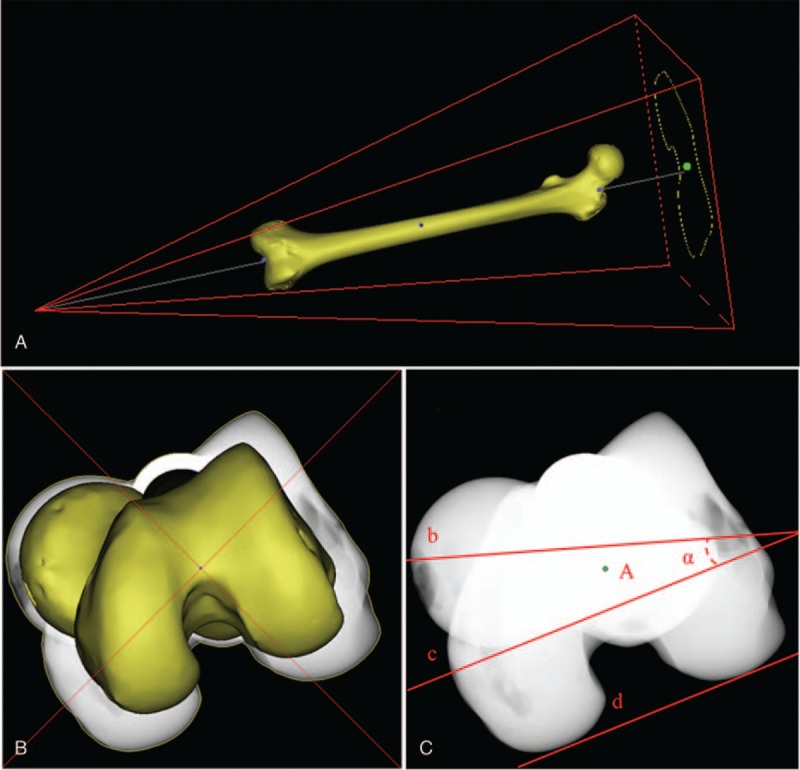
X-ray projection of the femur to measure FNTA. A: X-ray reconstruction B: X-ray projection along the femoral proximal shaft axis. C: point A: femoral proximal shaft axis line b: femoral neck axis line c: parallel line of d line d: posterior condylar line ∠α: FNTA.
2.5. Statistical analyze
SPSS software (v21.0, IBM, America) statistical software was used to do the statistical analysis. Normal distribution and estimated distribution parameters were tested for the DDH and Normal group. Inter-observer and intra-observer reliability were evaluated by intraclass correlation coefficient (ICC), 95% confidence interval (CI) with a 2-way random model, absolute agreement for single measures. The data was presented by mean ± standard deviation of each group. The values of FNTA between DDH group and normal group were analyzed by independent samples T test. A one-way analysis of variance, followed by a Scheffe test were used to detect the FNTA among the 3 groups of DDH patients. The P value less than .05 was considered to be significant.
3. Results
3.1. Inter-observer and intra-observer reliability
According to the results of statistical analysis, all statistics followed normal distribution with research significance. There was high inter-observer and intra-observer reliability for 2 observers, the ICC of each variable was in the range of its 95% confidence interval (CI) (Table 1). The results showed that there was no difference within or between the observers and the statistically acceptable coefficients of reproducibility was obtained. In DDH group, the ICC of observer A and B were 0.992 (95% CI 0.988–0.995) and 0.994 (95% CI 0.990–0.996), the ICC between observer A and B were 0.994 (95% CI 0.991–0.997), and 0.994 (95% CI 0.990–0.996). In normal group, the ICC of observer A and B were 0.991 (95% CI 0.988–0.994) and 0.991 (95% CI 0.988–0.994), the ICC between observer A and B were 0.997 (95% CI 0.995–0.997) and 0.988 (95% CI 0.984–0.991).
Table 1.
Inter-observer and intra-observer reliability estimated by intraclass correlation coefficient (ICC).

3.2. Comparison of DDH group and Normal group
Every FNTA was determined by the mean values of 2 observers. The values of FNTA were 27.56° ± 12.48° in DDH group and 21.22° ± 8.14° in Normal group (Table 2). The independent samples t test was used to compare the difference between DDH and Normal group. The results indicated P < .05 in 2-tailed test (t = 4.516, P < .001).
Table 2.
The femoral neck torsion angle of developmental dysplasia of the hip (DDH) group and normal group.

3.3. Comparison of group I, group II, and group III
The mean value of FNTA were 24.53° ± 9.24° in group I, 29.78° ± 11.75° in group II and 39.08° ± 12.62° in group III (Table 3). One-way analysis of variance was used to analyze the difference of the 3 groups and the results indicated P < .05 (Table 4). Scheffe test was used to analyze the difference between any 2 groups of the3 . The results indicated P < .05 between group I and III, II, and III (Table 5).
Table 3.
The femoral neck torsion angle of group I, II and III.

Table 4.
Statistical analysis of femoral neck torsion angle by classification of developmental dysplasia of the hip.

Table 5.
Multiple comparisons of group I, II and III.

4. Discussion
There are many feasible methods for the measurement of FNTA, including sinus wave method, 45-degree radio graphic method, biplanar, Dunn axial roentgenography, ultrasound, MRI, and CT.[5] However, actually most of them have limitations. Toogood et al measured directly on bones in anatomy but not applicable on clinic.[15] Radiography is inaccurate owing to the exact positioning requirement of patients.[16] Ultrasound can be a proper method, but it relies too much on the experience of the operator.[17] Conventional 2D CT method is supposed to provide accurate measurement, but the femoral head and neck cannot be observed at the same time in general single CT section. Thus, the error of measurement exists in locating the femoral neck axis and other marker lines.[18] In the technology of oblique axial CT reconstruction, it still needs patient to maintain special positions for scanning. Sometimes because of pain, flexion contracture or swelling, the femur is not exactly aligned with the CT axis and it will lead to errors.[5,9] Nearly all previous studies selected normal people to measure, however there were some exceptions during clinical work such as the DDH patients. In DDH patients, the marker lines are hard to define because the femoral head and neck of DDH patients are usually in irregular shapes. In order to avoid these disadvantages and measure FNTA directly and clearly for normal volunteers as well as DDH patients, we decided to use 3D reconstruction technology based on CT.
Actually, no matter which method was used to measure the FNTA, the accurate determination of the femoral neck axis was the most important step. Researchers used to suppose the femoral head and femoral neck as a sphere and a cylinder,[18] the femoral neck axis could be determined by the connecting line of the 2 center points. However, in many cases such as DDH patients, both femoral head and femoral neck are abnormal and irregular, which cannot be abstracted into regular shapes. [19] Conventional methods cannot solve this problem since the specificity of DDH patients, and other patients with anatomical deformities. In this research, centreline, and curvature were applied to determine the femoral neck axis after the reconstruction of 3D femur model. Definitely, the difficulties in measuring FNTA of people with femoral deformities could be solved through this way. Besides, The femoral proximal shaft axis was defined as the line connecting the middle of the intercondylar notch and trochanteric fossa. Compared to the femoral shaft axis (the middle of the intercondylar notch to greater trochanter), the marker line we chose could better fit the definition of proximal axis. As just described, the measurement of FNTA depends on accurate location of the marker lines and the method we used could minimize the errors.
In some articles, researchers used to confuse FNTA with FNA, but actually these 2 angles are quite different conceptions in definition. Actually, there is a numerical relation between FNTA, FNA and neck-shaft angle (NSA) since FNTA can be regarded as the projection of FNA along the femoral proximal shaft axis (Fig. 5). It can be proved mathematically:
 |
Figure 5.
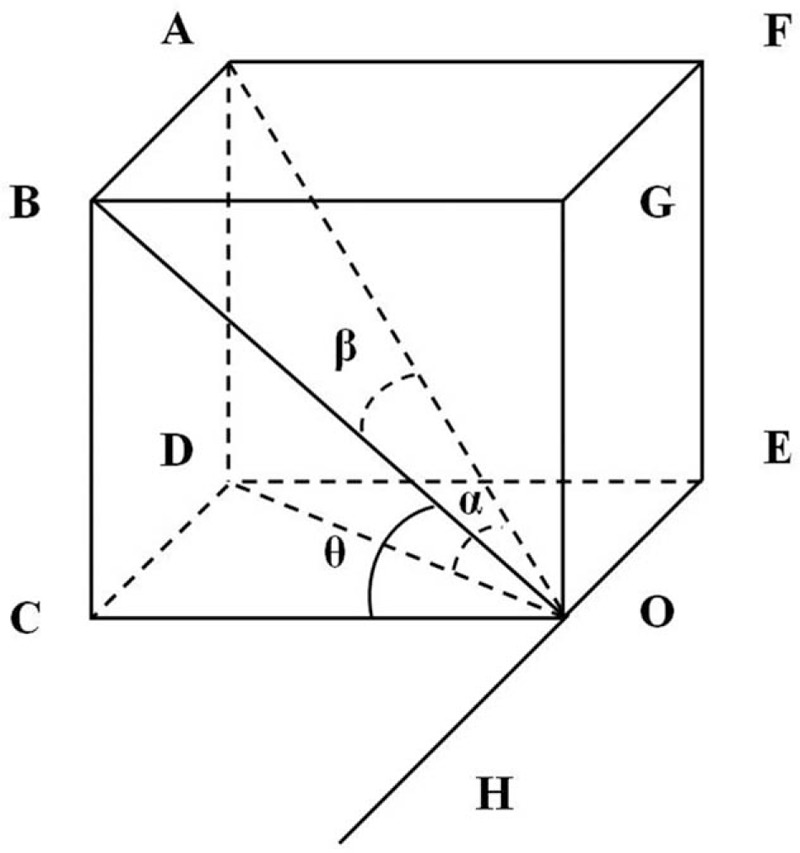
Geometrical schematic of proximal femur. ∠AOD (α): FNA ∠BOC (θ): FNTA ∠AOH: NSA ∠AOB (β) = ∠AOH - 90° AO: femoral neck axis OH: femoral proximal shaft axis.
Compared to the previous study reported by Yin et al with the similar conclusion,[5] the result of this study is simplified and much easier to calculate the angle. Through this method, we can easily conclude that FNTA is larger than FNA in nearly all cases. Only when the NSA is 90°, can FNA be equal to FNTA in number. But actually the value of NSA is usually fixed in number with a mean of 129° and a range of 105°-140°.[15] Through this method, FNA can be calculated if FNTA and NSA have been measured both, which will obviously simplify the measurement of FNA and improve accuracy.
The results of this research reveal that the FNTA of DDH patients is usually larger than normal people. It can cause various pathologies of hip and knee, including femoroa cetabular impingement, patella femoral instability, pediatric in-toeing or out-toeing gait, and so on. The treatment of this femoral deformity consists of derotational osteotomies, which has been used for decades in DDH patients.[4,20] In the preoperative planning, in order to be more accurate, FNTA can be regarded as the quantitative standard of femoral external-rotation rather than FNA. The femoral external-rotation angle is defined as the difference between abnormal side FNTA and normal side FNTA. For example, if we suppose a DDH patient's NSA to be 135°, abnormal side FNA is 30°, normal side FNA is 15°, the difference is 15°. According to the mathematical relation, we can calculate that FNTA of the abnormal side is 45°, FNTA of the normal side is 21.5°, the difference is 22.5°, and the femoral external-rotation should be 22.5° instead of 15°. If the operator selects 15° as femoral external-rotation angle, it will cause FNTA to be corrected deficiently. Similar situations usually happen in total hip arthroplasty (THA). During the operation, the “FNA” is supposed to be adjusted by the observation of femoral stem and horizontal plane along the view of femoral proximal shaft axis. Actually the “FNA” here is very close to the FNTA in definition (Fig. 6) and sometimes this misunderstanding will cause errors of intra-operative measurement. For example, if the real FNA is supposed to be 15°, according to the mathematical relation mentioned before, the FNTA should be adjusted to 21.5°. However, if the “FNA” (real FNTA) is adjusted to be 15°, the real FNA is only 10.5°. The NSA is supposed to be 135° for convenient calculation and the difference can reduce certain degrees since the NSA is in a range of 105° to 140° in most people. Sometimes the difference can be ignored, it will not affect the results of operation and postoperative recovery. However, in some particular patients, the difference of intra-operative measurement and postoperative measurement can be huge and increase the risk of failure. Therefore, whether in derotational osteotomies or THA, it all needs preoperative measurement to rationalize surgical planning, intra-operative measurement to ensure enough corrective angle, postoperative measurement to test and evaluate surgical effects. Even a little improvement in measurement accuracy can affect the results of operation and recovery or decrease the hidden risk of redislocation.
Figure 6.
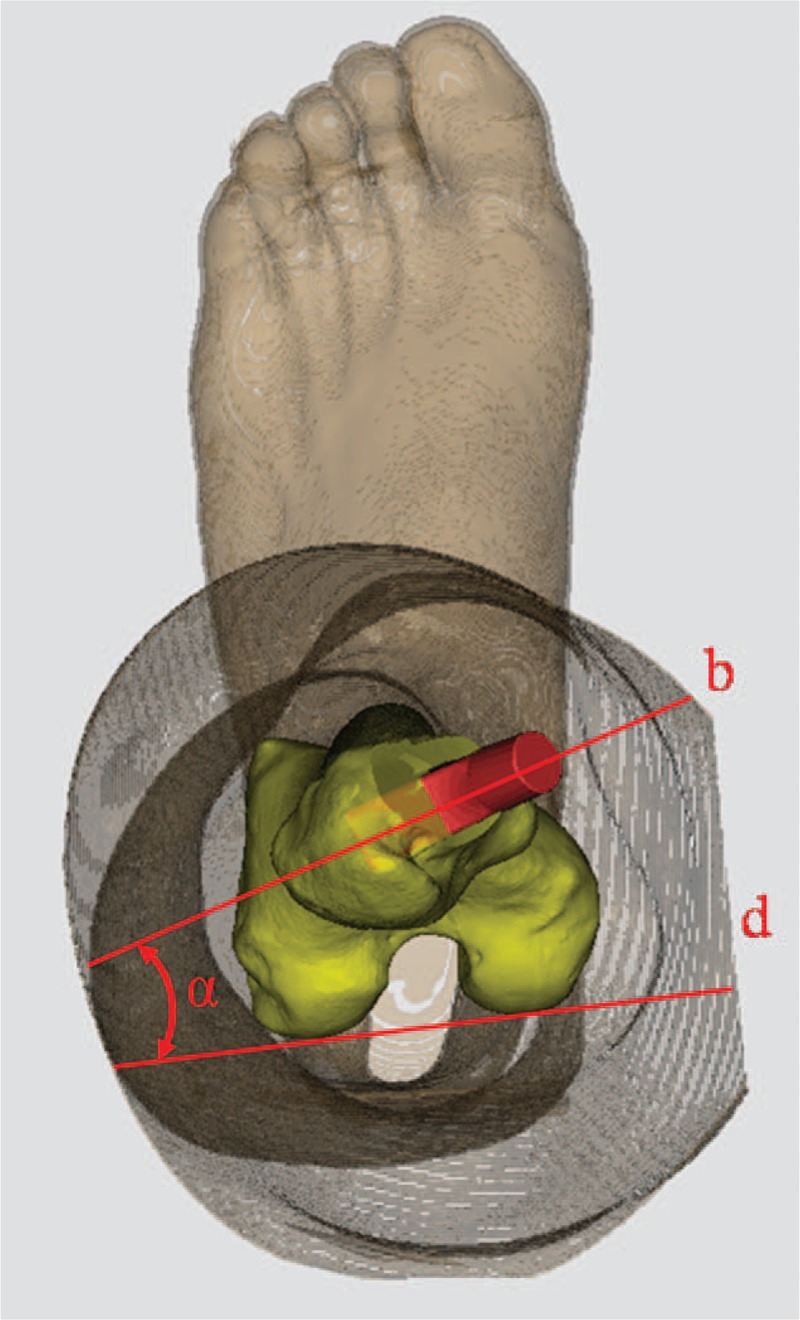
The intra-operative measurement of ‘FNA’. line b: femoral neck axis line d: posterior condylar line ∠α: ‘FNA’. The ‘FNA’ here is actually the FNTA.
The results of this research indicated that the FNTA of DDH patients was 6.3° larger than normal volunteers. The FNTA of DDH patients could not be estimated on the basis of normal volunteers in measurement and preparation before surgery. The mean value of FNTA of Chinese normal volunteers and DDH patients need to be measured, because there were significant ethnic differences in FNTA.[10] The results of our measurement in FNTA of Chinese normal volunteers were well consistent with related literatures in China. Yin et al. reported that the mean value of FNTA of Chinese women was 22.0° ± 8.4°.[5] This can be regarded as an affirmation for the new method we used.
DDH leads to multiple surgical treatments based on the evaluation of anatomical changes.[21] The Crowe classification and Hartofilakidi classification are usually used as the standard on clinic according to the dislocation of femur. In this research, Hartofilakidi classification was used to classify the femora of all 50 DDH patients. The mean value of FNTA are 24.53° ± 9.24° in group I, 29.78° ± 11.75° in group II and 39.08° ± 12.62° in group III, which indicated that FNTA increased with the increased severity of classification. 22 of the whole 100 femora of DDH patients (group 0) mentioned before sustained normal structure and function, they could not be classified according to the Hartofilakidi classification. The mean value of these FNTA (20.62° ± 11.88°, range 1.26°–48.87°) was close to normal volunteers (21.22° ± 8.14°, range 2.09°–41.44°) (Fig. 7). This could be regarded as the relation between normal volunteers and DDH patients, also it proved the method we used could be applied to both normal volunteers and DDH patients. Different classifications of DDH patients have different clinical manifestations and treatments. For the patients in Hartofilakidi I and II, doctors usually suggest periacetabular osteotomy or pelvis osteotomy. For the patients in Hartofilakidi III, total hip arthroplasty is considered as the best treatment option.[19] Therefore, the exact relation between FNTA and the classification of DDH was confirmed for the first time in this research and it might lead great significance in diagnosis and treatment to offer better services for clinic.
Figure 7.
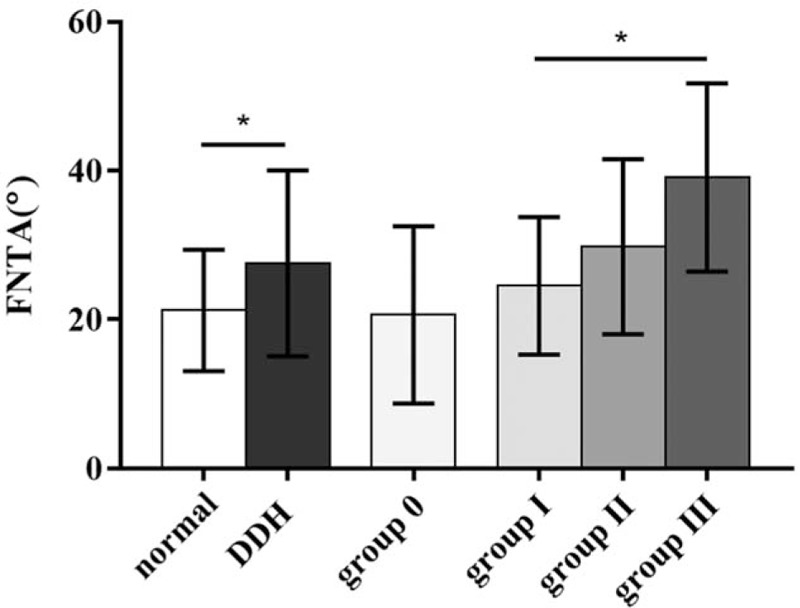
Bar graph of mean (± SD) FNTA measured using 3D reconstruction. Error bars denote SDs. Asterisks denote statistically significant differences (p < .05).
Although the results of one-way analysis of variance indicated difference among group I, group II and group III, there was no significant difference between group I and group II (P = .177) in the following multiple comparisons of groups. The problem would be solved in future work with larger sample size.
5. Conclusion
3D reconstruction technology can be used to measure FNTA on clinic without conventional limitations. Both the measurement accuracy and applicability are improved compared with other methods. The FNTA of DDH patients is significantly larger than normal volunteers with a positive correlation between the severity of classification. This study will provide accurate reference data for the femoral anatomical morphology of Chinese population and help with preoperative design of DDH patients.
Author contributions
Conceptualization: Qing Han, Jincheng Wang.
Data curation: Jincheng Wang.
Investigation: Aobo Zhang, Kerong Yang.
Methodology: Qing Han, Aobo Zhang.
Project administration: Qing Han, Chenyu Wang.
Resources: Jincheng Wang.
Software: Aobo Zhang.
Supervision: Jincheng Wang.
Writing – original draft: Aobo Zhang.
Writing – review & editing: Qing Han, Kerong Yang.
Footnotes
Abbreviations: 3D = three-dimensional, CI = confidence interval, CT = computer tomography, DDH = developmental dysplasia of the hip, FNA = femoral neck anteversion angle, FNTA = femoral neck torsion angle, ICC = intraclass correlation coefficient, MRI = magnetic resonance imaging, NSA = neck-shaft angle, THA = total hip arthroplasty.
How to cite this article: Han Q, Zhang A, Wang C, Yang K, Wang J. Application of three-dimensional reconstruction to improve the preoperative measurement accuracy and applicability of femoral neck torsion angle. Medicine. 2019;98:45(e17727).
JW and AZ contributed equally to this work and should be considered co-corresponding authors.
All the tests were approved by the ethics committee of our hospital (No. 146 in 2018). This study was conducted in accordance with the principles outlined in the Declaration of Helsinki. Informed consent was obtained from all individual participants included in the study. None of the authors have any conflicts of interest to disclose. This work was supported by (1) National Natural Science Foundation of China [grant numbers 81802174]; (2) Department of Science and Technology of Jilin Province, P.R.C [grant numbers 20170204004GX]; (3) Jilin Province Development and Reform Commission, P.R.C [grant numbers 2018C010].
None conflict of interest was declared.
References
- [1].Kaiser P, Attal R, Kammerer M, et al. Significant differences in femoral torsion values depending on the CT measurement technique. Arch Orthop Trauma Surg 2016;136:1259–64. [DOI] [PMC free article] [PubMed] [Google Scholar]
- [2].Souza AD, Ankolekar VH, Padmashali S, et al. Femoral neck anteversion and neck shaft angles: determination and their clinical implications in fetuses of different gestational ages. Malays Orthop J 2015;9:33–6. [DOI] [PMC free article] [PubMed] [Google Scholar]
- [3].Bruderer-Hofstetter M, Fenner V, Payne E, et al. Gait deviations and compensations in pediatric patients with increased femoral torsion. J Orthop Res 2015;33:155–62. [DOI] [PubMed] [Google Scholar]
- [4].Dickschas J, Harrer J, Reuter B, et al. Torsional osteotomies of the femur. J Orthop Res 2015;33:318–24. [DOI] [PubMed] [Google Scholar]
- [5].Yin Y, Zhang L, Hou Z, et al. Measuring femoral neck torsion angle using femoral neck oblique axial computed tomography reconstruction. Int Orthop 2015;40:371–6. [DOI] [PubMed] [Google Scholar]
- [6].Ollivier M, Parratte S, Le Corroller T, et al. Anatomy of the proximal femur at the time of total hip arthroplasty is a matter of morphotype and etiology but not gender. Surg Radiol Anat 2015;37:377–84. [DOI] [PubMed] [Google Scholar]
- [7].Teo PC, Kassim AY, Thevarajan K. A 45-degree radiographic method for measuring the neck shaft angle and anteversion of the femur: a pilot study. J Orthop Surg (Hong Kong) 2013;21:340–6. [DOI] [PubMed] [Google Scholar]
- [8].Byun HY, Shin H, Lee ES, et al. The availability of radiological measurement of femoral anteversion angle: three-dimensional computed tomography reconstruction. Ann Rehabil Med 2016;40:237–43. [DOI] [PMC free article] [PubMed] [Google Scholar]
- [9].Morvan G, Guerini H, Carre G, et al. Femoral torsion: impact of femur position on CT and stereoradiography measurements. AJR Am J Roentgenol 2017;209:W93–9. [DOI] [PubMed] [Google Scholar]
- [10].Hartel MJ, Petersik A, Schmidt A, et al. Determination of femoral neck angle and torsion angle utilizing a novel three-dimensional modeling and analytical technology based on CT datasets. PloS One 2016;11:e0149480. [DOI] [PMC free article] [PubMed] [Google Scholar]
- [11].Park KK, Tsai TY, Dimitriou D, et al. Utility of preoperative femoral neck geometry in predicting femoral stem anteversion. J Arthroplasty 2015;30:1079–84. [DOI] [PubMed] [Google Scholar]
- [12].Argenson J-N, Ryembault E, Flecher X, et al. Three-dimensional anatomy of the hip in osteoarthritis after developmental dysplasia. J Bone Joint Surg Br 2005;87-B:1192–6. [DOI] [PubMed] [Google Scholar]
- [13].Yiannakopoulos CK, Xenakis T, Karachalios T, et al. Reliability and validity of the Hartofilakidis classification system of congenital hip disease in adults. Int Orthop 2009;33:353–8. [DOI] [PMC free article] [PubMed] [Google Scholar]
- [14].Tsukeoka T, Tsuneizumi Y, Lee TH. The T-line as an intraoperative landmark for reproducing the native femoral anteversion during hip arthroplasty. Arch Orthop Trauma Surg 2014;134:873–9. [DOI] [PubMed] [Google Scholar]
- [15].Toogood PA, Skalak A, Cooperman DR. Proximal femoral anatomy in the normal human population. Clin Orthop Relat Res 2009;467:876–85. [DOI] [PMC free article] [PubMed] [Google Scholar]
- [16].Jaarsma RL, Bruggeman AWA, Pakvis DFM, et al. Computed tomography determined femoral torsion is not accurate. Arch Orthop Trauma Surg 2004;124:552–4. [DOI] [PubMed] [Google Scholar]
- [17].Hafiz E, Hiller CE, Nicholson LL, et al. Development of a method for measuring femoral torsion using real-time ultrasound. Physiol Meas 2014;35:1335–48. [DOI] [PubMed] [Google Scholar]
- [18].Buck FM, Guggenberger R, Koch PP, et al. Femoral and tibial torsion measurements with 3D models based on low-dose biplanar radiographs in comparison with standard CT measurements. AJR Am J Roentgenol 2012;199:W607–12. [DOI] [PubMed] [Google Scholar]
- [19].Kotlarsky P, Haber R, Bialik V, et al. Developmental dysplasia of the hip: What has changed in the last 20 years? World J Orthop 2015;6:886–901. [DOI] [PMC free article] [PubMed] [Google Scholar]
- [20].Mao C, Liang Y, Ding C, et al. The consistency between measurements of the femoral neck anteversion angle in DDH on three-dimensional CT and MRI. Acta Radiol 2016;57:716–20. [DOI] [PubMed] [Google Scholar]
- [21].Clave A, Kerboull L, Musset T, et al. Comparison of the inter- and intra-observer reproducibility of the Crowe, Hartofilakidis and modified Cochin classification systems for the diagnosis of developmental dysplasia of the hip. Orthop Traumatol Surg Res 2014;100(6 Suppl):S323–6. [DOI] [PubMed] [Google Scholar]


