

Abstract
The hippocampus is one of the earliest sites involved in the pathology of Alzheimer's disease (AD). Therefore, we specifically investigated the sensitivity and specificity of hippocampal volume and glucose metabolism in patients being evaluated for AD, using automated quantitative tools (NeuroQuant – magnetic resonance imaging [MRI] and Scenium – positron emission tomography [PET]) and clinical evaluation.
This retrospective study included adult patients over the age of 45 years with suspected AD, who had undergone fluorodeoxyglucose positron emission tomography-computed tomography (FDG-PET-CT) and MRI. FDG-PET-CT images were analyzed both qualitatively and quantitatively. In quantitative volumetric MRI analysis, the percentage of the total intracranial volume of each brain region, as well as the total hippocampal volume, were considered in comparison to an age-adjusted percentile. The remaining brain regions were compared between groups according to the final diagnosis.
Thirty-eight patients were included in this study. After a mean follow-up period of 23 ± 11 months, the final diagnosis for 16 patients was AD or high-risk mild cognitive impairment (MCI). Out of the 16 patients, 8 patients were women, and the average age of all patients was 69.38 ± 10.98 years. Among the remaining 22 patients enrolled in the study, 14 were women, and the average age was 67.50 ± 11.60 years; a diagnosis of AD was initially excluded, but the patients may have low-risk MCI. Qualitative FDG-PET-CT analysis showed greater accuracy (0.87), sensitivity (0.76), and negative predictive value (0.77), when compared to quantitative PET analysis, hippocampal MRI volumetry, and specificity. The positive predictive value of FDG-PET-CT was similar to the MRI value.
The performance of FDG-PET-CT qualitative analysis was significantly more effective compared to MRI volumetry. At least in part, this observation could corroborate the sequential hypothesis of AD pathophysiology, which posits that functional changes (synaptic dysfunction) precede structural changes (atrophy).
Keywords: Alzheimer's disease, fluorine 18 fluorodeoxyglucose, magnetic resonance imaging, positron emission tomography, Software Database Comparison, Software NeuroQuant, structural magnetic resonance
1. Introduction
Alzheimer's disease (AD) is a progressive neurodegenerative disorder associated with disruption of neuronal function and gradual deterioration in cognition, daily life activities, and behavior.[1] This disease often initially presents as mild cognitive impairment (MCI), typically involving memory, and advances to continuous deterioration in executive functions, language skills, and ability to perform daily living activities. However, annually only 15% of MCI patients receive a diagnosis of AD.[2] There is a high-risk MCI subtype (amnestic MCI), which has features that are very similar to those of AD. The diagnosis of amnestic MCI is clinical, based on the presence of memory impairment that can be identified in neuropsychological tests, but in the context of normal daily life activities, therefore implying that the individual is independent.[3] Eventually, patients with amnestic MCI may develop AD and known in vivo biomarkers can be found such as decreased cerebrospinal fluid (CSF) levels of amyloid β, a fluorodeoxyglucose positron emission tomography-computed tomography (FDG-PET-CT) pattern of AD, and magnetic resonance imaging (MRI) hippocampal atrophy. If we take into account these aforementioned biomarkers and the risk of progression from MCI to AD dementia it is demonstrated the strength of association between biomarkers at baseline and cognitive/functional decline at follow-up. Therefore, either the amnestic subtype of MCI or the presence of a single or multiple biomarkers at the time of MCI diagnosis may suggest the likelihood of conversion from MCI to AD.[3–10] Finally, the presence of the apolipoprotein E e4 allele is also known to be a risk factor to develop AD in amnestic MCI patients, also influencing the age of AD onset.[11]
The pathophysiological process of AD is thought to begin many years before diagnosis. The leading theory on AD pathophysiology is the amyloid hypothesis, which postulates that an imbalance between the production and clearance of the protein amyloid-β (Aβ) results in accumulation of amyloid plaques, and soluble amyloid, in brain tissue. The resulting Aβ build-up leads to a cascade of events including neuronal dysfunction, inflammatory response, dysregulation of tau protein phosphorylation, accumulation of intracellular neurofibrillary tangles, neurotransmitter deficits, and neuronal death, culminating in neurodegeneration, loss of gray matter, and cognitive impairment.[12–15]
The role of neuroimaging in AD diagnosis has progressed greatly over the last few years, especially after the pathophysiological biomarkers, that is, Aβ42, total tau, and phosphorylated tau were identified and incorporated into the assessment of cognitively impaired patients.[14] Structural MRI is a useful tool for predicting progression from MCI to AD, as well as excluding non-AD patients, through volumetric measurement of hippocampal formation, entorhinal cortex, whole brain, and ventricular volumes, which are helpful in clinical evaluation.[3] Fluorine 18 fluorodeoxyglucose (18F-FDG) positron emission tomography (PET) is a functional imaging modality, frequently used in the detection of synaptic damage to diagnose dementing neurodegenerative disorders.[16]
Both FDG-PET and MRI can demonstrate some of the neurodegenerative processes associated with AD, even in the preclinical stages.[14,17–24] A distinctive pattern of hypometabolism (ie, involving the posterior cingulate, precuneus, and/or temporoparietal cortices) on FDG-PET-CT,[17,23] and hippocampal atrophy on volumetric MRI,[20,21] are among the AD neuronal/synaptic injury markers with the greatest validation in the literature.[14] Automated tools for neuroimaging evaluation are able to provide volumetric measurements of brain structures and aid in comparison of volumes to a normative database adjusted for age, sex, and intracranial volume (ICV) (NeuroQuant Software),[25,26] as well as automatically identify patterns of hypermetabolism and hypometabolism in FDG-PET-CT images of abnormal brain regions, which are optimized for AD evaluation (Scenium Software). This data imaging software is approved by the Food and Drug Administration.
A well-known hypothetical model of the biomarker dynamics for AD suggests that synaptic dysfunction, evidenced by FDG-PET-CT or functional MRI, precedes the structural changes detected by volumetric MRI.[14] However, although synaptic dysfunction, neurodegeneration, and atrophy are certainly interconnected entities, some studies have reported that there are significant discrepancies between metabolic and structural findings (regarding spatial distribution and amplitude),[20,27] and published data suggest that these events may actually be concomitant.[20] Overall, MRI studies based on T1-weighted images point to the hippocampus as the brain region with the highest rate of early detectable atrophy in AD.[28,29] FDG-PET-CT studies, in contrast, highlight early hypometabolism in the posterior associative cortical areas, particularly in the posterior cingulate.[17,23,30] This divergence between structural and functional changes, specifically hypometabolism evident in areas without significant atrophy, have raised the hypothesis of disconnection, according to which gray matter atrophy could disrupt white matter tracts, and then induce hypometabolism in distant interrelated regions.[31] Therefore, at least to some extent, AD could be described as a “disconnection syndrome” compromising different cerebral regions of the same brain network, which will have imperative consequences on the imaging findings of different modalities, and; therefore, diagnosis.
Another issue regarding the correlation between functional and structural findings in brain imaging is that data from FDG-PET-CT are strongly affected by the underlying patterns of atrophy. A reduction in gray matter volume will always lead to a decrease of the observed and measured metabolic signal in a given region due to a partial volume effect.[32] Hence, atrophy will always influence PET interpretation, and it is; therefore, impossible to completely dissociate the functional aspect of these 2 entities.
To address these issues, especially as multiple studies agree that the hippocampus is one of the earliest sites of AD pathology,[33,34] this study investigated the sensitivity and specificity of hippocampal volume and glucose metabolism in patients being evaluated for AD, using automatic quantitative tools (NeuroQuant – MRI and Scenium – PET) and clinical evaluation.
2. Methods
2.1. Study population
The patient dataset was retrospectively collated from the Hospital Israelita Albert Einstein (São Paulo, Brazil) and included 38 adult patients over the age of 45 years, with suspected AD, who had undergone FDG-PET-CT and MRI in the Nuclear Medicine Unit of the Hospital Israelita Albert Einstein, between October, 2012 and October, 2015. In addition to the 2 imaging studies, patients underwent neuropsychological testing and clinical evaluation (comprising an initial assessment and a follow-up period). The diagnosis was defined by a team of board-certified neurologists based on 2011 National Institute on Aging-Alzheimer's Association criteria (NIA-AA). Both MRI and FDG PET are considered biomarkers of the pathophysiological process related to Alzheimer's disease by the mentioned criteria.[35] Patients who did not complete the clinical evaluation or whose final diagnosis could not be established were excluded from the study. Thirty-eight patients met the inclusion criteria (performed both studies in the stipulated period and completed the clinical evaluation) and were analyzed. The study was approved by the Research Ethics Committee of Hospital Israelita Albert Einstein (The Research Ethics Committee of the Brazilian Platform: 1,592,236).
2.2. 18F-FDG-PET-CT image acquisition, processing, and analysis
All FDG-PET-CT studies were performed on the same PET/CT scanner (Biograph mCT; Siemens Medical Solutions, Inc, Erlangen, Germany), and were performed approximately 60 minutes after an intravenous injection of 3 MBq/kg of [18F]-fluoro-2-deoxyglucose. Patients fasted for at least 4 hours, and blood glucose levels were checked before radiopharmaceutical administration (all patients had a blood glucose level below 150 mg/dL before the test). PET data were acquired in three-dimensional (3D) mode for 12 minutes and reconstructed with an iterative algorithm (8 iterations and 21 subsets), in a 400 × 400 matrix. CT images were reconstructed in the axial plane with a thickness of 1.5 mm, and in a 512 × 512 matrix. Scatter correction and time-of-flight data were incorporated into the reconstruction process, and CT was used for attenuation correction.
FDG-PET-CT images were analyzed qualitatively and quantitatively. Qualitative PET image analysis was performed by 3 experienced nuclear medicine physicians (with more than 10 years of experience) on a MultiModality Workplace workstation (Siemens), blinded to the patient clinical history, diagnosis, and MR images. Image patterns were classified into a 3-point rating scale, according to cortical metabolism evaluation: normal metabolism (0), mild hypometabolism (−1), and moderate to severe hypometabolism (−2).[36,37] The hippocampus, temporal lobe, parietal lobe, mesial temporal lobe, posterior cingulate cortex, frontal lobe, and both the left and right hemispheres, were qualitatively analyzed by the metabolism scale and quantitatively analyzed by the Database Comparison software/Scenium (Siemens Molecular Imaging Limited, Hoffman Estates, IL, USA).
The Scenium software (from the Siemens Syngo.via Neurology software package, version VB10B) is used for neurological evaluations with either PET/CT or single-photon emission computerized tomography (SPECT)/CT imaging, enabling the comparison of functional studies (PET or SPECT) of a specific patient to a database composed of scans from confirmed normal individuals. Quantitative parametric analysis was performed with Database Comparison software (Siemens Medical Solutions, Inc), that provides powerful quantification tools for the assessment of FDG-PET-CT, performs a voxel-by-voxel evaluation of the abnormal regions, and automatically identifies anatomical regions of interest (ROIs), which are optimized for AD evaluation. The workflow provides voxel-based statistics displayed as an image volume, and calculates ROI statistics, comparing the corresponding estimated normal population mean to the value observed in the patient. The results are expressed as standard deviations when compared to the reference population, for each brain region.[38,39]
2.3. MR image acquisition, processing, and analysis
MR images were acquired in a 3.0 tesla scanner (Tim Trio – Siemens), with a 12-channel phased-array head coil, a specific T1-weighted sequence, and a 3D volumetric magnetization-prepared rapid acquisition with gradient echo pulse sequence with the following parameters: Repetition time (TR) 2300 ms, echo time (TE) 3.31 ms, inversion time (TI) 900 ms, flip angle 9°, a field-of-view (FOV) of 256 mm, slice thickness 1.20 mm, a bandwidth of 240 hertz/pixels (Hz/Px), and a voxel resolution of 1.0 × 1.0 × 1.2 mm that was used for the quantification of hippocampal volume by the NeuroQuant software package (CorTechs Laboratories, La Jolla, CA). Other sequences in multiple planes were acquired for clinical qualitative evaluation, including diffusion weighted imaging sequence (FOV 220 mm, flip angle 180°, bandwidth 723 Hz/Px, voxel resolution 1.2 × 1.2 × 4.0 mm, TR 5100 ms, and TE 105 ms), fluid attenuation inversion recovery (FLAIR) axial sequence (FOV 240 mm, voxel resolution 0.8 × 0.8 × 5.0 mm, TR 9000 ms, and TE 109 ms), T2 fat suppressed axial sequence (FOV 240 mm, flip angle 160°, voxel resolution 0.5 × 0.5 × 5.0 mm, TR 4560 ms, and TE 104 ms), T1-weighted axial sequence (FOV 240 mm, voxel resolution 0.9 × 0.9 × 5.0 mm, TR 600 ms, and TE 9 ms), axial gradient echo sequence (voxel resolution 1.3 × 0.9 × 5.0 mm, TR 250 ms, and TE 20 ms), T2 axial susceptibility-weighted images sequence (FOV 220 mm, flip angle 17°, voxel resolution 0.9 × 0.9 × 1.6 mm, TR 27 ms, and TE 20 ms), and FLAIR sagittal sequence (bandwidth 751 Hz/Px, FOV 230 mm, voxel resolution 1.0 × 1.0 × 1.0 mm, TR 5000 ms, TE 388 ms, and TI 2400 ms).
NeuroQuant is a fully automated software package that was specifically developed for segmentation and volumetric analysis of brain structures.[25,26] The software provides volumetric analysis of multiple brain structures for each hemisphere (right and left) as a percentage of the total ICV; this value is based on the sum of all segmented brain structures, the brainstem, meninges, and CSF external to the brain surface, allowing for interindividual comparisons. The automatic segmentation process includes image filtering, artifact correction, segmentation, error measurement, and report generation.[40] For the hippocampus, lateral ventricles, and the temporal horn of the lateral ventricles, a normative range based on previous segmentations of healthy individuals aged 50 to 95 years is provided.[24] In this study we report age-adjusted percentile volumes for the hippocampus and the other areas of the brain included in the AD NeuroQuant evaluation, these being the forebrain parenchyma, cortical gray matter, cerebellum, amygdala, pallidum, putamen, caudate nucleus, thalamus, lateral ventricles, and inferior lateral ventricles.
2.4. Clinical diagnosis
The final diagnosis of patients was established based on clinical evaluation (including the follow-up period), neuropsychological tests and both imaging studies (according to NIA-AA criteria[35]). Imaging results (PET and MRI) and the clinical follow-up period endorsed the differential diagnosis with other dementia syndromes (eg, vascular dementia or Lewy body dementia), since these syndromes usually present specific structural MRI findings, and distinct patterns of FDG distribution and clinical progression.[17,20,35] According to the established diagnosis, the patients were grouped into 2 categories: AD/high-risk MCI and, non-AD/low-risk MCI. This classification was then used as the standard for sensitivity, specificity and accuracy calculations, when comparing imaging results from the PET image qualitative and quantitative analysis, and MRI quantitative analysis.
2.5. Statistical analysis
Qualitative variables were described by absolute and relative frequencies, which were compared between the 2 groups with either a Chi-squared test or Fisher exact test. The distribution of quantitative variables was studied by boxplot graphs and when an adequate normal distribution was observed, the mean and standard deviation were used in the description, and a Student t test was used to compare the significance between the groups. For data that were not normally distributed, comparisons were performed by the Mann–Whitney U test. P-values <.05 were considered statistically significant.
To assess the ability of quantitative modalities in predicting AD, the area under the curve (AUC), was used to compare the 2 independent receiver operating characteristic (ROC) curves.[41] Cut-off points were then defined according to the distance of the curve to the point of greater specificity and sensitivity. Using the calculated cut-off points, the variables were categorized, and the performances of the different methodologies were calculated by their measure of accuracy, sensitivity, specificity, positive predictive value (PPV), and negative predictive value (NPV), as well as their ability to detect true positive (TP), true negative (TN), false positive (FP), and false negative (FN) values. The estimated values are presented with their 95% confidence intervals. This analysis used the measurements of the hippocampus in both of the imaging techniques (PET and MRI). Quantitative PET analysis was performed with the lowest result of the hippocampus (right or left), qualitative PET analysis was performed with hippocampal image analysis by nuclear medicine physicians, and MRI analysis was performed with the percentile of the sum of hippocampal volumes. All statistical analyses were performed with SPSS Version 11.0.
3. Results
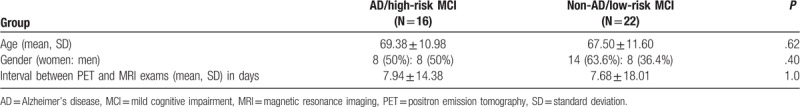
We retrospectively studied 38 patients undergoing evaluation for AD and who had undergone FDG-PET-CT and MRI. Patients of both genders were included (22 women, 57.9%), aged 46 to 89 years (68.3 ± 11.2 years). No patient was taking any medication that could interfere with the images acquired. Among the patients studied, 23 of them were using different types of medications (eg, anti-inflammatory, antihypertensive, or antiplatelet drugs), but none that could influence cerebral glucose metabolism. In addition, blood glucose level was measured before FDG injection, ensuring that all tests were performed in a euglycemic situation (<150 mg/dL).[42] These patients were followed for a long enough period for a definitive diagnosis to be made (mean follow-up period of 23 ± 11 months). Based on clinical and neuropsychological evaluations, as well as the results of imaging studies, the final diagnosis for 16 patients was AD or high-risk MCI (8 women; 69.38 ± 10.98 years). For the remaining 22 patients enrolled in the study (14 women; 67.50 ± 11.60 years), the diagnosis of AD was initially excluded, but the patients may have low-risk MCI. The median interval between the imaging exams was 7.94 ± 14.38 days for the AD/high-risk MCI group, and 7.68 ± 18.01 days for the non-AD/MCI group. The age difference among the 2 groups, as well as the interval between the exams and gender distribution, were not statistically significant (Table 1).
Table 1.
Group analysis of demographic data (AD/high-risk MCI and normal/low-risk MCI.
3.1. ROC curve analysis
ROC curves were constructed from a percentile of the sum of the hippocampal volumes on MRI, and the hippocampus with the lowest result (standard deviations) on FDG-PET-CT qualitative analysis (Fig. 1). The AUC for the MRI was 0.652 (95% confidence interval [CI]: 0.491–0.871), and the best cut-off point was observed at the 29.03 percentile. For the FDG-PET-CT data, the AUC was 0.680 (95% CI: 0.474–0.840), and the best cut-off point was a standard deviation of −2.40 (values lower than this indicated AD/MCI). The difference between the calculated AUC for both modalities was not significant (P = .82).
Figure 1.
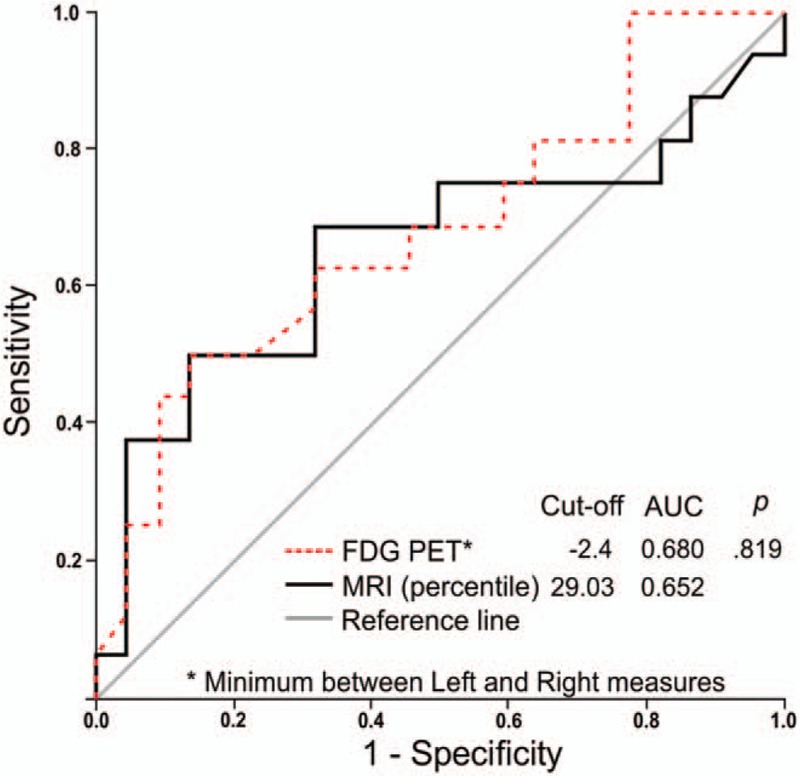
ROC curves constructed from the percentile of the hippocampal volume on MRI, and the hippocampus with the lowest result (in standard deviations) on FDG-PET. AUC = area under curve, FDG-PET = fluorodeoxyglucose positron emission tomography, MRI = magnetic resonance imaging, ROC = receiver operating characteristic.
3.2. Sensitivity, specificity, and accuracy calculation
Based on the established diagnosis and cut-off points defined by the ROC curves, the sensitivity, specificity, and accuracy were calculated for both methodologies. For MRI, in addition to the analysis based on the cut-off point defined by the ROC curve (29.03), another evaluation was performed using the 5th percentile as a cut-off, because this is usually adopted in clinical practice. Moreover, for FDG-PET-CT, besides the quantitative analysis based on the ROC curve cut-off, the same parameters were calculated for a qualitative analysis (Table 2). The PET qualitative analysis detected 22 (57.9%) patients with features of non-AD/low-risk MCI, although 5 patients were considered FN. All 16 (42.1%) patients that had AD/high-risk MCI features were all considered TPs, with an accuracy of 0.87, sensitivity of 0.76, specificity of 1.0, and a PPV and NPV of 0.77. However, the PET quantitative analysis detected 22 (57.9%) patients with features of non-AD/low-risk MCI, although 7 patients were considered to be FNs. Out of the 16 (42.1%) patients that had features of AD/high-risk MCI, 6 were considered FPs, with an accuracy of 0.63, sensitivity of 0.56, specificity of 0.68, a PPV of 0.56, and an NPV of 0.68. The MRI evaluation using the cut-off defined by the ROC curve (29.03) detected 21 (55.3%) patients with features of non-AD/low-risk MCI, although 6 patients were considered FNs. Out of the remaining 17 (44.7%) patients with features of AD/high-risk MCI, 7 were considered FPs, with an accuracy of 0.66, sensitivity of 0.63, specificity of 0.68, a PPV of 0.59, and an NPV of 0.71. The MRI evaluation using the lower 5th percentile as a cut-off detected 35 (92.1%) patients with features of non-AD/low-risk MCI, although 14 patients were considered FNs. Of the 3 (07.9%) patients with features for AD/high-risk MCI, only 1 was considered a TP, with an accuracy of 0.61, sensitivity of 0.13, specificity of 0.95, a PPV of 0.67, and an NPV 0.60.
Table 2.
Measures of accuracy for FDG-PET and MRI based clinical diagnoses.
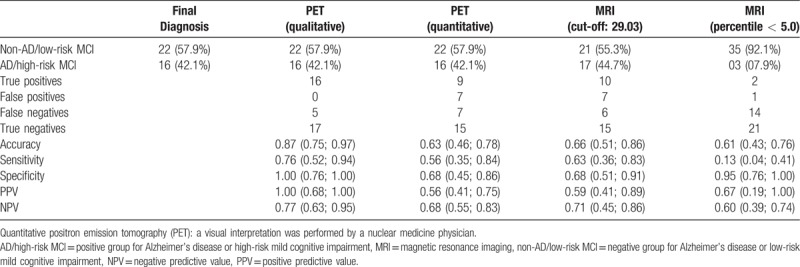
Figure 2 shows the distribution of hippocampal volumes and glucose metabolism for the 38 patients divided into 2 groups according to their final diagnosis (AD/high-risk MCI, and non-AD/low-risk MCI). The quantitative limits (horizontal lines) of percentile 29.03 (derived from the ROC curve) and the 5th percentile usually adopted in clinical practice (red dashed line) for MRI volumetry showed that the dots above quadrants 1 and 2 were the limits considered normal, and the dots below quadrants 3 and 4 were considered abnormal. Therefore, the AD/high-risk MCI patients above the 29.05 percentile (quadrants 1 and 2) were considered FNs, and the non-AD/low-risk MCI patients were considered TNs. The AD/high-risk MCI patients below the 29.05 percentile (quadrants 3 and 4) were considered TPs, and the non-AD/low-risk MCI patients FPs. The same criteria were used to interpret the MRI values with the cut-off being the 5th percentile (red dashed line). The limit of a −2.4-standard deviation (vertical line) from the ROC curve for the quantitative PET data showed that all dots on the left side of the line were considered PET data positive for AD, and the dots on the right side were considered PET data negative for AD. Therefore, the AD/high-risk MCI patients on the left side (quadrants 1 and 3) were considered TPs, and the non-AD/low-risk MCI patients were considered FPs. However, the AD/high-risk MCI patients localized to the right side (quadrants 2 and 4) were considered FNs, and the non-AD/low-risk MCI patients were considered TNs.
Figure 2.
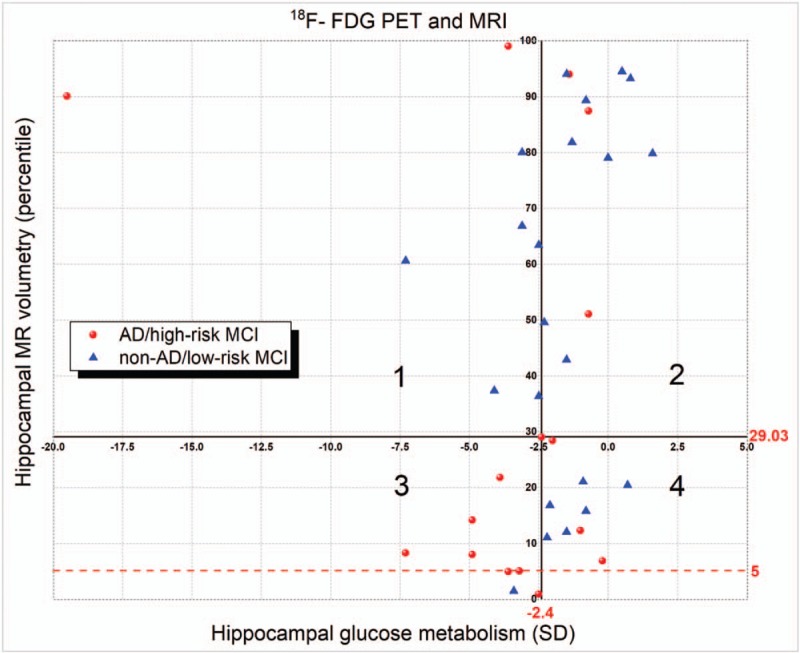
Cartesian graph showing the distribution of hippocampal volumetry and glucose metabolism. AD = Alzheimer's disease, F-FDG-PET = 18 fluorodeoxyglucose positron emission tomography, MCI = mild cognitive impairment, MRI = magnetic resonance imaging, SD = standard deviation.
The calculated efficiency measurements show that the highest accuracy was obtained by qualitative evaluation of FDG-PET-CT (0.87). PET qualitative analysis also presented the highest sensitivity (0.76) and NPV (0.77).
The least sensitive performance (13%) was obtained using MRI with the 5th percentile as the cut-off point for hippocampal volume. With regard to specificity, the worst criterion was for positive AD/high-risk MCI patients to have FDG-PET-CT results below a −2.4 standard deviation in the hippocampus (the cut-off point derived from ROC curve analysis).
Qualitative FDG-PET-CT analysis showed greater accuracy, sensitivity, and NPV when compared to the other tests. The specificity and PPV were similar in both FDG-PET-CT and MRI when the 5th percentile was the cut-off point. When comparing the 2 FDG-PET-CT analysis methodologies, the qualitative method showed higher accuracy, sensitivity, specificity, and negative and PPVs, than the quantitative method.
Finally, the MRI volumetric analysis using the 5th percentile cut-off showed higher specificity and PPV than using the cut-off derived from the ROC curve (29.03), which in turn also showed greater accuracy, sensitivity, and NPV.
3.3. Other brain regions analyzed by PET and MRI
Other brain regions were also analyzed using quantitative analysis of the acquired PET images (Table 3 and the box plot in Fig. 3). We verified a significant difference in glucose metabolism between the 2 groups in the following brain regions: left temporal lobe (P = .005), left posterior cingulate cortex (P = .04), and the right and left parietal lobes (P = .005 and .01, respectively) (Table 3 and the box plot in Fig. 3). In the qualitative analysis of PET images, a comparison between the 2 groups showed significant differences in the following brain regions: right and left temporal lobe (P < .001 for both), right and left posterior cingulate cortex (P = .02 for both), right and left parietal lobe (P < .001 for both), right and left mesial temporal lobe (P < .001 for both), and the right and left hippocampus (P < .001 for both), as depicted in Table 3 and the histogram in Figure 3.
Table 3.
Evaluation of the PET images – quantitative analysis by Scenium and qualitative analysis.
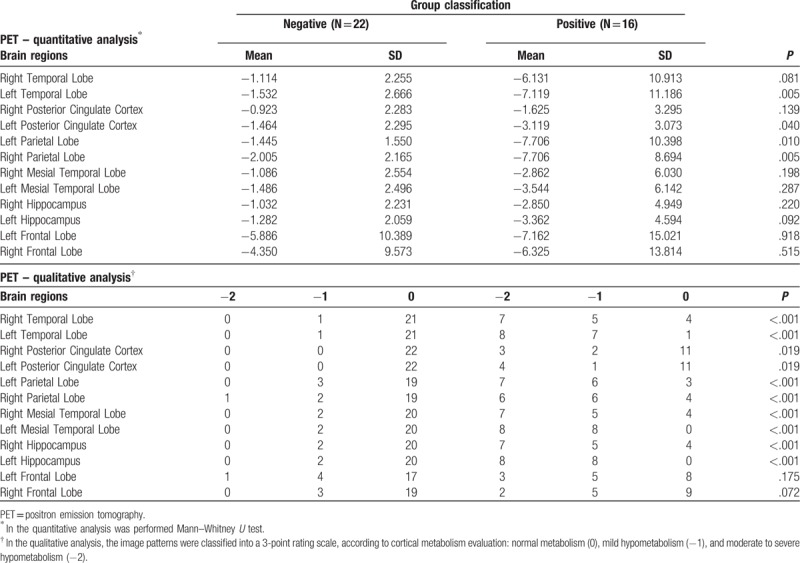
Figure 3.
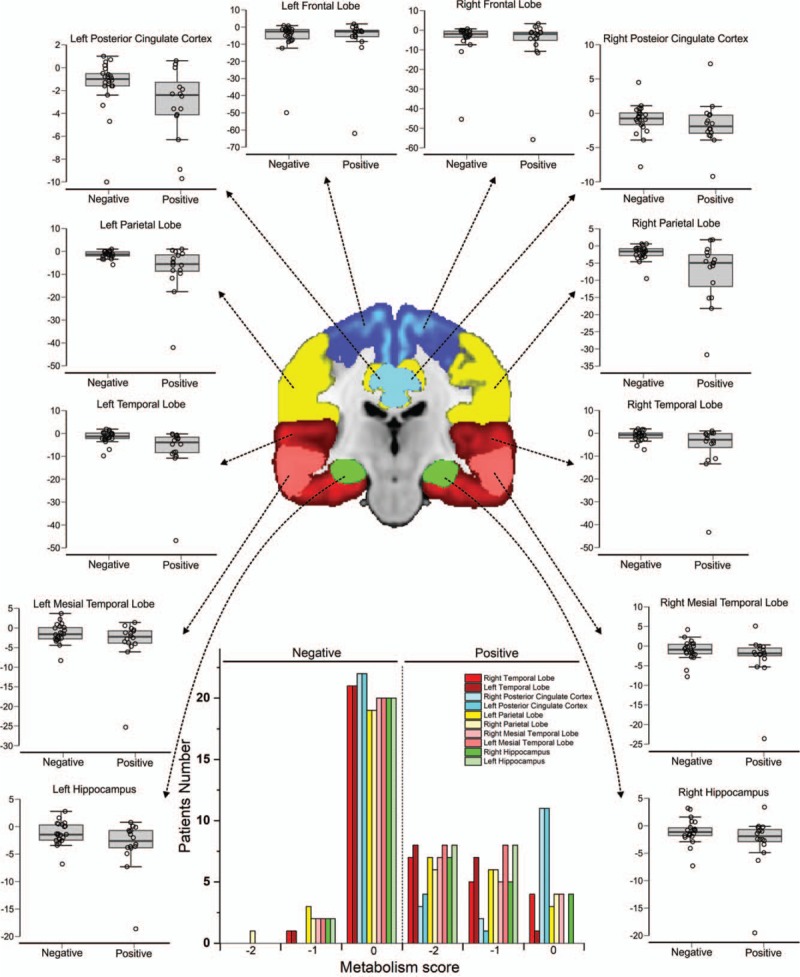
Quantitative and qualitative PET image analysis. The box plot graphics show the brain regions analyzed by PET both quantitatively and qualitatively. The image and histogram colors represent the following brain regions: dark blue – frontal lobe, yellow – parietal lobe, red – temporal lobe, pink – mesial temporal lobe, green – hippocampus, light blue – posterior cingulate cortex. PET = positron emission tomography.
When analyzing the other brain volumes reported by the NeuroQuant evaluation for MRI volumetric analysis (Table 4), we observed a significant difference between the 2 groups for the percentages of normalized ICV in the following regions: right and left forebrain parenchyma (P = .01 and .04, respectively), right cortical gray matter (P = .04), right and left lateral ventricle (P = .007 and .02, respectively), and the right inferior lateral ventricle (P = .01), as depicted in Table 4 and the box plots in Figure 4.
Table 4.
Quantitative analysis of MRI by Neuroquant.
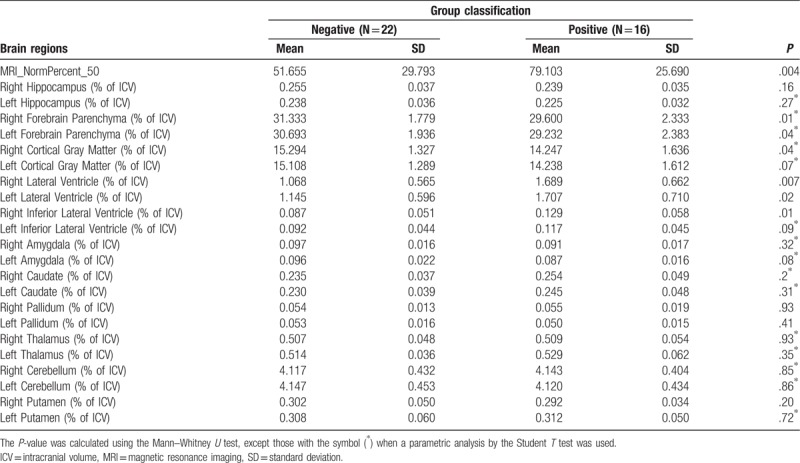
Figure 4.
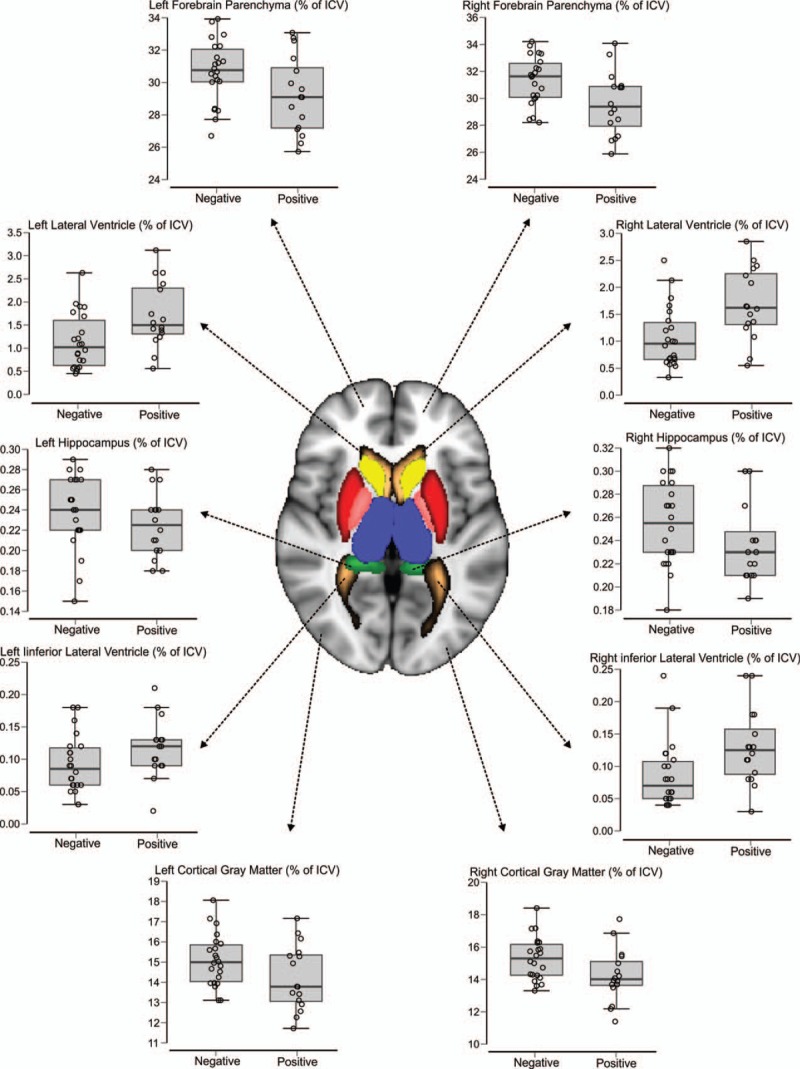
Quantitative analysis of MRI. The image colors represent the following brain regions: dark blue – thalamus, yellow – caudate, red – putamen, pink – pallidum, green – hippocampus, light blue – amygdala, pink and white – cerebellum, gray – cortical gray matter, brown – inferior lateral ventricle and lateral ventricle, and forebrain parenchyma (sum of the white matter and gray matter). ICV = intracranial volume, MRI = magnetic resonance imaging.
4. Discussion
All patients included in this study initially showed some clinical signs of cognitive dysfunction, leading to suspected AD. The hippocampus played an important role in this evaluation, due to its vulnerability to damage during the early stages of AD.[43,44] Memory loss, the hallmark symptom of AD, has been associated with cholinergic dysfunction of the central basal forebrain, mainly involving cholinergic projections to the cortex and hippocampus.[45] As AD progresses, cognitive function and the ability to perform routine daily activities declines,[46] requiring clinical follow-ups, assessments based mainly on disease history, neuropsychological tests, neuroimaging, and other adjunct information.[47]
Neuroimaging plays a vital role in the evaluation of patients who are suspected to have AD. MRI and PET are 2 major modalities used to diagnose AD,[47] and because of this, we used these techniques to evaluate hippocampal sensitivity and specificity to predict the diagnosis of patients with suspected AD. Hippocampal atrophy on structural MRI can explain the initial symptoms of AD,[48] and hippocampal hypometabolism seen on PET images reflects the early neuronal dysfunction seen in AD,[49] although hippocampal changes are frequently reported in diseases other than AD, and if MCI is present a diagnosis of AD is often made.[50]
The sensitivity and specificity measurements of these neuroimage techniques were performed by commercially available automatic quantitative MRI tools (NeuroQuant),[25,26,51–54] PET (Scenium),[55,56] and clinical evaluation.[50,57] Two measures of each technique were used to perform these analyses. For the hippocampal volumes derived from morphometric MRI analysis (quantitative measures analysis), 2 cut-off points were considered: lower than the 5th percentile and a cut-off point determined from ROC curve analysis. Hippocampal glucose metabolism values generated from FDG-PET-CT were analyzed quantitatively and qualitatively.
Evaluation of MRI showed the first important finding of this study. For the diagnosis of either AD or MCI, MRI hippocampal volumetry had a very low sensitivity (13%) when considering a cut-off point that is lower than the 5th percentile. Despite the high specificity observed with this criterion (95%), its use in clinical practice could result in an excessively high number of FN results and therefore delay the diagnosis of many patients. Using the cut-off point of 29.03, derived from our ROC curve analysis, MRI volumetry sensitivity improved substantially to 63%, while preserving specificity at an acceptable level of 68%, resulting in an accuracy of 66% (compared to 61% when using the 5th percentile as the cut-off point). The number of individuals enrolled in this study was insufficient to establish a cut-off value with adequate power to be used in another group of patients, but clearly indicates that the accuracy of the method could increase substantially using a cut-off point above the 5th percentile. The discriminant function analysis from the ROC curve allowed an adequate cut-off point to be found, providing better MRI data integration into the clinical diagnostic process, which translated into research findings being integrated into the clinic.[40]
Another reason that could contribute to the low sensitivity of MRI is that the analysis was performed based on a single MRI study of each patient, at a given moment in time. Thus, a longitudinal evaluation of atrophy was not possible, and this could be very important for AD and MCI diagnosis.[58]
Several studies have shown that FDG-PET-CT qualitative analyses perform significantly better when compared to MRI volumetry.[19,57,59–61] At least in part, this observation could corroborate the sequential hypothesis of AD pathophysiology, which postulates that functional changes (synaptic dysfunction) precede structural changes (atrophy).[14] We believe, however, that the lower radiopharmaceutical concentration detected on PET-CT images does not only reflect hypometabolism related to synaptic dysfunction. Some degree of atrophy, although not expressive enough for detectable changes in structural imaging, could contribute to the perception of areas with lower tracer concentration on PET images, due to the partial volume effect. A meta-analysis study also showed that FDG-PET-CT images had better sensitivity and specificity compared to MRI, when predicting the conversion of MCI to AD.[62]
The results of the qualitative PET analysis were also significantly better, showing higher sensitivity and specificity values, compared to the quantitative analysis. This is unexpected, especially a higher sensitivity, because quantitative methods often allow the detection of small imaging differences that would not be perceptible qualitatively. However, other studies have also shown that qualitative analysis, when performed by experienced professionals, can improve the quantitative analysis of brain PET images.[50] We believe that the main problem with quantitative PET-CT analysis (using the methodology described) is the ROI definition for quantification. This process is fully automated and based on template images generated from a series of normal studies. In patients with some degree of atrophy, even considering the nonrigid registration used by the software (which allows distortions of the patient's image for better adaptation to the template), areas of enlarged CSF spaces are included in the ROI defined for measurement, reducing the average counting values in those regions (Fig. 5). These methodological limitations of the quantification of FDG-PET-CT, are also valid for MRI. A large scale clinical trial highlighted the limitations of using template-based or atlas space to delineate ROIs to analyze, rather than individual delineation of ROIs.[63]
Figure 5.
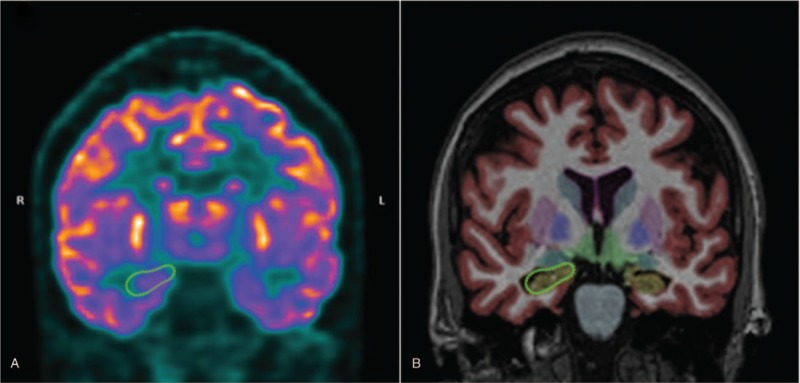
A comparison between the quantification of glucose metabolism by PET-CT using Scenium software (A), and hippocampal volumetry using Neuroquant software (B). PET-CT = positron emission tomography-computed tomography.
For qualitative analysis, these areas of enlarged CSF spaces are easily detected by the reader, and; therefore, do not interfere in the interpretation of the cortical region metabolism. A possible solution to this problem would be the use of ROIs for quantification derived directly from the patient's own structural images (and not based on template images). With this option, the regions delineated in MR images could be transposed into PET images, and used for metabolism quantification (this would be particularly effective in PET-MRI exams, which have been recently incorporated into the clinical routine).[55] The hybrid equipment that combining MR imaging with PET imaging information might greatly improve the accuracy of AD diagnosis.[47]
An important consideration; however, with respect to the performance of qualitative analysis, is that this type of subjective assessment may be subject to interpretation bias. The physician specifically evaluated hippocampal metabolism; however, the occurrence of hypometabolism in other areas (especially in areas typically involved in AD) may have influenced this interpretation. Obviously, this kind of interference does not occur in quantitative analysis.
Besides the hippocampus volumetric analysis to predict the diagnosis of patients at risk for AD, the volume of other brain areas have been reported to be as, or even more, sensitive than the hippocampus.[50–53] We did not find any significant volumetric results in the hippocampus, only in other brain regions, in agreement with previous reports for the amygdala and caudate nucleus volumes that were able to predict the conversion of MCI to AD, unlike the hippocampus, using the marketed automatic clinical tool.[64] The temporal horn has also been reported to be more predictive in the diagnostic analysis of patients that will develop AD, than hippocampal atrophy, using semi-automated methods.[65] However, similar predictive values were shown for the medial temporal lobe, and the hippocampus when trying to separate patients with AD from those without AD.[52] Medial temporal lobe measurements can be analyzed via the inferior lateral ventricle measurements taken by automated clinical tools.[40] Our analysis showed significant results when comparing the medial temporal lobe in the AD/high-risk MCI group with the non-AD/low-risk MCI group. Another study that used an automated method of analysis reported that deep gray matter structures, including the amygdala, thalamus, putamen, and the nucleus accumbens, were predictive of the conversion of MCI to AD, in addition to the hippocampus.[66] We found a significant difference between the groups in the right total cortical gray matter volume. The hippocampus, precuneus, and posterior cingulate cortex predicted conversion from MCI to AD at an earlier time point and with a higher degree of accuracy than the hippocampal volume.[67] The gray matter density of the amygdala, hippocampal complex, the bilateral temporal, and the frontal gyri in the mild AD group were significantly lower than those in the first healthy control group.[57] The reduction in volume of the basal forebrain precedes the major impact on the hippocampal volume, and predicts the cortical spread of AD pathology.[68,69] In addition, basal forebrain volume is associated with baseline performance in executive function.[68]
Other imaging methodologies, such as diffusion tensor imaging, also focus on the analysis of converting, and nonconverting MCI patients, in other brain areas besides the hippocampus, such as the callosum, cingulum, and the uncinate in both brain hemispheres, using fractional anisotropy and mean diffusivity.[70]
The FDG-PET-CT images reported in another study also showed sensitivity to the prediction of AD diagnosis in other analyzed brain regions. The reduction of glucose metabolism in the posterior cingulate, parietotemporal cortex, and the precuneus, was observed in the early stages of AD,[19] as well as in the limbic system (parahippocampal gyrus and posterior cingulate gyrus).[22] The individual pattern of glucose reduction in AD patients was 86% in the posterior cingulate cortex (including 71% in the precuneus), 71% in the temporal cortex, 64% in the parietal cortex, and 35% in the frontal cortex.[71] Similar results were observed in our study for the PET quantitative, and qualitative analysis in the AD/high-risk MCI patients, with the exception of the frontal cortex and a greater involvement of the left hemisphere, a common finding in normal aging alterations.[22] Overall, the combination of FDG-PET-CT, and volumetric MRI analysis improved the accuracy of AD diagnosis.[57]
Although, our results were very similar to other described in the literature, some of the limitations of our study need to be considered. First, the sample size of this retrospective study was small, which may have influenced the sensitivity evaluation of the analyzed methods. Future studies should include a larger sample size to verify the results of the present study, and to increase the limit value of the analysis of subgroups of patients. Second, the use of automated clinical tools in the evaluation of images. These tools have helped in the individual evaluation of patients, by comparing the images with a database, but the cost of this evaluation is not accessible to all, and the database is based on populations that differ in some respects from the studied population, which can influence individual comparisons. Finally, we would like to point out that the patients’ final diagnosis was not performed through the clinical evaluation parameters used in clinical research, but by physicians who had access to all the patient exams, and who followed these patients for the time needed to make the diagnosis.
From a practical point of view, and for the implications of patient care, our results suggest that MRI hippocampal volumetry considering the 5th percentile as the cut-off point (the value usually adopted in clinical practice) is a very specific test, but the sensitivity is relatively low compared to the functional data from FDG-PET-CT. The quantification analysis of FDG-PET-CT, could be used as an adjunct tool, but should not replace visual interpretation. Future developments in quantification methods for MRI and PET could improve the performance of both methodologies, especially regarding the definition of ROIs on PET images. Furthermore, PET-MRI hybrid imaging, that provides both functional and structural images, could certainly be a very interesting option for the evaluation of neurodegeneration related to AD pathophysiology.
Acknowledgment
We thank the support center for the researcher at the Hospital Israelita Albert Einstein for the statistical service provided by Dr. Elivania da Silva Vitor, statistician responsible for our analyses.
Author contributions
Conceptualization: Bruna Letícia Ferrari, Guilherme de Carvalho Campos Neto, Lionel Fernel Gamarra.
Data curation: Bruna Letícia Ferrari, Guilherme de Carvalho Campos Neto, Shirley Silva Lacerda, Lionel Fernel Gamarra.
Formal analysis: Bruna Letícia Ferrari, Guilherme de Carvalho Campos Neto, Mariana Penteado Nucci, Javier Bustamante Mamani, Shirley Silva Lacerda, Lionel Fernel Gamarra.
Investigation: Bruna Letícia Ferrari, Guilherme de Carvalho Campos Neto, Mariana Penteado Nucci, Shirley Silva Lacerda, André Carvalho Felício, Lionel Fernel Gamarra.
Methodology: Bruna Letícia Ferrari, Guilherme de Carvalho Campos Neto, Mariana Penteado Nucci, Javier Bustamante Mamani, André Carvalho Felício, Edson Amaro Junior, Lionel Fernel Gamarra.
Project administration: Guilherme de Carvalho Campos Neto, Lionel Fernel Gamarra.
Supervision: Guilherme de Carvalho Campos Neto, Lionel Fernel Gamarra.
Validation: Bruna Letícia Ferrari, Guilherme de Carvalho Campos Neto, Javier Bustamante Mamani, André Carvalho Felício, Lionel Fernel Gamarra.
Visualization: Bruna Letícia Ferrari, Mariana Penteado Nucci, Lionel Fernel Gamarra.
Writing – original draft: Guilherme de Carvalho Campos Neto, Mariana Penteado Nucci, Edson Amaro Junior, Lionel Fernel Gamarra.
Writing – review and editing: Guilherme de Carvalho Campos Neto, Mariana Penteado Nucci, Javier Bustamante Mamani, André Carvalho Felício, Edson Amaro Junior, Lionel Fernel Gamarra.
Lionel Fernel Gamarra orcid: 0000-0002-3910-0047.
Footnotes
Abbreviations: 18F-FGD = 18 fluorodeoxyglucose, AD = Alzheimer's disease, AUC = area under the curve, CT = tomography computerized, FN = false negative, FP = false positive, ICV = intracranial volume, MCI = mild cognitive impairment, MRI = magnetic resonance imaging, NPV = negative predictive value, PET = positron emission tomography, PPV = positive predictive value, TN = true negative, TP = true positive.
How to cite this article: Ferrari BL, Neto GdCC, Nucci MP, Mamani JB, Lacerda SS, Felício AC, Amaro Jr E, Gamarra LF. The accuracy of hippocampal volumetry and glucose metabolism for the diagnosis of patients with suspected Alzheimer's disease, using automatic quantitative clinical tools. Medicine. 2019;98:45(e17824).
BLF, GdCCN, and MPN contributed equally to this study.
BLF, GCCN, and MPN are co-first authors.
This study was supported by the Albert Einstein Institute for Education and Research (Instituto Israelita de Ensino e Pesquisa Albert Einstein – IIEPAE), the National Council for Scientific and Technological Development (Conselho Nacional de Desenvolvimento Científico e Tecnológico – CNPq), the Brazilian Federal Agency for the Support and Evaluation of Graduate Education (Coordenação de Aperfeiçoamento de Pessoal de Nível Superior – CAPES), and São Paulo State Research Support Foundation (Fundação de Amparo à Pesquisa do Estado de São Paulo – FAPESP).
All authors read and approved the final manuscript.
The authors have no conflicts of interest to disclose.
References
- [1].Petrella JR, Coleman RE, Doraiswamy PM. Neuroimaging and early diagnosis of Alzheimer disease: a look to the future. Radiology 2003;226:315–36. [DOI] [PubMed] [Google Scholar]
- [2].Davatzikos C, Bhatt P, Shaw LM, et al. Prediction of MCI to AD conversion, via MRI, CSF biomarkers, and pattern classification. Neurobiol Aging 2011;32:2322.e19–27. [DOI] [PMC free article] [PubMed] [Google Scholar]
- [3].Petersen RC, Roberts RO, Knopman DS, et al. Mild cognitive impairment: ten years later. Arch Neurol 2009;66:1447–55. [DOI] [PMC free article] [PubMed] [Google Scholar]
- [4].Roberts R, Knopman DS. Classification and epidemiology of MCI. Clin Geriatr Med 2013;29:753–72. [DOI] [PMC free article] [PubMed] [Google Scholar]
- [5].Petersen RC, Doody R, Kurz A, et al. Current concepts in mild cognitive impairment. Arch Neurol 2001;58:1985–92. [DOI] [PubMed] [Google Scholar]
- [6].Petersen RC. Mild cognitive impairment as a diagnostic entity. J Intern Med 2004;256:183–94. [DOI] [PubMed] [Google Scholar]
- [7].Michaud TL, Su D, Siahpush M, et al. The risk of incident mild cognitive impairment and progression to dementia considering mild cognitive impairment subtypes. Dement Geriatr Cogn Dis Extra 2017;7:15–29. [DOI] [PMC free article] [PubMed] [Google Scholar]
- [8].Lowe VJ, Kemp BJ, Jack CR, Jr, et al. Comparison of 18F-FDG and PiB PET in cognitive impairment. J Nucl Med 2009;50:878–86. [DOI] [PMC free article] [PubMed] [Google Scholar]
- [9].Jungwirth S, Zehetmayer S, Hinterberger M, et al. The validity of amnestic MCI and non-amnestic MCI at age 75 in the prediction of Alzheimer's dementia and vascular dementia. Int Psychogeriatr 2012;24:959–66. [DOI] [PubMed] [Google Scholar]
- [10].Frolich L, Peters O, Lewczuk P, et al. Incremental value of biomarker combinations to predict progression of mild cognitive impairment to Alzheimer's dementia. Alzheimers Res Ther 2017;9:84. [DOI] [PMC free article] [PubMed] [Google Scholar]
- [11].de Oliveira FF, Bertolucci PH, Chen ES, et al. Risk factors for age at onset of dementia due to Alzheimer's disease in a sample of patients with low mean schooling from Sao Paulo, Brazil. Int J Geriatr Psychiatry 2014;29:1033–9. [DOI] [PubMed] [Google Scholar]
- [12].Harrison JR, Owen MJ. Alzheimer's disease: the amyloid hypothesis on trial. Br J Psychiatry 2016;208:1–3. [DOI] [PubMed] [Google Scholar]
- [13].Morris GP, Clark IA, Vissel B. Inconsistencies and controversies surrounding the amyloid hypothesis of Alzheimer's disease. Acta Neuropathol Commun 2014;2:135. [DOI] [PMC free article] [PubMed] [Google Scholar]
- [14].Sperling RA, Aisen PS, Beckett LA, et al. Toward defining the preclinical stages of Alzheimer's disease: recommendations from the National Institute on Aging-Alzheimer's Association workgroups on diagnostic guidelines for Alzheimer's disease. Alzheimers Dement 2011;7:280–92. [DOI] [PMC free article] [PubMed] [Google Scholar]
- [15].Clopton D, Jason Druzgal T. Advances in dementia imaging. Semin Roentgenol 2014;49:53–63. [DOI] [PubMed] [Google Scholar]
- [16].Boccardi M, Festari C, Altomare D, et al. Assessing FDG-PET diagnostic accuracy studies to develop recommendations for clinical use in dementia. Eur J Nucl Med Mol Imaging 2018;45:1470–86. [DOI] [PubMed] [Google Scholar]
- [17].Brown RK, Bohnen NI, Wong KK, et al. Brain PET in suspected dementia: patterns of altered FDG metabolism. Radiographics 2014;34:684–701. [DOI] [PubMed] [Google Scholar]
- [18].Dukart J, Mueller K, Horstmann A, et al. Combined evaluation of FDG-PET and MRI improves detection and differentiation of dementia. PLoS One 2011;6:e18111. [DOI] [PMC free article] [PubMed] [Google Scholar]
- [19].Ishii K. PET approaches for diagnosis of dementia. AJNR Am J Neuroradiol 2014;35:2030–8. [DOI] [PMC free article] [PubMed] [Google Scholar]
- [20].Karow DS, McEvoy LK, Fennema-Notestine C, et al. Relative capability of MR imaging and FDG PET to depict changes associated with prodromal and early Alzheimer disease. Radiology 2010;256:932–42. [DOI] [PMC free article] [PubMed] [Google Scholar]
- [21].Scheef L, Spottke A, Daerr M, et al. Glucose metabolism, gray matter structure, and memory decline in subjective memory impairment. Neurology 2012;79:1332–9. [DOI] [PubMed] [Google Scholar]
- [22].Shivamurthy VK, Tahari AK, Marcus C, et al. Brain FDG PET and the diagnosis of dementia. AJR Am J Roentgenol 2015;204:W76–85. [DOI] [PubMed] [Google Scholar]
- [23].Silverman DH, Alavi A. PET imaging in the assessment of normal and impaired cognitive function. Radiol Clin North Am 2005;43:67–77. [DOI] [PubMed] [Google Scholar]
- [24].Silverman DH, Gambhir SS, Huang HW, et al. Evaluating early dementia with and without assessment of regional cerebral metabolism by PET: a comparison of predicted costs and benefits. J Nucl Med 2002;43:253–66. [PubMed] [Google Scholar]
- [25].Brewer JB. Fully-automated volumetric MRI with normative ranges: translation to clinical practice. Behav Neurol 2009;21:21–8. [DOI] [PMC free article] [PubMed] [Google Scholar]
- [26].Brewer JB, Magda S, Airriess C, et al. Fully-automated quantification of regional brain volumes for improved detection of focal atrophy in Alzheimer disease. AJNR Am J Neuroradiol 2009;30:578–80. [DOI] [PMC free article] [PubMed] [Google Scholar]
- [27].Dukart J, Kherif F, Mueller K, et al. Generative FDG-PET and MRI model of aging and disease progression in Alzheimer's disease. PLoS Comput Biol 2013;9:e1002987. [DOI] [PMC free article] [PubMed] [Google Scholar]
- [28].Risacher SL, Saykin AJ, West JD, et al. Baseline MRI predictors of conversion from MCI to probable AD in the ADNI cohort. Curr Alzheimer Res 2009;6:347–61. [DOI] [PMC free article] [PubMed] [Google Scholar]
- [29].Whitwell JL, Przybelski SA, Weigand SD, et al. 3D maps from multiple MRI illustrate changing atrophy patterns as subjects progress from mild cognitive impairment to Alzheimer's disease. Brain 2007;130:1777–86. [DOI] [PMC free article] [PubMed] [Google Scholar]
- [30].Morbelli S, Piccardo A, Villavecchia G, et al. Mapping brain morphological and functional conversion patterns in amnestic MCI: a voxel-based MRI and FDG-PET study. Eur J Nucl Med Mol Imaging 2010;37:36–45. [DOI] [PubMed] [Google Scholar]
- [31].Villain N, Fouquet M, Baron JC, et al. Sequential relationships between grey matter and white matter atrophy and brain metabolic abnormalities in early Alzheimer's disease. Brain 2010;133:3301–14. [DOI] [PMC free article] [PubMed] [Google Scholar]
- [32].Muller-Gartner HW, Links JM, Prince JL, et al. Measurement of radiotracer concentration in brain gray matter using positron emission tomography: MRI-based correction for partial volume effects. J Cereb Blood Flow Metab 1992;12:571–83. [DOI] [PubMed] [Google Scholar]
- [33].Braak H, Alafuzoff I, Arzberger T, et al. Staging of Alzheimer disease-associated neurofibrillary pathology using paraffin sections and immunocytochemistry. Acta Neuropathol 2006;112:389–404. [DOI] [PMC free article] [PubMed] [Google Scholar]
- [34].Padurariu M, Ciobica A, Mavroudis I, et al. Hippocampal neuronal loss in the CA1 and CA3 areas of Alzheimer's disease patients. Psychiatr Danub 2012;24:152–8. [PubMed] [Google Scholar]
- [35].McKhann GM, Knopman DS, Chertkow H, et al. The diagnosis of dementia due to Alzheimer's disease: recommendations from the National Institute on Aging-Alzheimer's Association workgroups on diagnostic guidelines for Alzheimer's disease. Alzheimers Dement 2011;7:263–9. [DOI] [PMC free article] [PubMed] [Google Scholar]
- [36].Erbayat Altay E, Fessler AJ, Gallagher M, et al. Correlation of severity of FDG-PET hypometabolism and interictal regional delta slowing in temporal lobe epilepsy. Epilepsia 2005;46:573–6. [DOI] [PubMed] [Google Scholar]
- [37].Mosconi L, De Santi S, Li Y, et al. Visual rating of medial temporal lobe metabolism in mild cognitive impairment and Alzheimer's disease using FDG-PET. Eur J Nucl Med Mol Imaging 2006;33:210–21. [DOI] [PubMed] [Google Scholar]
- [38].Minoshima S, Frey KA, Koeppe RA, et al. A diagnostic approach in Alzheimer's disease using three-dimensional stereotactic surface projections of fluorine-18-FDG PET. J Nucl Med 1995;36:1238–48. [PubMed] [Google Scholar]
- [39].Reiman EM, Caselli RJ, Yun LS, et al. Preclinical evidence of Alzheimer's disease in persons homozygous for the epsilon 4 allele for apolipoprotein E. N Engl J Med 1996;334:752–8. [DOI] [PubMed] [Google Scholar]
- [40].England HB, Gillis MM, Hampstead BM. RBANS memory indices are related to medial temporal lobe volumetrics in healthy older adults and those with mild cognitive impairment. Arch Clin Neuropsychol 2014;29:322–8. [DOI] [PMC free article] [PubMed] [Google Scholar]
- [41].DeLong ER, DeLong DM, Clarke-Pearson DL. Comparing the areas under two or more correlated receiver operating characteristic curves: a nonparametric approach. Biometrics 1988;44:837–45. [PubMed] [Google Scholar]
- [42].Varrone A, Asenbaum S, Vander Borght T, et al. EANM procedure guidelines for PET brain imaging using [18F]FDG, version 2. Eur J Nucl Med Mol Imaging 2009;36:2103–10. [DOI] [PubMed] [Google Scholar]
- [43].Serra L, Bozzali M, Fadda L, et al. The role of hippocampus in the retrieval of autobiographical memories in patients with amnestic Mild Cognitive Impairment due to Alzheimer's disease. J Neuropsychol 2018;doi: 10.1111/jnp.12174 [Epub ahead of print]. [DOI] [PubMed] [Google Scholar]
- [44].Mu Y, Gage FH. Adult hippocampal neurogenesis and its role in Alzheimer's disease. Mol Neurodegener 2011;6:85. [DOI] [PMC free article] [PubMed] [Google Scholar]
- [45].Mitra S, Behbahani H, Eriksdotter M. Innovative therapy for Alzheimer's disease-with focus on biodelivery of NGF. Front Neurosci 2019;13:38. [DOI] [PMC free article] [PubMed] [Google Scholar]
- [46].Kelley BJ, Petersen RC. Alzheimer's disease and mild cognitive impairment. Neurol Clin 2007;25:577–609. [DOI] [PMC free article] [PubMed] [Google Scholar]
- [47].Zhang XY, Yang ZL, Lu GM, et al. PET/MR imaging: new frontier in Alzheimer's disease and other dementias. Front Mol Neurosci 2017;10:343. [DOI] [PMC free article] [PubMed] [Google Scholar]
- [48].Barnes J, Fox NC. The search for early markers of AD: hippocampal atrophy and memory deficits. Int Psychogeriatr 2014;26:1065–6. [DOI] [PMC free article] [PubMed] [Google Scholar]
- [49].Mosconi L, De Santi S, Li J, et al. Hippocampal hypometabolism predicts cognitive decline from normal aging. Neurobiol Aging 2008;29:676–92. [DOI] [PMC free article] [PubMed] [Google Scholar]
- [50].Pagani M, De Carli F, Morbelli S, et al. Volume of interest-based [18F]fluorodeoxyglucose PET discriminates MCI converting to Alzheimer's disease from healthy controls. A European Alzheimer's Disease Consortium (EADC) study. Neuroimage Clin 2015;7:34–42. [DOI] [PMC free article] [PubMed] [Google Scholar]
- [51].Suppa P, Hampel H, Spies L, et al. Fully automated atlas-based hippocampus volumetry for clinical routine: validation in subjects with mild cognitive impairment from the ADNI cohort. J Alzheimers Dis 2015;46:199–209. [DOI] [PubMed] [Google Scholar]
- [52].Persson K, Barca ML, Cavallin L, et al. Comparison of automated volumetry of the hippocampus using NeuroQuant(R) and visual assessment of the medial temporal lobe in Alzheimer's disease. Acta Radiol 2018;59:997–1001. [DOI] [PubMed] [Google Scholar]
- [53].Tanpitukpongse TP, Mazurowski MA, Ikhena J, et al. Predictive utility of marketed volumetric software tools in subjects at risk for Alzheimer disease: do regions outside the hippocampus matter? AJNR Am J Neuroradiol 2017;38:546–52. [DOI] [PMC free article] [PubMed] [Google Scholar]
- [54].Engedal K, Braekhus A, Andreassen OA, et al. Diagnosis of dementia–automatic quantification of brain structures. Tidsskr Nor Laegeforen 2012;132:1747–51. [DOI] [PubMed] [Google Scholar]
- [55].Jena A, Taneja S, Goel R, et al. Reliability of semiquantitative (1)(8)F-FDG PET parameters derived from simultaneous brain PET/MRI: a feasibility study. Eur J Radiol 2014;83:1269–74. [DOI] [PubMed] [Google Scholar]
- [56].Shao X, Xu M, Qiu C, et al. Application of siemens SMART neuro attenuation correction in brain PET imaging. Medicine (Baltimore) 2018;97:e12502. [DOI] [PMC free article] [PubMed] [Google Scholar]
- [57].Kawachi T, Ishii K, Sakamoto S, et al. Comparison of the diagnostic performance of FDG-PET and VBM-MRI in very mild Alzheimer's disease. Eur J Nucl Med Mol Imaging 2006;33:801–9. [DOI] [PubMed] [Google Scholar]
- [58].Chan D, Janssen JC, Whitwell JL, et al. Change in rates of cerebral atrophy over time in early-onset Alzheimer's disease: longitudinal MRI study. Lancet 2003;362:1121–2. [DOI] [PubMed] [Google Scholar]
- [59].Chetelat G, Desgranges B, Landeau B, et al. Direct voxel-based comparison between grey matter hypometabolism and atrophy in Alzheimer's disease. Brain 2008;131:60–71. [DOI] [PubMed] [Google Scholar]
- [60].De Santi S, de Leon MJ, Rusinek H, et al. Hippocampal formation glucose metabolism and volume losses in MCI and AD. Neurobiol Aging 2001;22:529–39. [DOI] [PubMed] [Google Scholar]
- [61].Mosconi L, Sorbi S, de Leon MJ, et al. Hypometabolism exceeds atrophy in presymptomatic early-onset familial Alzheimer's disease. J Nucl Med 2006;47:1778–86. [PubMed] [Google Scholar]
- [62].Yuan Y, Gu ZX, Wei WS. Fluorodeoxyglucose-positron-emission tomography, single-photon emission tomography, and structural MR imaging for prediction of rapid conversion to Alzheimer disease in patients with mild cognitive impairment: a meta-analysis. AJNR Am J Neuroradiol 2009;30:404–10. [DOI] [PMC free article] [PubMed] [Google Scholar]
- [63].Jung JH, Choi Y, Im KC. PET/MRI: technical challenges and recent advances. Nucl Med Mol Imaging 2016;50:3–12. [DOI] [PMC free article] [PubMed] [Google Scholar]
- [64].Liu Y, Paajanen T, Zhang Y, et al. Analysis of regional MRI volumes and thicknesses as predictors of conversion from mild cognitive impairment to Alzheimer's disease. Neurobiol Aging 2010;31:1375–85. [DOI] [PubMed] [Google Scholar]
- [65].Macdonald KE, Bartlett JW, Leung KK, et al. The value of hippocampal and temporal horn volumes and rates of change in predicting future conversion to AD. Alzheimer Dis Assoc Disord 2013;27:168–73. [DOI] [PMC free article] [PubMed] [Google Scholar]
- [66].Yi HA, Moller C, Dieleman N, et al. Relation between subcortical grey matter atrophy and conversion from mild cognitive impairment to Alzheimer's disease. J Neurol Neurosurg Psychiatry 2016;87:425–32. [DOI] [PubMed] [Google Scholar]
- [67].Lee S, Lee H, Kim KW. Magnetic resonance imaging texture predicts progression to dementia due to Alzheimer disease earlier than hippocampal volume. J Psychiatry Neurosci 2019;44:1–8. [DOI] [PMC free article] [PubMed] [Google Scholar]
- [68].Teipel SJ, Cavedo E, Hampel H, et al. Basal forebrain volume, but not hippocampal volume, is a predictor of global cognitive decline in patients with Alzheimer's disease treated with cholinesterase inhibitors. Front Neurol 2018;9:642. [DOI] [PMC free article] [PubMed] [Google Scholar]
- [69].Schmitz TW, Nathan Spreng R. Alzheimer's Disease Neuroimaging Initiative. Basal forebrain degeneration precedes and predicts the cortical spread of Alzheimer's pathology. Nat Commun 2016;7:13249. [DOI] [PMC free article] [PubMed] [Google Scholar]
- [70].Marcos A, Gomez-Fernandez C, Yus M, et al. Diffusion tensor imaging measures of brain connectivity for the early diagnosis of Alzheimer's disease. Brain Connect 2019;9:594–603. [DOI] [PubMed] [Google Scholar]
- [71].Del Sole A, Clerici F, Chiti A, et al. Individual cerebral metabolic deficits in Alzheimer's disease and amnestic mild cognitive impairment: an FDG PET study. Eur J Nucl Med Mol Imaging 2008;35:1357–66. [DOI] [PubMed] [Google Scholar]