

Abstract
Sound detection in auditory sensory hair cells depends on the deflection of the stereocilia hair bundle which opens mechano-electric transduction (MET) channels. Adaptation is hypothesized to be a critical property of MET that contributes to the auditory system's wide dynamic range and sharp frequency selectivity. Our recent work using a stiff probe to displace hair bundles showed that the fastest adaptation mechanism (fast adaptation) does not require calcium entry. Using fluid-jet stimuli, others obtained data showing only a calcium-dependent fast adaptation response. Because cochlear stereocilia do not move coherently and the hair cell response depends critically on the magnitude and time course of the hair bundle deflection, we developed a high-speed imaging technique to quantify this deflection in rat cochlear hair cells. The fluid jet delivers a force stimulus, and force steps lead to a complex time course of hair bundle displacement (mechanical creep), which affects the hair cell's macroscopic MET current response by masking the time course of the fast adaptation response. Modifying the fluid-jet stimulus to generate a hair bundle displacement step produced rapidly adapting currents that did not depend on membrane potential, confirming that fast adaptation does not depend on calcium entry. MET current responses differ with stimulus modality and will shape receptor potentials of different hair cell types based on their in vivo stimulus mode. These transformations will directly affect how stimuli are encoded.
SIGNIFICANCE STATEMENT Mechanotransduction by sensory hair cells represents a key first step for the sound sensing ability in vertebrates. The sharp frequency tuning and wide dynamic range of sound sensation are hypothesized to require a mechanotransduction adaptation mechanism. Recent work indicated that the apparent calcium dependence of the fastest adaptation differs with the method of cochlear hair cell stimulation. Here, we reconcile existing data and show that calcium entry does not drive the fastest adaptation process, independent of the stimulation method. With force stimulation of the hair bundle, adaptation manifests differently than with displacement stimulation, indicating that the stimulation mode of the hair bundle will affect the hair cell receptor current and stimulus coding.
Keywords: adaptation, fluid jet, mechanotransduction, stereocilia
Introduction
Inner ear hair bundles comprise an array of graded length stereocilia organized in a staircase manner. Positive hair bundle deflection, defined as toward the tallest stereocilia row, increases tension in a filamentous tip link that connects adjacent rows of stereocilia. Changes in tip-link tension result in mechano-electric transduction (MET) ion channel gating.
MET adaptation is hypothesized to extend the dynamic range of the cell, control the channel's operating point, and filter incoming stimuli (Eatock et al., 1987; Crawford et al., 1989; Ricci et al., 2005). Adaptation is identified by two phenomena: (1) a decay in current amplitude (“current decay”) during a sustained hair bundle displacement, and (2) a shift in the operating point (i.e., position along the displacement axis) of the MET channel's current versus displacement relationship (“activation curve”), without a change in sensitivity (i.e., activation curve slope) during a constant displacement step, hereafter called adaptation shift (Corey and Hudspeth, 1983; Eatock et al., 1987; Crawford et al., 1989). The former is assayed using displacement steps and the latter with two-pulse experiments, where activation curves are generated before and after a sustained displacement. In non-mammalian vertebrates, at least two adaptation processes are described (Wu et al., 1999). Slow adaptation has time constants of 10–100 ms and is hypothesized to be a calcium-dependent modulation of tip-link tension via myosin motor molecules controlling the position of the upper tip-link insertion site (Howard and Hudspeth, 1987; Gillespie and Cyr, 2004). Fast adaptation has a time constant of ∼1 ms or less and has several proposed mechanisms, all of which involve calcium (Peng et al., 2011).
Several experimental results from non-mammalian vertebrates support a model where calcium entry through MET channels is required for both fast and slow adaptation: (1) current decay occurs at negative potentials where calcium entry occurs, but not at positive potentials where calcium entry is inhibited (Assad et al., 1989; Crawford et al., 1989; Cheung and Corey, 2006). (2) Two-pulse experiments demonstrate adaptation shifts at negative potentials that are modulated with extracellular calcium concentrations (Eatock et al., 1987). (3) The time constants of fast and slow adaptation increase with increasing intracellular calcium buffering or decreasing extracellular calcium concentrations (Eatock et al., 1987; Crawford et al., 1989, 1991; Ricci and Fettiplace, 1997; Ricci et al., 1998). (4) The MET channel's resting open probability, an indicator of the activation curve operating point, increases with lower extracellular calcium concentration and upon depolarization (Crawford et al., 1989, 1991; Assad and Corey, 1992; Ricci et al., 1998). These data have been interpreted as supporting calcium-dependent adaptation mechanisms.
For in vitro MET experiments, stiff probes and fluid jets are the most common stimulators; they deliver step-like displacement or force stimuli to the hair bundle, respectively. Stiff probes directly couple to stereocilia. In contrast, fluid jets eject extracellular solution onto hair bundles from a pipette tip; the fluid velocity produces a drag force stimulus on the hair bundle (Dinklo et al., 2007).
Our previous experiments with cochlear hair cells used stiff probe stimuli. Improvements to stiff probe technology produced step-like displacement rise times as short as 11 μs (Peng et al., 2013), which provided finer temporal resolution of channel activation and adaptation properties. With this technology, we found that fast adaptation does not require calcium entry. Furthermore, changes in resting MET channel open probability alone cannot be used to support the calcium dependence of fast adaptation, because the resting open probability induced by lowering extracellular calcium or depolarization result from a lipid modulation mechanism that is separate from fast adaptation and occurs with a time constant of ∼125 ms (Peng et al., 2016).
In contrast, data acquired by other laboratories using fluid-jet stimulators with longer rise times of ∼500 μs suggested that fast adaptation is driven by calcium entry (Corns et al., 2014). In the present work, we reconcile these conflicting data and extend previous findings to demonstrate how hair bundle stimulation mode affects receptor current.
Materials and Methods
Preparation and recordings.
Animals were killed by decapitation using methods approved by the University of Colorado IACUC. Organs of Corti were dissected from postnatal day (P)6–P10 Sprague-Dawley rats (a large majority of experiments used P7–P8) of either sex. The tectorial membrane was peeled off, and the tissue was placed in recording chambers as previously described (Beurg et al., 2009). Tissue was viewed using a 60× or 100× (1.0 NA, Olympus) water-immersion objective with a Phantom Miro 320s (Vison Research) camera on a SliceScope (Scientifica) illuminated with a TLED+ 525 nm LED (Sutter Instruments). Tissue was dissected and perfused with extracellular solution containing the following (in mm): 140 NaCl, 2 KCl, 2 CaCl2, 2 MgCl2, 10 HEPES, 2 creatine monohydrate, 2 Na-pyruvate, 2 ascorbic acid, 6 dextrose, pH 7.4, and 300–310 mOsm. In addition, a gravity flow apical perfusion (AutoMate Scientific, ValveLink), using pipettes with tip sizes of 150–300 μm, provided local perfusion to the hair bundles when needed.
Electrophysiological recordings.
Whole-cell patch-clamp was achieved on the first or second row outer hair cells (OHCs) from the middle to apical cochlear turns using an Axon 200B amplifier (Molecular Devices) with thick-walled borosilicate patch pipettes (2–6 MΩ) filled with an intracellular solution containing the following (in mm): 125 CsCl, 3.5 MgCl2, 5 ATP, 5 creatine phosphate, 10 HEPES, 1 cesium BAPTA, 3 ascorbic acid, pH 7.2, and 280–290 mOsm. For the 0.1 and 10 mm BAPTA internal solution, the BAPTA concentration was adjusted accordingly, and CsCl concentrations were adjusted to reach 280–290 mOsm. Experiments were performed at 18–22°C. Whole-cell currents were low-pass filtered at 10 kHz and sampled at 0.05–1 MHz using USB-6356 (National Instruments) controlled by jClamp (SciSoft). Voltages were corrected off-line for liquid junction potentials. All experiments used −84 mV holding potential unless otherwise noted. Only cells with initially <100 pA of leak were kept for data analysis, except when using 10 mm intracellular BAPTA where <200 pA was used. Cells also required >550 pA of initial peak MET current. During a prolonged depolarization, the cell changes resting open probability (Peng et al., 2013, 2016). To have a stable baseline during the positive potential protocols, the cell was depolarized for >10 s to allow the open probability to stabilize. None of the data presented have had the baseline current zeroed.
Hair bundle stimulation and motion recording.
Hair bundles are stimulated with a custom 3D printed fluid jet driven by a piezo electric disc bender (27 mm 4.6 kHz; Murata Electronics, 7BB-27-4L0). Thin wall borosilicate pipettes were pulled to tip diameters of 5–20 μm, filled with extracellular solution, and mounted in the fluid-jet stimulator. The piezo disc bender was driven by waveforms generated using jClamp, and the signals were filtered with an 8-pole low-pass Bessel filter (L8L 90PF, Frequency Devices) at 1 kHz and variably attenuated (PA5, Tucker Davis) before being sent to a high-voltage/high-current amplifier (Crawford Amplifier) to drive the piezo disc bender. During stimulations, videos were taken of the hair bundle motion with high-speed imaging at 10,000 frames per second using the Phantom Miro 320s at 128 × 128 pixels with a 100 nm effective pixel size. Videos were saved for each stimulation and analyzed off-line. Four stimulus presentations were averaged together at each stimulus level unless otherwise stated. In some experiments, a short flexible fiber (long fibers have too much viscous drag) was used to monitor the force of the fluid-jet stimulation. Some fibers were dipped in an oil-based ink to increase fiber contrast. Photodiode measurements were done using a custom-built dual photodiode (SPOT-3D, OSI Optoelectronics) with a custom built onboard differential trans-impedance amplifier (Peng et al., 2013).
For achieving a step-like hair bundle stimulation with the fluid jet, the voltage step response was fed into a custom-built circuit that mimicked a supercharging circuit with an exponential decay (Strickholm, 1995). We required two exponential decays to achieve a step-like bundle displacement, so two supercharging circuits were used in series where variable resistors allowed modification of the decay magnitude and time constant to match the observed hair bundle creep. The decay time constants were manually adjusted for each cell to yield a step-like displacement of the hair bundle. These parameters were then fixed for both negative and positive potential protocols for that cell, and protocols were taken one after another.
Hair bundle motion analysis.
Custom MATLAB (MathWorks) scripts were used for extraction and analysis of the hair bundle motion. Movie frames were imported into MATLAB and the position of the hair bundle was extracted using a Gaussian fit to a bandpass filtered image (Ramunno-Johnson et al., 2009) for a given vertical row of pixels in the image to yield subpixel resolution. For most cells, the vertical displacement of the hair bundle near its center was taken as the displacement of the hair bundle.
Data analysis.
For three-pulse protocols, displacement and current were taken 1 ms after stimulus onset for activation curves. Normalized currents (I/Imax) were generated by subtracting the leak current defined as the smallest remaining current during the negative steps and normalizing to the peak current. Activation curves were automatically fit using MATLAB with a double Boltzmann equation:
 |
where Z1 and Z2 were the slope factors, and x0 was the set point.
For mechanical stimulus steps, a double exponential decay equation was automatically fit in MATLAB using steps that elicited ∼50% maximum current:
where τ1 and τ2 were the decay constants, and A1 and A2 were the respective amplitudes. A1/(A1+A2) is the contribution of fast adaptation, and A2/(A1+A2) is the contribution of slow adaptation to the total extent of adaptation. The displacement of the hair bundle was also fit with the same equation starting at the time point after the force stimulus plateaued, which was 0.5 ms after stimulus onset. Percentage adaptation was calculated as (1 − Isteady-state/Ipeak) × 100 for the step that was closest to 50% maximum current.
The time constant calculation based on the adaptation shifts at 10 and 50 ms was calculated using the single exponential decay equation. The amount of adaptation occurring at 10 ms is expressed as and the amount of adaptation at 50 ms is expressed as with τ expressed in milliseconds. The ratio of these is equal to 0.475 based on the measurements. This can be rearranged as follows:
 |
Graphing the left side of the equation and looking for the zero crossings indicates only one zero crossing at τ = 16.7 ms.
Experimental design and statistical analysis.
All n values presented were biological replicates of individual cells, where only one cell was used per animal. Each data point was the average of four presentations of the same stimulus intensity (technical replicates), unless otherwise noted.
Data were analyzed using jClamp, MATLAB (MathWorks), and Excel (Microsoft). Graphs were created using MATLAB and Adobe Illustrator. The mechanosensitive current/maximum mechanosensitive current was used as Popen, where we assume an observable Popen of 100%. The maximum MET current was the difference between the current values elicited from the maximal negative and maximal positive stimulation.
Statistical analysis used two-tailed t tests from MATLAB or Excel (Microsoft) unless otherwise stated. Paired tests were used when comparing across data points in the same cell. Significance (p values) was as follows:  p < 0.05, p < 0.01, p < 0.001, p < 0.0001. Data were presented as mean ± SD unless otherwise noted.
Results
Mechanical creep in hair bundle displacement
Stiff probe and fluid-jet stimulations are inherently different; the former delivers a displacement and the latter a force. With the fluid jet, the resulting stereocilia displacement elicited will vary depending on the mechanical properties of the stereocilia. For example, if the hair bundle dynamically changes its compliance during stimulation, the resulting hair bundle displacement will also change dynamically. Previous experiments measured hair bundle movement using a photodiode system (Crawford and Fettiplace, 1985; Howard and Hudspeth, 1987; Ricci et al., 2000) or calibrated the fluid-jet driver voltage to a hair bundle displacement (Corns et al., 2014, 2016; Beurg et al., 2015). The photodiode method can only image a portion of a hair bundle and assumes that the hair bundle moves as a unit. Additionally, the photodiode method is experimentally difficult for two major reasons: (1) the hair bundle needs to be precisely aligned with the photodiode, and (2) each experiment requires a calibration to convert photodiode voltage to displacement. Therefore, displacement measurements are often not done for all experiments. The fluid-jet driver voltage calibration method assumes that hair bundle mechanical properties (e.g., effective compliance) do not change for each stimulus paradigm or across different cells such that the same force always results in the same hair bundle displacement; however, it is well documented that mechanical properties change tonotopically, with voltage, and during stimulation (Howard and Hudspeth, 1987; Kennedy et al., 2005; Beurg et al., 2008; Tobin et al., 2019), therefore invalidating this assumption.
To improve the throughput of hair bundle displacement measurements, we developed a novel method to quantify cochlear hair bundle displacement on the nanometer scale using high-speed imaging with image analysis. Imaging at speeds up to 50,000 frames per second allowed tracking of the motion of the whole hair bundle in all directions in the plane of imaging. This technique is experimentally easier because: (1) only a one-time calibration of the size of each pixel is required, and (2) no precise hair bundle alignment is required. To validate our imaging technique, we compared the spatiotemporal sensitivity of the high-speed imaging technique with the photodiode technique using a flexible glass fiber attached to a piezo-electric actuator. We found similar results between the two methodologies (Fig. 1A). By allowing the stimulated glass fiber to resonate, we demonstrated that the imaging approach had both the speed and sensitivity necessary to track nanometer scale displacements on a sub-millisecond timescale (Fig. 1A, bottom).
Figure 1.
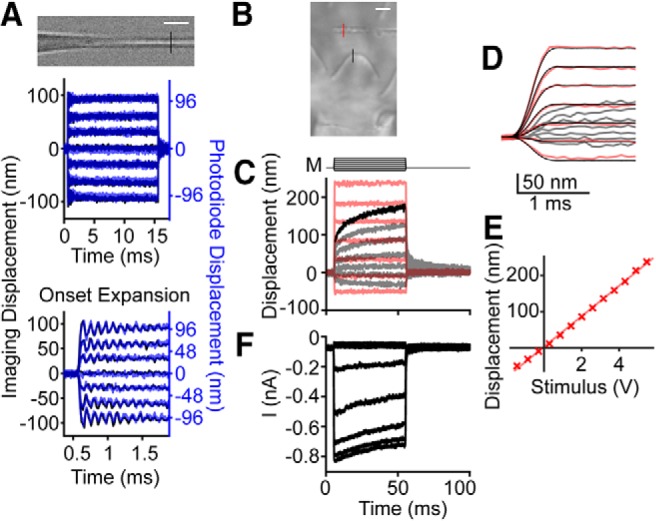
Validation of high-speed imaging and hair bundle stimulation techniques. A, High-speed imaging of an actuated flexible fiber at 50,000 frames per second (black traces) and the classical photodiode technique (blue, semitransparent) yielded similar results in fiber displacement. An expansion of the onset of the fiber displacement showed an oscillation of ∼9 kHz with both techniques. The piezo stimulus was low-pass filtered at 10 kHz. B, Image of a P9 rat OHC hair bundle is shown with a passive flexible fiber in view to serve as a readout of the force applied by the fluid jet. Colored lines indicate where motion was measured. C, In a single stimulation protocol, we monitored the fluid-jet force with the flexible fiber displacement (red, semitransparent), and we measured hair bundle displacement (gray). The hair bundle has a continued movement in the direction of the stimulation (i.e., mechanical creep, highlighted in one trace in black) even when the force from the fluid jet was step-like. M indicates the fluid-jet stimulus voltage waveform, which was low-pass filtered at 1 kHz. D, A time expansion of the onset of the fiber and hair bundle displacements from C shows the short rise time of the force step. The stimulus waveform (M, delayed and normalized) is overlaid in black to show that the stimulus voltage waveform kinetics match the force output. E, The fiber displacement plotted against the stimulus voltage indicates linearity within the stimulus range used. F, From the experiment in C, the resulting MET current at −84 mV holding potential shows the presence of slow-current decay and the absence of fast-current decay. Scale bars, 2 μm.
To confirm that the fluid-jet stimulator delivered a fast and step-like force, we used the tip displacement of a non-actuated flexible fiber as a readout of the fluid-jet force kinetics (Fig. 1B). The fiber moved as a step rising to a plateau in 0.5 ms, indicating that the fluid-jet force (Fig. 1C,D, red) had the same onset kinetics as the stimulus voltage (Fig. 1C, M traces, D, black traces). We also confirmed that force varied linearly with driver voltage by plotting the fiber displacement against the stimulus voltage (Fig. 1E). Despite a step-like fiber displacement, the hair bundle in the same field-of-view exhibited a mechanical creep (Fig. 1C, highlighted black trace), which is a continued movement in the direction of the applied force. This creep indicates an increasing effective hair bundle compliance as observed by others (Howard and Hudspeth, 1987; Russell et al., 1989; Kros et al., 2002; Kennedy et al., 2005). For the largest stimulation in 47 recorded cells, the creep was fit with a double exponential decay with time constants of τ1 = 1.8 ± 0.8 ms and τ2 = 20.4 ± 9.0 ms with the slower time constant contributing 56.0 ± 6.8% of the total creep. A double exponential fit was more suitable than a single exponential fit, because the adjusted R2 values, which accounts for the number of parameters in the fit, were significantly higher for the double exponential fit (t(46) = −17.8, p = 2.96 × 10⁻²², paired t test). The recorded MET current elicited by fluid-jet force steps did not show fast-current decays (defined as an exponential decay time constant <5 ms) but did show slow-current decays (Fig. 1F). For step sizes eliciting ∼50% of the maximum current in the same 47 cells, current decays fit with a single exponential decay had τ = 25 ± 16 ms. There was no significant difference in the adjusted R2 values for single vs double exponential decay fits (t(46) = −0.0059, p = 0.995, paired t test), indicating a single exponential fit was more suitable. These data indicate that step-like force stimuli exhibit hair bundle creep and lack fast-current decay.
We excluded the possibility that the observed creep was an artifact of underlying epithelium movement by performing the same displacement analysis on features of the epithelial surface below the hair bundle (Fig. 2A). Changes in displacement from 0.5 ms after stimulus onset to the end of the force step for the epithelial surface were much smaller than the hair bundle creep for the same stimulus intensity (Fig. 2B). These data suggest the creep was not an artifact of epithelial movement.
Figure 2.
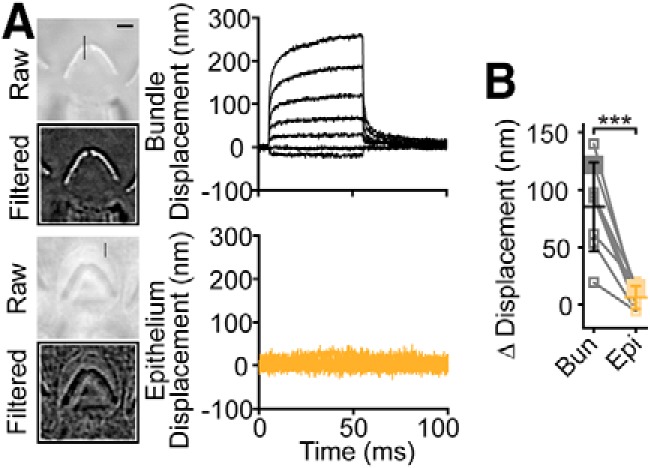
Hair-bundle creep was not due to epithelium movement. A, Stimulation of the hair bundle led to hair-bundle creep (black traces) that was not visible in the epithelium movement (orange traces). Raw and filtered images are shown with the location of measured motion shown using the vertical black line in the raw image. Horizontal scale bar, 2 μm. B, Summary of the change in displacement of the hair bundle (Bun) or epithelium (Epi) from 0.5 ms after stimulus onset to the end of the stimulus step for the largest stimulation is plotted (n = 8, t(7) = 6.18, p = 0.00045). Mean ± SD shown. Lines connect data from the same cell with the same stimulus intensity. Data from A are shown with larger symbols. ***p < 0.001.
Fast-current decay present with overshoot stimuli only at negative potentials
Unlike the MET currents previously elicited with fluid-jet stimuli (Corns et al., 2014, 2016), our MET currents did not show a fast-current decay (Fig. 1F). Upon detailed data inspection from Corns et al. (2014), we found that they applied an underdamped step response, which is characterized by an overshoot and ringing of their step stimulus. Both overshoot and ringing are visible in their data with the carbon fiber. They used two carbon fibers to characterize their force stimulus. The first fiber (8 μm diameter; Corns et al., 2014, their supplemental Fig. S2A) shows a step-like response with little to no evidence of an underdamped response. However, this fiber has a rise time of ∼2.5 ms, much longer than the expected rise time of ∼0.5 ms based on their stimulus voltage waveform. This indicates that viscous drag on their long (>2 mm) carbon fibers filtered the force readout. They also used a 10 μm diameter fiber with a shorter rise time of ∼1.9 ms, indicating less filtering and the ability to observe more of the stimulus kinetics (Corns et al., 2014, their supplemental Fig. S2B). This fiber displacement clearly shows an underdamped response. If they had a faster readout of their force stimulus with a shorter rise time of 0.5 ms (i.e., even less filtering of the response), they would likely observe an even larger initial overshoot. The possibility that their stimulus driving circuit produced ringing and that the fluid movement itself had ringing is further supported by the slow oscillations (∼133 Hz) observed in their fiber motion, which are temporally correlated with oscillations in the hair bundle displacements (Pearson's r = 0.768) and in the recorded MET current (Pearson's r = −0.775; Corns et al., 2014, their supplemental Fig. S3). We sought to test whether an underdamped stimulus could account for the fast-current decays observed by Corns et al. (2014) at negative potentials.
Because the hair bundle displacement has an initial fast creep, an overshoot of the stimulus waveform could result in an early plateau of the hair bundle displacement when the overshoot decays. The fluid-jet stimulus used by Corns et al. (2014) led to an early plateau in the hair bundle displacement (Fig. 3A, arrow, black; reproduced with permission from Corns et al., 2014, their supplemental Fig. S3). We mimicked the initial overshoot of the underdamped response to achieve a similar early plateau in the hair bundle displacement (Fig. 3A, blue) by using an overshoot stimulus with a single exponential decay back to steady state (Fig. 3B, arrow). Comparing our hair bundle displacement resulting from a step-like force to that of Corns et al. (2014) also highlights the overshoot and ringing in their hair bundle displacement (Fig. 3A, magenta vs black, arrowheads). Using an overshoot stimulation, we were able to reproduce two key results observed by Corns et al. (2014) regarding fast adaptation. (1) Fast-current decays, which look similar to current decays caused by fast adaptation, were observed at negative potentials for positive displacements and upon returning from a negative displacement (Fig. 3B, arrowheads). (2) Both of these fast-current decays were absent at positive potentials (Fig. 3B). When returning to a step-like force stimulus in the same cell, we observed our typical responses where no fast-current decays were present (Fig. 3C). Notably, these results show that a small difference in the hair bundle displacement (Fig. 3A, blue vs magenta) led to a large difference in the MET current (Fig. 3B,C), reinforcing the hair bundle's sensitivity to small displacement changes. These results indicate that the fast-current decays observed by Corns et al. (2014) could be an artifact of an underdamped stimulus and not a manifestation of fast adaptation (see Discussion).
Figure 3.
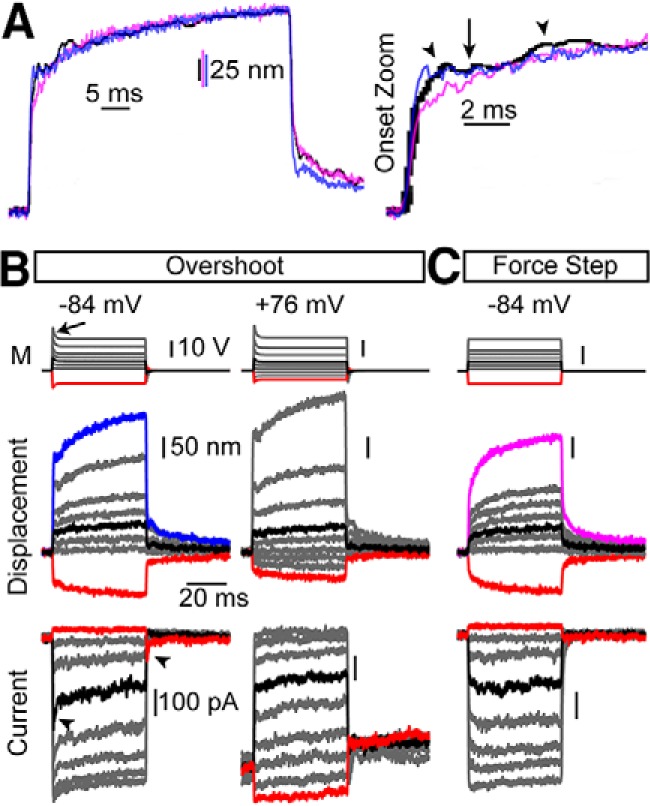
Overshoot stimuli can account for fast-current decays observed by Corns et al. (2014). A, To mimic the displacement responses shown by Corns et al. (2014) (black traces; reproduced with permission from Corns et al. (2014)), we modified our step-like force stimulus (resulting displacement in magenta) to achieve an early plateau (arrow in onset zoom) in the displacement response using an overshoot stimulus (resulting displacement in blue). An expansion of the onset is shown to the right with the early plateau (arrow) and the oscillations (arrowheads) in the black trace indicated. B, The stimulus waveform (M), resulting hair bundle displacements, and the recorded currents are plotted. Black and Red traces highlight a positive and negative hair bundle displacement and resultant current, respectively. Using 1 mm intracellular BAPTA buffer, overshoot stimuli resulted in current decays that appear like fast adaptation (arrowheads). In the same cell, the fast-current decays were absent at positive potentials with overshoot stimuli. C, When removing the overshoot and using a step-like force stimulation in the same cell, no fast-current decays are evident at negative potentials. No averaging of stimulations was used, and current traces were 5 point smoothed using MATLAB's smooth function; displacement traces of 14 lines around the apex of the hair bundle were averaged.
Adaptation shifts indicate an adaptation mechanism that does not require calcium entry
Another method to assess adaptation is measuring adaptation shifts in response to a constant adapting step with a two-pulse protocol (Eatock et al., 1987; Peng et al., 2013). Our experiments with a stiff probe in cochlear hair cells using two-pulse protocols found that the adaptation shifts for 5 ms sustained displacements were the same at negative and positive potentials (Peng et al., 2013), whereas others using a fluid jet found that adaptation shifts for 20 ms of sustained force stimuli were present at negative potentials but absent at positive potentials (Corns et al., 2014). The previous fluid-jet data did not have corresponding hair bundle displacements with each experimental paradigm; therefore, the data did not account for the mechanical creep (Corns et al., 2014, their Materials and Methods, last paragraph). Although the results are presented as current versus displacement plots, they are in fact current versus stimulus voltage plots. We performed these experiments while measuring hair bundle displacement using the high-speed imaging system, allowing us to simultaneously generate current versus stimulus voltage and current versus displacement plots. We used a three-pulse protocol where we assayed the adaptation shifts at 10 and 50 ms after the start of a sustained force step with 5 ms test pulses to generate the activation curve (Fig. 4A, M traces). We recapitulated the findings of Corns et al. (2014) with current versus stimulus voltage plots (Fig. 4A,B), where a shift occurred at negative but not positive potentials. Additionally, current decay was observed at negative, but abolished at positive potentials (Fig. 4A, arrowheads). The current decay at negative potentials during the first 10 ms of the sustained force stimulus was fit with a single exponential decay τ = 14.0 ± 1.5 ms (n = 6), a time scale consistent with slow adaptation. These results could be interpreted as only calcium-dependent adaptation mechanisms.
Figure 4.
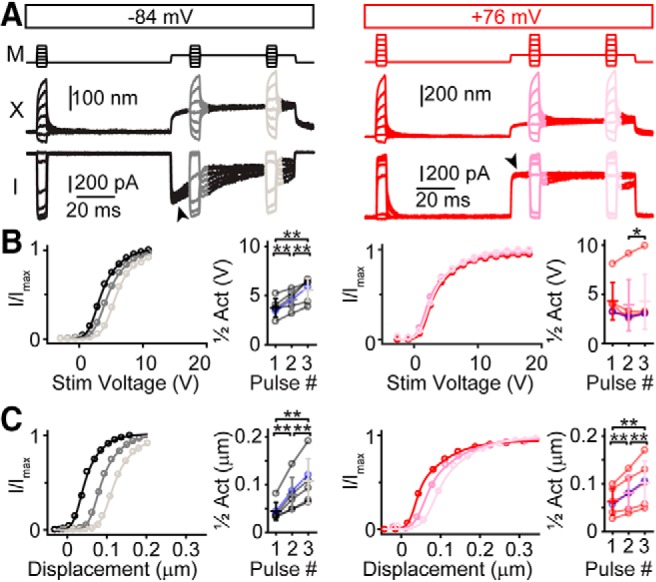
Three-pulse experiments to assay adaptation shifts using a fluid-jet stimulus and 0.1 mm BAPTA intracellular solution. A, Voltage commands for the fluid jet in a three-pulse protocol are shown (M) at −84 mV (black) and at +76 mV (red) holding potentials with measured hair bundle displacements (X) and currents (I). Arrowheads indicate current decay at negative, but not positive potentials. B, Analyzing data with the stimulus voltage showed activation curve shifts at negative potentials, but not positive potentials. Summary data of half activation points for each stimulus pulse show positive adaptation shifts at negative (n = 6; Pulses 1–2: t(5) = −5.40, p = 0.0029; Pulses 2–3 t(5) = −4.46, p = 0.0066; Pulses 1–3: t(5) = −5.07, p = 0.0039), but not positive potentials (n = 6; Pulses 1–2: t(5) = 1.20, p = 0.28; Pulses 2–3: t(5) = −2.89, p = 0.034; Pulses 1–3: t(5) = 0.0789, p = 0.94). Blue data points are from traces in A. C, Analyzing data with measured hair bundle displacement indicates adaptation shifts at both negative (n = 6; Pulses 1–2: t(5) = −4.77, p = 0.0050; Pulses 2–3: t(5) = −5.80, p = 0.0021; Pulses 1–3: t(5) = −5.24, p = 0.0033), and positive potentials (n = 6; Pulses 1–2: t(5) = −4.89, p = 0.0045; Pulses 2–3: t(5) = −4.99, p = 0.0042; Pulses 1–3: t(5) = −5.05, p = 0.0039). Data from the same cell are connected by lines with mean ± SD shown in summary plots. The relative hair bundle stiffness at positive potentials was 18 ± 16% (n = 6) less stiff than at negative potentials as measured just before the third pulse. *p < 0.05, **p < 0.01.
In contrast, plotting the same currents against measured hair bundle displacement demonstrated adaptation shifts at both negative and positive potentials (Fig. 4C). These data suggested that adaptation shifts and current decays were decoupled when using sustained force stimuli because adaptation shifts occurred in the absence of current decays at positive potentials. Unlike our data with stiff probes (Peng et al., 2013), adaptation shifts with the fluid jet were significantly larger at negative potentials (35 ± 18 nm at 10 ms and 63 ± 30 nm at 50 ms, n = 6) than at positive potentials (19 ± 9 nm at 10 ms and 40 ± 19 nm at 50 ms, n = 6; t(5) = 2.87, p = 0.035 at 10 ms and t(5) = 3.23, p = 0.023 at 50 ms). These data could be interpreted in two ways with regard to the calcium dependence of adaptation. One interpretation is that because adaptation shifts occurred at positive potentials, there is an adaptation process that is not driven by calcium entry. The observation that the adaptation shifts were larger at negative potentials as compared with positive potentials would indicate that there is a second calcium-dependent adaptation process; this could be the slow adaptation studied by others with a time course of ∼10 ms (Eatock et al., 1987; Assad et al., 1989). An alternative interpretation is that all the adaptation observed at positive potentials is residual calcium-dependent slow adaptation. The motor model of slow adaptation does not preclude slow adaptation from occurring at positive potentials, because only the rate of adaptation is modulated by calcium entry (Gillespie and Cyr, 2004). Although this is theoretically possible for the motor model, it has not been observed in non-mammalian hair cells, as no slow-current decays resulting from displacement steps are observed during depolarization (Assad et al., 1989; Crawford et al., 1989, 1991; Assad and Corey, 1992). Here, the adaptation shift at positive potentials after 10 ms was 47.5% of the shift after 50 ms. If all of the adaptation shift was due to slow adaptation, then based on the single exponential decay equation, the time constant of the slow adaptation at positive potentials would need to be 16.7 ms (for calculation, see Materials and Methods), similar to the slow adaptation time constant at negative potentials of 14 ms. Because the time constants would be similar at negative and positive potentials, this would not fit with the motor model of slow adaptation, which predicts that the rate of adaptation at positive potentials is much slower than at negative potentials (Assad and Corey, 1992; Gillespie and Cyr, 2004). Therefore, the more likely interpretation is the existence of two adaptation mechanisms that differ in calcium dependence: a fast adaptation that does not require calcium entry and a slow adaptation that depends on calcium.
Step-like displacement stimulations with the fluid jet unmask fast-current decays
To further support the existence of two adaptation mechanisms with different calcium requirements, we tested whether fast-current decays could be observed at positive potentials using step-like displacement stimuli. We wondered whether the fast-current decays were masked by the hair bundle creep (Fig. 1C), where continued hair bundle movement counteracted the current decay and would be responsible for the lack of visible fast-current decays with step-like force stimuli. To test this, we designed a circuit to modify the fluid-jet voltage waveform to create a step-like displacement of the hair bundle (Fig. 5A). To limit the contribution of calcium-dependent adaptation mechanisms, we used a high intracellular calcium buffer (10 mm BAPTA) in these experiments. We applied both step-like force and step-like displacement stimuli on the same cell for these experiments. Consistent with Figures 1F and 3C, fast-current decays were absent at both negative and positive potentials with step-like force stimuli (Fig. 5A). In the same cell with step-like displacement stimuli, fast-current decays were present at both negative and positive potentials (Fig. 5A, arrowheads). For displacement steps eliciting ∼50% maximum current, the fast-current decay was similar at negative and positive potentials: at negative potentials it had a time constant of 1.6 ± 1.2 ms and contributed 34 ± 13% (n = 7) of the total extent of adaptation, and at positive potentials it had a time constant of 1.8 ± 1.4 ms and contributed 29 ± 17% (n = 6) of the total extent of adaptation (t(5) = −0.0058, p = 0.996 and t(5) = −1.13, p = 0.31, respectively; paired t test between negative and positive potentials). The slow-current decay, on the other hand, was faster at negative potentials (15 ± 3 ms; n = 7) than at positive potentials (59 ± 41 ms; n = 6; t(5) = −2.52, p = 0.053, paired t test). A double exponential fit was significantly better than a single exponential fit based on the adjusted R2 value (t(6) = −3.00, p = 0.024 for negative potentials and t(5) = −3.27, p = 0.022 for positive potentials, paired t test). These data further support that all adaptation at positive potentials cannot be accounted for by residual slow adaptation, because a measured time constant of 1.8 ms (Fig. 5A) is too fast for slow adaptation. The fast-current decays at both negative and positive potentials (Fig. 5A, arrowheads) supported the conclusion that fast adaptation was not driven by calcium entry.
Figure 5.

Step-like hair bundle displacement with the fluid jet unmasked fast adaptation in the current response. A, At negative potentials, step-like force stimulation (black) resulted in hair bundle creep with no visible fast adaptation in the current. With step-like displacement stimuli (gray), fast adaptation in the current was visible (inset, arrowhead). Similarly, at positive potentials, no fast adaptation was observed with step-like force stimulation (red), but fast adaptation was unmasked with step-like displacements (pink, arrowhead). Displacement was measured in the vertical direction near the middle of the hair bundle at the same location for each stimulus paradigm. Inset traces are expanded to fill the space to better see the onset of the stimuli. B, Summary of the amount of total adaptation at the 50 ms time point between the step-like force and step-like displacement stimulation showed a significant difference between force and displacement stimuli (n = 7, −84 mV: t(6) = −9.25, p = 0.000090; n = 6, +76 mV: t(5) = −7.71, p = 0.00038). C, The amount of adaptation at 5 ms would have most fast adaptations complete and a small contribution from the slow adaptation process. Adaptation at 5 ms also showed a significant increase indicating the presence of fast adaptation (n = 7, −84 mV: t(6) = −10.06, p = 0.000056; n = 6, +76 mV: t(5) = −3.29, p = 0.022). D, The difference in adaptation between the 50 and 5 ms time points would be almost completely composed of slow adaptation. This had a significant increase at +76 mV with step-like displacements (n = 7, −84 mV: t(6) = −2.77, p = 0.032; n = 6, +76 mV: t(5) = −5.18, p = 0.0028). For all adaptation quantifications, step-like displacement responses were not significantly different between negative and positive potentials. E, Using step-like displacements shortens the time to peak current at both negative and positive potentials (n = 7, −84 mV: t(6) = 4.05, p = 0.0067; n = 6, +76 mV: t(5) = 4.68, p = 0.0038), but not significantly different when comparing negative and positive potentials (t(5) = −1.24, p = 0.27). Filled data points are from the example cell in A. Data from the same cell is connected with lines with mean ± SD shown in summary plots. *p < 0.05, **p < 0.01, ***p < 0.001, ****p < 0.0001.
With step-like displacements, the amount of adaptation increased significantly. A fast time constant of <2 ms and a slow time constant of >10 ms suggests that the total adaptation measured at 5 ms is predominately fast adaptation. We used the difference in total adaptation between the time points of 50 and 5 ms to quantify slow adaptation. The amount of total adaptation observed as current decays increased with step-like displacements at 50 ms (Fig. 5B), 5 ms (C), and between 5 and 50 ms (D) for both negative and positive potentials with no significant difference between the two potentials (t(5) = 0.548, 1.65, −0.631 and p = 0.61, 0.16, 0.56, respectively). The time to peak current decreased with displacement stimuli (Fig. 5E), indicating that the current onset is slower with force stimuli. Across negative and positive potentials, step-like displacements increased the adaptation at 5 ms by 17 ± 8% and the adaptation between 5 and 50 ms by 12 ± 8%, indicating that the step-like displacements led to a greater enhancement of fast-current decays.
Discussion
Our data indicate that stimulus mode affects how adaptation manifests. Step-like force stimuli results in a mechanical creep with two time constants, which masks the fast-current decay associated with fast adaptation. Step-like displacement stimuli result in fast-current decays at both negative and positive potentials. These data with the fluid jet are consistent with our stiff probe data (Peng et al., 2013), demonstrating that fast adaptation is not driven by calcium entry. Additionally, stimulus mode can change the time-dependent manifestation of MET currents, which provides insight into likely differences between in vivo inner hair cell (IHC) and OHC responses solely based on stimulus modality.
Fast adaptation is not driven by calcium entry
After we proposed that calcium entry does not drive fast adaptation (Peng et al., 2013), others suggested that the results we observed with the stiff probe were a stimulus artifact (Corns et al., 2014). However, we found that PIP2 depletion resulted in a loss of fast adaptation with stiff probe stimuli (Effertz et al., 2017), indicating that fast adaptation observed with the stiff probe is not a stimulus artifact.
The resting open probability increases with low extracellular calcium or depolarization, and adaptation regulates open probability; therefore it has been argued that low extracellular calcium and depolarization regulate adaptation. However, cochlear hair cells can regulate resting open probability independent from fast adaptation by modulating the lipid membrane (Peng et al., 2016). Therefore, direct assays are required to test whether calcium entry drives fast adaptation.
We now demonstrate that data from Corns et al. (2014) using the fluid jet to support calcium-driven fast adaptation can have a different interpretation. Importantly, force and displacement stimuli are not the same. When assaying adaptation with a fluid jet, hair bundle displacement must be quantified because of hair bundle creep. When measuring hair bundle displacement, all adaptation is not driven by calcium entry in three-pulse experiments (Fig. 4).
We also hypothesize that Corns et al. (2014) used an underdamped stimulus that created a time-dependent decrease in current amplitude that appeared to be fast adaptation. We simulated their underdamped stimulus with an overshoot stimulus (Fig. 3), which resulted in fast time-dependent current decays at negative but not positive potentials, consistent with their observations. This result can be misinterpreted as fast adaptation driven by calcium, when it is because of a stimulus artifact.
Interestingly, overshoot stimuli can result in current decays at negative, but not positive potentials (Fig. 3B). Initially, we expected the overshoot artifact to cause a similar response at negative and positive potentials. The different responses indicate that there are some properties that are modulated by voltage. One possible property is current rise time. At positive potentials, the current rise time is trending longer (Fig. 5E). When the overshoot artifact occurs during a longer current rise, it can shorten the current rise time and mask the current decay observed at negative potentials (Fig. 6A). This idea is supported by the negative correlation between the time to peak current and the percentage adaptation at 5 ms (Fig. 6B). Another contributing factor to the lack of fast-current decays at positive potentials with an overshoot stimulus is the presence of the slower hair bundle creep component. The slow creep causes further displacement and more MET channel openings, which can mask any fast-current decay or make the current appear to have a stimulus anomaly, rather than being interpreted as a current decay. For example, in the study by Kros et al. (2002), their Figure 2B shows hints of a fast-current decay at positive potentials, but the continued current rise due to the slower creep makes the current decay appear like a small notch and not the result of a fast adaptation mechanism. These are possible explanations to how previous data may have been misinterpreted, but further studies are required to determine how extracellular calcium and intracellular calcium buffering may mask the current decay response.
Figure 6.
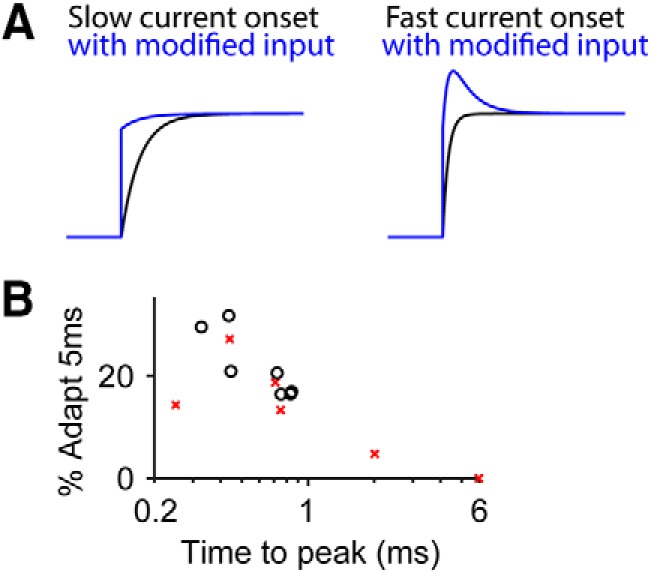
Effect of current rise time on the measured adaptation percentage. A, With the hair-bundle creep masking the fast-current decays, the current rise time could lengthen. Therefore, a cell with a long current rise time when using a step-like force stimulus would have a shorter current rise time with a step-like displacement stimulus. With a long current rise time, adding an exponential decay function to the curve may only shorten the current rise time (left), but adding the same exponential decay function to a short current rise time results in current decay. The exponential decay function is similar to what the modified stimulus may do to achieve a step-like displacement. B, For step-like displacements, there was also an inverse correlation between the total adaptation at 5 ms and the time to peak current as seen in the plot of the percentage adaptation at 5 ms versus the base 10 log of the time to peak current for step-like displacement stimulation at negative (black circle) and positive potentials (red x). Pearson's correlation coefficient = −0.80, p = 0.0011. The inverse correlation may account for the nonsignificant differences between the total adaptation at 5 ms between negative and positive potentials for step-like displacements (Fig. 5C), because at negative potentials, shorter times to peak current tended to be observed (Fig. 5E).
The most convincing result is the appearance of fast-current decays with a fluid-jet stimulus regardless of membrane potential when the driving voltage is modified to achieve a step-like displacement. The step-like displacement most closely mimics the typical step stimulus of a stiff probe. The differences between stimulation methods are complex, such that we do not expect that providing a displacement stimulus with the fluid jet would result in the identical response we observe with the stiff probe. Notably, the extent of fast adaptation appears greater with the stiff probe (Peng et al., 2013) than with the fluid jet (Fig. 5A). This discrepancy may be caused by multiple differences in the characteristics of the stimulation methods. Lengthening the stimulation rise time increases the fast adaptation time constant and reduces its extent (Wu et al., 1999; Nam et al., 2015); so differences in stimulus rise times between stimulation methods are likely a major contributing factor. Other contributing factors are the differences in mechanical loading of the hair bundle (e.g., stiff probes touch and therefore load the hair bundle, whereas fluid jets do not) and pulling of shorter rows of stereocilia due to taller rows moving (e.g., stimulating only the tallest row) versus pushing shorter row stereocilia directly (possible with fluid jet stimuli). A combination of these factors likely accounts for the adaptation extent discrepancy. Although the exact responses differ, the basic result remains valid, i.e., that fast adaptation exists at positive potentials and is not driven by calcium entry.
Mechanisms of adaptation
Adaptation is hypothesized to contribute to the hair cell's dynamic range and frequency selectivity (Crawford et al., 1989; Ricci et al., 2005); therefore, determining its mechanism is important. Knowing that fast adaptation is not driven by calcium entry is an important step to narrow down the possible mechanisms. The manifestation of adaptation can differ depending on the mode of stimulation; we observe current decays for displacement steps and hair bundle creep for force steps. This suggests that the hair bundle creep could be a manifestation of fast adaptation (Kennedy et al., 2005). One attractive mechanistic model of the creep is viscoelasticity, which is modeled with a spring and dashpot and could indicate a viscoelastic process underlies fast adaptation (Howard and Hudspeth, 1987; Vollrath and Eatock, 2003). No direct evidence yet exists in support of a unique mechanism for fast adaptation.
The finding that cochlear hair bundles are sensitive to stimulus modality provides insight into the physiological and morphological differences between free-standing IHC bundles and tectorial membrane embedded OHC bundles. The free-standing IHC bundle response will be shaped by a combination of the fluid flow near the hair bundle and the hair bundle mechanical properties that act to prolong the stimulus response. Thus, it is less likely that fast adaptation will manifest itself as a current decay in IHCs, resulting in more sustained responses and allowing the cell to act more as a simple stimulus detector. Importantly, this does not mean that fast adaptation does not occur, it simply manifests differently in time. The measured current response is an interplay between the stimulus type, the stimulus rate, the hair bundle mechanics, and adaptation. Understanding the fluid mechanics in the boundary layer under the tectorial membrane is required to appreciate the IHC bundle motion in vivo. The fluid flow may serve to synchronize the stereocilia such that the hair bundle moves cohesively; the level of this stereocilia synchronization may dictate how fast adaptation manifests itself.
In contrast, OHCs are excited by the tectorial membrane. They likely receive a displacement-like stimulus to the tallest stereocilia row (Row 1) and are predicted to have adaptation manifest as a time-dependent current decay. This type of response would result in high-pass filtering for sinusoidal signals (Ricci et al., 2005). However, the actual scenario may be more complex. The mechanical properties of linkages between the tectorial membrane and the stereocilia as well as the relative differences in mechanical properties of the tectorial membrane and the hair bundle can change the stimulus properties. Understanding these potential stimulus transformations through investigating hair bundle motion in vivo is critical in estimating how adaptation will manifest itself.
Our data also confirm the presence of a calcium-dependent adaptation mechanism with time constants of ∼10 ms. Our previous work suggested a calcium-dependent regulation of open probability that is inconsistent with the long-standing motor model of adaptation (Peng et al., 2016). The motor model proposes that myosin motors dynamically adjust the upper tip-link insertion site to modulate force transfer to MET channels depending on the local calcium levels from calcium entry through MET channels. In cochlear hair cells, MET channels are localized at the lower end of tip links (Beurg et al., 2009) therefore can only indirectly affect ∼50% of the upper insertion sites (i.e., Row 2 channels affect the upper tip-link insertion of Row 3 channels). Thus, alternative mechanisms for calcium-dependent adaptation are needed to better accommodate existing data from cochlear hair cells. Tip-link tensioning remains an important component of force transfer to MET channels for generating maximum sensitivity. Myosin motors may be involved in this, but it is separate from adaptation (Peng et al., 2016).
Footnotes
This work was supported by R00 DC013299 and R01 DC016868 to A.W.P., by R01 DC003896 to A.J.R., by core Grant P30-44992, and by T32 NS099042 to A.A.M. We thank Kurt Beam and David Corey for critical feedback on earlier versions of this paper.
The authors declare no competing financial interests.
References
- Assad JA, Corey DP (1992) An active motor model for adaptation by vertebrate hair cells. J Neurosci 12:3291–3309. 10.1523/JNEUROSCI.12-09-03291.1992 [DOI] [PMC free article] [PubMed] [Google Scholar]
- Assad JA, Hacohen N, Corey DP (1989) Voltage dependence of adaptation and active bundle movement in bullfrog saccular hair cells. Proc Natl Acad Sci U S A 86:2918–2922. 10.1073/pnas.86.8.2918 [DOI] [PMC free article] [PubMed] [Google Scholar]
- Beurg M, Nam JH, Crawford A, Fettiplace R (2008) The actions of calcium on hair bundle mechanics in mammalian cochlear hair cells. Biophys J 94:2639–2653. 10.1529/biophysj.107.123257 [DOI] [PMC free article] [PubMed] [Google Scholar]
- Beurg M, Fettiplace R, Nam JH, Ricci AJ (2009) Localization of inner hair cell mechanotransducer channels using high-speed calcium imaging. Nat Neurosci 12:553–558. 10.1038/nn.2295 [DOI] [PMC free article] [PubMed] [Google Scholar]
- Beurg M, Goldring AC, Fettiplace R (2015) The effects of Tmc1 beethoven mutation on mechanotransducer channel function in cochlear hair cells. J Gen Physiol 146:233–243. 10.1085/jgp.201511458 [DOI] [PMC free article] [PubMed] [Google Scholar]
- Cheung EL, Corey DP (2006) Ca2+ changes the force sensitivity of the hair-cell transduction channel. Biophys J 90:124–139. 10.1529/biophysj.105.061226 [DOI] [PMC free article] [PubMed] [Google Scholar]
- Corey DP, Hudspeth AJ (1983) Analysis of the microphonic potential of the bullfrog's sacculus. J Neurosci 3:942–961. 10.1523/JNEUROSCI.03-05-00942.1983 [DOI] [PMC free article] [PubMed] [Google Scholar]
- Corns LF, Johnson SL, Kros CJ, Marcotti W (2014) Calcium entry into stereocilia drives adaptation of the mechanoelectrical transducer current of mammalian cochlear hair cells. Proc Natl Acad Sci U S A 111:14918–14923. 10.1073/pnas.1409920111 [DOI] [PMC free article] [PubMed] [Google Scholar]
- Corns LF, Johnson SL, Kros CJ, Marcotti W (2016) Tmc1 point mutation affects Ca2+ sensitivity and block by dihydrostreptomycin of the mechanoelectrical transducer current of mouse outer hair cells. J Neurosci 36:336–349. 10.1523/JNEUROSCI.2439-15.2016 [DOI] [PMC free article] [PubMed] [Google Scholar]
- Crawford AC, Fettiplace R (1985) The mechanical properties of ciliary bundles of turtle cochlear hair cells. J Physiol 364:359–379. 10.1113/jphysiol.1985.sp015750 [DOI] [PMC free article] [PubMed] [Google Scholar]
- Crawford AC, Evans MG, Fettiplace R (1989) Activation and adaptation of transducer currents in turtle hair cells. J Physiol 419:405–434. 10.1113/jphysiol.1989.sp017878 [DOI] [PMC free article] [PubMed] [Google Scholar]
- Crawford AC, Evans MG, Fettiplace R (1991) The actions of calcium on the mechano-electrical transducer current of turtle hair cells. J Physiol 434:369–398. 10.1113/jphysiol.1991.sp018475 [DOI] [PMC free article] [PubMed] [Google Scholar]
- Dinklo T, Meulenberg CJ, van Netten SM (2007) Frequency-dependent properties of a fluid jet stimulus: calibration, modeling, and application to cochlear hair cell bundles. J Assoc Res Otolaryngol 8:167–182. 10.1007/s10162-007-0080-0 [DOI] [PMC free article] [PubMed] [Google Scholar]
- Eatock RA, Corey DP, Hudspeth AJ (1987) Adaptation of mechanoelectrical transduction in hair cells of the bullfrog's sacculus. J Neurosci 7:2821–2836. 10.1523/JNEUROSCI.07-09-02821.1987 [DOI] [PMC free article] [PubMed] [Google Scholar]
- Effertz T, Becker L, Peng AW, Ricci AJ (2017) Phosphoinositol-4,5-bisphosphate regulates auditory hair-cell mechanotransduction-channel pore properties and fast adaptation. J Neurosci 37:11632–11646. 10.1523/JNEUROSCI.1351-17.2017 [DOI] [PMC free article] [PubMed] [Google Scholar]
- Gillespie PG, Cyr JL (2004) Myosin-1c, the hair cell's adaptation motor. Annu Rev Physiol 66:521–545. 10.1146/annurev.physiol.66.032102.112842 [DOI] [PubMed] [Google Scholar]
- Howard J, Hudspeth AJ (1987) Mechanical relaxation of the hair bundle mediates adaptation in mechanoelectrical transduction by the bullfrog's saccular hair cell. Proc Natl Acad Sci U S A 84:3064–3068. 10.1073/pnas.84.9.3064 [DOI] [PMC free article] [PubMed] [Google Scholar]
- Kennedy HJ, Crawford AC, Fettiplace R (2005) Force generation by mammalian hair bundles supports a role in cochlear amplification. Nature 433:880–883. 10.1038/nature03367 [DOI] [PubMed] [Google Scholar]
- Kros CJ, Marcotti W, van Netten SM, Self TJ, Libby RT, Brown SD, Richardson GP, Steel KP (2002) Reduced climbing and increased slipping adaptation in cochlear hair cells of mice with Myo7a mutations. Nat Neurosci 5:41–47. 10.1038/nn784 [DOI] [PubMed] [Google Scholar]
- Nam JH, Peng AW, Ricci AJ (2015) Underestimated sensitivity of mammalian cochlear hair cells due to splay between stereociliary columns. Biophys J 108:2633–2647. 10.1016/j.bpj.2015.04.028 [DOI] [PMC free article] [PubMed] [Google Scholar]
- Peng AW, Salles FT, Pan B, Ricci AJ (2011) Integrating the biophysical and molecular mechanisms of auditory hair cell mechanotransduction. Nat Commun 2:523. 10.1038/ncomms1533 [DOI] [PMC free article] [PubMed] [Google Scholar]
- Peng AW, Effertz T, Ricci AJ (2013) Adaptation of mammalian auditory hair cell mechanotransduction is independent of calcium entry. Neuron 80:960–972. 10.1016/j.neuron.2013.08.025 [DOI] [PMC free article] [PubMed] [Google Scholar]
- Peng AW, Gnanasambandam R, Sachs F, Ricci AJ (2016) Adaptation independent modulation of auditory hair cell mechanotransduction channel open probability implicates a role for the lipid bilayer. J Neurosci 36:2945–2956. 10.1523/JNEUROSCI.3011-15.2016 [DOI] [PMC free article] [PubMed] [Google Scholar]
- Ramunno-Johnson D, Strimbu CE, Fredrickson L, Arisaka K, Bozovic D (2009) Distribution of frequencies of spontaneous oscillations in hair cells of the bullfrog sacculus. Biophys J 96:1159–1168. 10.1016/j.bpj.2008.09.060 [DOI] [PMC free article] [PubMed] [Google Scholar]
- Ricci AJ, Fettiplace R (1997) The effects of calcium buffering and cyclic AMP on mechano-electrical transduction in turtle auditory hair cells. J Physiol 501:111–124. 10.1111/j.1469-7793.1997.111bo.x [DOI] [PMC free article] [PubMed] [Google Scholar]
- Ricci AJ, Wu YC, Fettiplace R (1998) The endogenous calcium buffer and the time course of transducer adaptation in auditory hair cells. J Neurosci 18:8261–8277. 10.1523/JNEUROSCI.18-20-08261.1998 [DOI] [PMC free article] [PubMed] [Google Scholar]
- Ricci AJ, Crawford AC, Fettiplace R (2000) Active hair bundle motion linked to fast transducer adaptation in auditory hair cells. J Neurosci 20:7131–7142. 10.1523/JNEUROSCI.20-19-07131.2000 [DOI] [PMC free article] [PubMed] [Google Scholar]
- Ricci AJ, Kennedy HJ, Crawford AC, Fettiplace R (2005) The transduction channel filter in auditory hair cells. J Neurosci 25:7831–7839. 10.1523/JNEUROSCI.1127-05.2005 [DOI] [PMC free article] [PubMed] [Google Scholar]
- Russell IJ, Richardson GP, Kössl M (1989) The responses of cochlear hair cells to tonic displacements of the sensory hair bundle. Hear Res 43:55–69. 10.1016/0378-5955(89)90059-2 [DOI] [PubMed] [Google Scholar]
- Strickholm A. (1995) A supercharger for single electrode voltage and current clamping. J Neurosci Methods 61:47–52. 10.1016/0165-0270(95)00022-M [DOI] [PubMed] [Google Scholar]
- Tobin M, Chaiyasitdhi A, Michel V, Michalski N, Martin P (2019) Stiffness and tension gradients of the hair cell's tip-link complex in the mammalian cochlea. eLife 8:e43473. 10.7554/eLife.43473 [DOI] [PMC free article] [PubMed] [Google Scholar]
- Vollrath MA, Eatock RA (2003) Time course and extent of mechanotransducer adaptation in mouse utricular hair cells: comparison with frog saccular hair cells. J Neurophysiol 90:2676–2689. 10.1152/jn.00893.2002 [DOI] [PubMed] [Google Scholar]
- Wu YC, Ricci AJ, Fettiplace R (1999) Two components of transducer adaptation in auditory hair cells. J Neurophysiol 82:2171–2181. 10.1152/jn.1999.82.5.2171 [DOI] [PubMed] [Google Scholar]