Abstract
The primary visual cortex contains a detailed map of retinal stimulus position (retinotopic map) and eye input (ocular dominance map) that results from the precise arrangement of thalamic afferents during cortical development. For reasons that remain unclear, the patterns of ocular dominance are very diverse across species and can take the shape of highly organized stripes, convoluted beads, or no pattern at all. Here, we use a new image-processing algorithm to measure ocular dominance patterns more accurately than in the past. We use these measurements to demonstrate that ocular dominance maps follow a common organizing principle that makes the cortical axis with the slowest retinotopic gradient orthogonal to the ocular dominance stripes. We demonstrate this relation in multiple regions of the primary visual cortex from individual animals, and different species. Moreover, consistent with the increase in the retinotopic gradient with visual eccentricity, we demonstrate a strong correlation between eccentricity and ocular dominance stripe width. We also show that an eye/polarity grid emerges within the visual cortical map when the representation of light and dark stimuli segregates along an axis orthogonal to the ocular dominance stripes, as recently demonstrated in cats. Based on these results, we propose a developmental model of visual cortical topography that sorts thalamic afferents by eye input and stimulus polarity, and then maximizes the binocular retinotopic match needed for depth perception and the light-dark retinotopic mismatch needed to process stimulus orientation. In this model, the different ocular dominance patterns simply emerge from differences in local retinotopic cortical topography.
SIGNIFICANCE STATEMENT Thalamocortical afferents segregate in primary visual cortex by eye input and light-dark polarity. This afferent segregation forms cortical patterns that vary greatly across species for reasons that remain unknown. Here we show that the formation of ocular dominance patterns follows a common organizing principle across species that aligns the cortical axis of ocular dominance segregation with the axis of slowest retinotopic gradient. Based on our results, we propose a model of visual cortical topography that sorts thalamic afferents by eye input and stimulus polarity along orthogonal axes with the slowest and fastest retinotopic gradients, respectively. This organization maximizes the binocular retinotopic match needed for depth perception and the light-dark retinotopic mismatch needed to process stimulus orientation in carnivores and primates.
Keywords: ocular dominance, plasticity, receptive field, thalamocortical, thalamus, visual cortex
Introduction
The human primary visual cortex needs to accommodate ∼3 million afferents from the lateral geniculate nucleus of the thalamus (Selemon and Begovic, 2007) and sort them by their receptive field position within the retina. The afferent sorting along the anteroposterior and mediolateral axes of the cortex creates a detailed map of retinal spatial position known as the retinotopic map (Daniel and Whitteridge, 1961). In species with high visual acuity and large brains, such as humans and macaques, the retinotopic map splits into two intercalated copies for each eye forming an ocular dominance map with a zebra pattern (LeVay et al., 1975; Hubel and Wiesel, 1977). In addition, evidence from cat visual cortex (Kremkow et al., 2016) indicates that the retinotopic map for each eye also splits into two copies for each contrast polarity (light and dark), forming an eye/polarity grid (Kremkow and Alonso, 2018).
The ocular dominance pattern of primary visual cortex varies across species (LeVay et al., 1985; Anderson et al., 1988; Spatz, 1989; Adams and Horton, 2003; Adams et al., 2007; Takahata et al., 2014), within the same species (Adams and Horton, 2003, 2006), and across local cortical regions of the same individual animal (Adams et al., 2007). Although this pronounced variability appears capricious (Adams and Horton, 2003), some ocular dominance maps show consistent relations with cortical retinotopy, suggesting a common organizing principle. For example, in humans and macaques, ocular dominance stripes run orthogonal to the cortical border between areas V1 and V2, which represents the retinotopy of the visual vertical meridian (Hubel and Wiesel, 1974a; Tootell et al., 1988; Blasdel and Campbell, 2001; Adams et al., 2007). Because cortical retinotopy changes slower along than across the V1/V2 border (Blasdel and Campbell, 2001), the ocular dominance stripes also run orthogonal to the cortical axis with the slowest retinotopy gradient.
Hubel and Wiesel interpreted the organization of ocular dominance stripes at the V1/V2 border as a cortical need to accommodate thalamic inputs sampling two copies of the same image with two frontal eyes (LeVay et al., 1975; Hubel and Wiesel, 1977). In the ice-cube model of Hubel and Wiesel, each image copy needs a square patch of cortex, and two image copies form a rectangle with a length/width ratio of two. Under this interpretation, the longest axis of the ocular dominance stripes should run orthogonal to the longest side of the retinotopic rectangle, which is the V1/V2 border. Although this reasoning is compelling, the relation between retinotopy and ocular dominance remained unclear. First, the length/width retinotopy ratio of the ocular dominance stripes is considerably <2 and closer to 1.4 (Tootell et al., 1982, 1988; Van Essen et al., 1984; Blasdel and Campbell, 2001). Second, the relation between the ocular dominance domains and the V1/V2 border is weak or absent in many species, including cats and squirrel monkeys (Anderson et al., 1988; Horton and Hocking, 1996). Third, ocular dominance maps are absent in many animals with extensive binocular cortices, including some squirrel monkeys (Adams and Horton, 2003, 2006), and adult marmosets that did not experience monocular deprivation (DeBruyn and Casagrande, 1981; Spatz, 1989). Finally, the ocular dominance map of an individual human can have diverse local patterns with some regions resembling the organized stripes of macaques and others the more disorganized stripes of squirrel monkeys (Adams et al., 2007). There is currently no explanation for this puzzling variability of ocular dominance patterns. Here, we reveal a strong relationship between local cortical retinotopy and ocular dominance in different species and different regions of the same cortical map. Based on these results, we propose a cortical model that generates variations in ocular dominance patterns from variations in local cortical retinotopy. This model has implications for cortical sampling in binocular vision and predicts systematic changes in eye dominance across the horizontal axis of the visual field.
Materials and Methods
We used an image-processing algorithm to measure the image parameters that distinguish different ocular dominance patterns in nature. We then used a difference-of-Gaussians filter to simulate the patterns published in the scientific literature and replicate the measurements obtained with the image-processing algorithm. The software is publicly available on Github (https://github.com/LabAlonsoSunyOptometry/NajafianODSoftware; RRID:SCR_017381).
Measuring ocular dominance patterns with an image-processing algorithm.
The image-processing algorithm can be applied to published ocular dominance maps from different species of either sex (the sex is not mentioned if it is not reported in the original publication). It starts by selecting and counting all individual stripes within the pattern, each stripe being defined as a group of white pixels surrounded by black pixels or vice versa. Then, the algorithm uses the MATLAB “bwmorph” function to shrink the stripe to a minimally connected central line and measures the stripe length by counting the pixels within this central line. The algorithm measures the average stripe width as the average length of multiple lines orthogonal to the central line and connecting the two stripe borders. It measures the average angle of the stripe with two different methods: pixel-by-pixel method and Fourier method. In the pixel-by-pixel method, it measures the angle of a line crossing two neighboring pixels within the central line of the stripe. In the Fourier method, it measures the dominant angle of a cortical patch with Fourier image analysis. We use the pixel-by-pixel method to describe the angle for each pixel and the Fourier method to describe the dominant angle of a cortical patch.
Modeling the afferent-sorting filter (ASF).
We model a family of ASFs to accurate replicate the different ocular dominance patterns published in the scientific literature. The ASFs are inspired by the work of Swindale (1980) and simulate the sorting of thalamic afferents in visual cortex during cortical development. We first measure the parameters of published ocular dominance patterns with the image-processing algorithm and then use these parameters to search for the ASF that best describes each published ocular dominance pattern. We model ASFs with a difference of two multivariate Gaussian functions, as illustrated in Equations 1–3 as follows:
 |
 |
Where x and y (lowercase) are positions in cortical space along the mediolateral (x) and anteroposterior (y) axis. X and Y (uppercase) are vectors containing a subset of x (X vector) and y (Y vector) positions. σx and σy are the standard deviations (SDs) of the X and Y vectors, and μx and μy are the central positions. ρ is the angle of the filter (Eq. 2), which is calculated as a dot product of the X and Y vectors divided by their magnitudes (i.e., the square root of the sum of the squared elements of each vector). The ASF results from the difference of two multivariate Gaussian functions representing the filter center (fcenter) and surround (fsurround). σc is the SD of the filter center. Because the filter center is always circular, the SDs in the x and y coordinates are equal and can be described with a single variable that is σc. σsx and σsy are the SDs of the filter surround for the x and y coordinates. Unlike the filter center, the filter surround can be elliptical and needs to be described with two different SDs for the x and y coordinates, σsx and σsy. We experimented with different filter structures to find the simplest one that could accurately replicate published ocular dominance patters. Filters without surround allowed us to simulate ocular dominance segregation but could not simulate the different shapes of ocular dominance bands found in nature. Filters with elongated centers generated similar ocular dominance patterns to filters with circular centers; therefore, we used the simplest center shape, which is a circle.
Modeling ocular dominance segregation with ASFs.
We simulate ocular dominance patterns in visual cortex by convolving the ASF with a 2D cortical patch of white and black pixels (C), each pixel representing an afferent from the contralateral eye (white pixel with a value of 1) or the ipsilateral eye (black pixel with a value of 0). In the convolution between the ASF and the cortical patch (Eq. 4), the multivariate Gaussian functions give a different weight to each afferent depending on its cortical distance from the filter center. The center-surround difference of the multivariate Gaussian functions simulates the attraction and repulsion interactions between afferents mediated by molecular gradients and/or neuronal activity. The convolution sum (CS) determines whether the afferent at the center of the filter is replaced by an afferent of a different type (r = 1) or not (r = 0), as shown in Equation 5. A replacement simulates the retraction of the axon growth cone from one afferent type and replacement by another afferent type. The central afferent remains unchanged when surrounded by afferents of the same type (i.e., positive CS when the central afferent is from the contralateral eye; negative CS when the central afferent is from the ipsilateral eye). The central afferent is replaced by an afferent of different type when surrounded by afferents of different type (e.g., negative CS when the central afferent is from the contralateral eye; positive CS when the central afferent is from the ipsilateral eye) as follows:
 |
 |
The convolution is performed across all cortical positions (x, y) and is repeated for 10 developmental steps (s). In the first step (s = 1), the cortical patch has randomly organized afferents from the contralateral and ipsilateral eyes. In the following developmental steps (s > 1), the cortical patch has afferents sorted at the previous developmental step (Eq. 5). After 10 developmental steps, the arrangement of the afferents becomes stable and does no longer change. We measure the amount of change by calculating a pattern of similarity (PS) between cortical patches from contiguous developmental steps (Eq. 6). PS equals 1 − MSE, where MSE is the mean squared error difference between cortical patches from contiguous developmental steps, C (x, y, s − 1) and C (x, y, s). Each patch has n pixels that simulate different x, y positions in cortical space. If the two contiguous patches are identical, MSE equals 0 and PS reaches its maximum value, which is 1.
 |
Generating an image database of diverse ocular dominance patterns.
We simulate different ocular dominance patterns by using ASFs that differ in just four parameters: center diameter, ratio between surround and center (surround/center ratio), ratio between longest and shortest surround axes (x-surround/y-surround ratio), and angle of the longest surround axis. The center diameter is defined as 2 σc in Equation 3. The surround/center ratio is defined as the ratio between the SDs of the shortest surround axis (minimum [σsx σsy]) and the center (σc). The x-surround/y-surround ratio is defined as the ratio between σsx and σsy. We calculate the angle of the longest surround axis as the angle of the ASF (ρ). These four parameters are the minimum number needed to reproduce the diversity of ocular dominance patterns found in nature and provide a reasonable compromise between accuracy and speed when searching for a specific ocular dominance pattern.
By using multiple combinations of these parameters, we generated 3000 different ocular dominance patterns with an image resolution of 31 × 31 pixels. We used six center diameters (2 σc: 6, 8, 10, 12, 14, 16), five surround/center ratios (minimum [σsx σsy]/σc: 1, 2, 3, 4, 5), 10 x-surround/y-surround ratios (σfsx/σfsy: 1, 2, 3, 4, 5, 6, 7, 8, 9, 10), and 35 angles (ρ: 0–175 in steps of 5 degrees). We first generated 300 different patterns by using all possible combinations of center diameter, surround/center ratio, and x-surround/y-surround ratio (6 × 5 × 10 = 300). We then repeated each of these 300 parameter combinations 10 times with different random noise seeds to generate 3000 different patterns (300 × 10 = 3000 ocular dominance patterns). We then rotated each pattern to match the angle of the cortical patch measured with Fourier analysis. Therefore, when including the 35 possible pattern angles, the number of possible patterns that we generate with the four filter parameters is 105,000 (3000 × 35).
To simulate a specific ocular dominance pattern measured in primary visual cortex, we first select an image of an ocular dominance map published in the scientific literature. We then convert the map to a binary scale of black and white pixels and divide it in multiple patches, each patch containing an average of three ocular dominance cycles (six stripes: three from the contralateral eye and three from the ipsilateral eye). We then resize each patch to 31 × 31 pixels to match the image resolution in our database. This resizing provides a resolution for each cortical patch of 4.78 pixels/mm for human, 10.31 pixels/mm for macaque, and 8.85 pixels/mm for cat (patch size: 6.48 mm for human, 3.01 mm for macaque, and 3.5 mm for cat). We then search in our database for the pattern that best matches the original published image. The search comparison is guided by measures of four different parameters, all from ipsilateral-eye stripes: number, average length, average width, and average angle.
Searching for the best pattern match in our image database.
We use a cost function to search for the best match of a published ocular dominance pattern in our image database. The cost function measures the error (E) between the original image and each image from our database (Eq. 7). The error is calculated as the square difference between the average width (W), length (L), and number (N) of ipsilateral stripes from the original (Wo, Lo, No) and model images (Wm, Lm, Nm). We chose stripes from the ipsilateral eye because they are more numerous than stripes from the contralateral eye (see Results).
The angle is not included in the cost function because patterns with different angles can be simply replicated by rotating the ASF after finding the best match for number, width, and length. We obtained 3000 different values of E, one for each image in the database. After finding the best image match for ipsilateral stripe width, length, and number (i.e., image with smallest E), we rotated the angle of the image with 5 degree precision to match the original and select the ASF that generated the best match. We repeated this search process for each cortical patch to generate a full set of ASFs for each ocular dominance map published in the scientific literature.
Identifying ASFs associated with cortical retinotopic sections.
We searched for the ASFs that best described specific retinotopic sections within an ocular dominance map. For this search, we first redrew the retinotopic maps from human (Horton and Hoyt, 1991), macaque (Van Essen et al., 1984), and cat (Tusa et al., 1978) published in the scientific literature. We then stretched and rotated the retinotopic maps to match the global shapes of the published ocular dominance maps. This process was relatively simple when using human or macaque brains because the general shapes of published ocular dominance and retinotopic maps are very similar in these species. The process was more difficult (and more prone to error) in the cat because the global shapes of published ocular dominance and retinotopic maps are quite different (Tusa et al., 1978; Kaschube et al., 2003). Therefore, to reduce the error, we restricted the cat map comparison to a central 30 × 30 degrees patch. After finishing the map alignment, we divided the ocular dominance map in retinotopic sections and measured the retinotopic gradient asymmetries in each section. We then searched in our image database for the best match of the ocular dominance pattern from each retinotopic section and selected the ASF that generated it.
Simulations of ocular dominance and ON-OFF afferent segregation in visual cortex.
Based on our experimental data in cats (Kremkow et al., 2016; Kremkow and Alonso, 2018), we propose a developmental model in which cortical retinotopy guides the segregation of thalamic afferents by eye input and contrast polarity (ON and OFF) along orthogonal cortical axes. In the model, thalamic afferents from contralateral and ipsilateral eyes segregate along the cortical axis with slowest retinotopic gradient to maximize the binocular retinotopic match between ocular dominance stripes. In turn, ON and OFF afferents segregate along the cortical axis with fastest retinotopic gradient to maximize the ON-OFF retinotopic mismatch between ON and OFF domains. The model allows us to simulate the map of ON-OFF cortical segregation if we know the map of ocular dominance segregation. We first take an ocular dominance map published in the scientific literature to obtain the full set of ASFs associated with ocular dominance segregation. Then, we rotate all filters by 90 degrees to obtain the ASFs for ON-OFF cortical segregation. Then, we use the ON-OFF ASFs to segregate ON and OFF thalamic afferents with an algorithm similar to that used for ocular dominance segregation.
To generate the ON-OFF cortical map, we first convolve the ASFs with a 2D cortical patch of white and black pixels (C), as shown in Equation 4, each pixel representing an ON afferent (white pixel with a value of 1) or OFF afferent (black pixel with a value of 0). As for ocular dominance segregation, the CS determines whether the afferent at the filter center is replaced by an afferent of a different type (r = 1) or not (r = 0). However, because the segregation for ON-OFF afferents is likely to occur later in time than the segregation for ocular dominance (Kremkow and Alonso, 2018), we assume that is also weaker. To simulate a weak ON-OFF afferent segregation, we add a randomization factor to the segregation algorithm described in Equation 5 (Eq. 8). An ON afferent at the center of the filter is replaced by an OFF afferent if the CS plus a random factor ranging from 0 to 1 (rnd) is >0.5. An OFF afferent is replaced by an ON afferent if the CS plus the random factor is <0.5. The CS is multiplied by a constant factor (α) to simulate cortices with different ON/OFF afferent balances. When ON and OFF afferents are balanced in number (50% OFF, 50% ON), α equals 1. When OFF afferents dominate over ON afferents (60% OFF, 40% ON), α equals 10, as follows.
 |
The strength of ON-OFF segregation was measured by generating ON-OFF maps in 101 consecutive developmental steps. We measured the segregation strength at each developmental step (Ss) as the MSE between the ON-OFF map at each step and developmental Step 100. We measured the minimum possible segregation (Smin) as the MSE (Eq. 6) between the ON-OFF maps at developmental Steps 0 and 100. The strength of ON-OFF segregation was defined as Ss-Smin and ranged from a value of 1 (strongest segregation) to 0 (no segregation).
Data analysis.
Statistical significance was assessed with Wilcoxon tests when comparing value averages and with linear correlation when comparing the relation between two variables. All average comparisons are described as average ± SD. Probability values are provided for all statistical comparisons, and probability values <0.0001 are described as p < 0.0001.
Results
Thalamic afferents segregate by eye input in the primary visual cortex of humans, macaques, and carnivores. The cortical patterns formed by this afferent segregation are very diverse across species and cortical regions for reasons that remain poorly understood. To investigate the origin of this pattern diversity and its possible functional implications, we measured the statistics of ocular dominance segregation with two new methods: an image-processing algorithm and a filter that simulates each local ocular dominance pattern.
Diversity of ocular dominance maps measured with image processing analysis
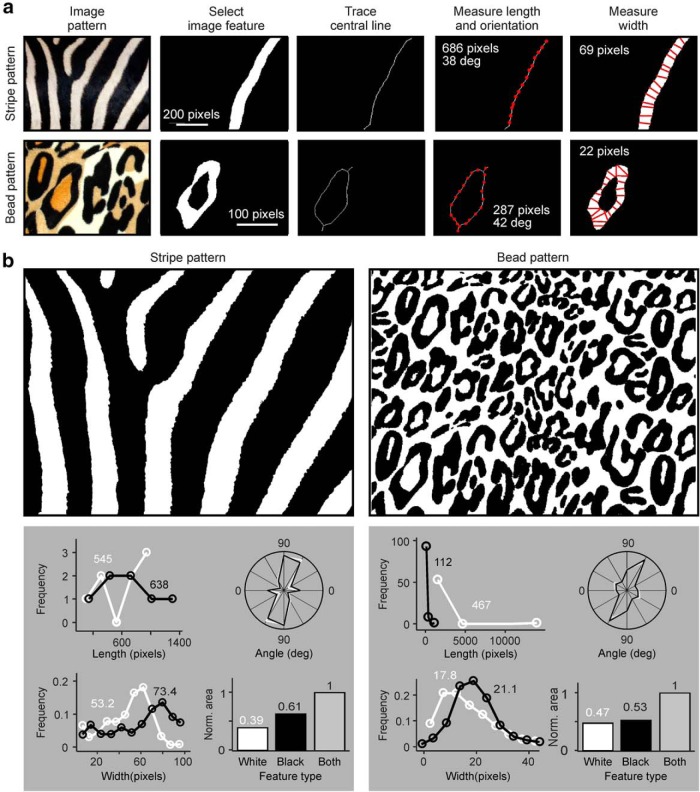
We used an image-processing algorithm to quantify the different ocular dominance patterns found in nature. The algorithm works with any image that can be converted to a binary pattern of black and white pixels (Fig. 1a). It starts by isolating a feature within the pattern: an area of pixels with the same contrast polarity (e.g., white pixels) surrounded by pixels of opposite polarity (e.g., black pixels). Then, it traces the central line of the feature to measure its length. Then, it traces multiple lines orthogonal to the central line to measure the width and angle of the feature at each pixel of the central line (Fig. 1a). Finally, the algorithm returns histogram distributions of length, angle, width, and total area of white and black features (Fig. 1b). The histograms show one measure of length per feature (e.g., 8 length measures for the white stripes of Fig. 1b) and one measure of angle or width per pixel (e.g., 4363 angle measures for the white stripes of Fig. 1b).
Figure 1.
Image-processing algorithm used to quantify ocular dominance patterns in visual cortex. a, Description of the image processing algorithm used to measure ocular dominance patterns. The algorithm is illustrated for zebra skin (first row) and leopard skin (second row). Both images are from public domain (Skin of a Grant's Zebra from Hans Hillewaert and Leopard Skin from Alex Borland). The algorithm includes the following stages, described from left to right: selection of single feature, tracing the central line of the feature with 1 pixel width, measuring the feature length (686 pixels long), angle of the central line (average across pixels: 38 degrees), and width of the central line (average width: 69 pixels). b, Binary versions of the images shown in a (top) and histograms illustrating distributions of length, angle, width (normalized by total number of pixels), and total area of white and black image features (bottom). The numbers on top of the histograms show average (length, width) and normalized area for white and black features.
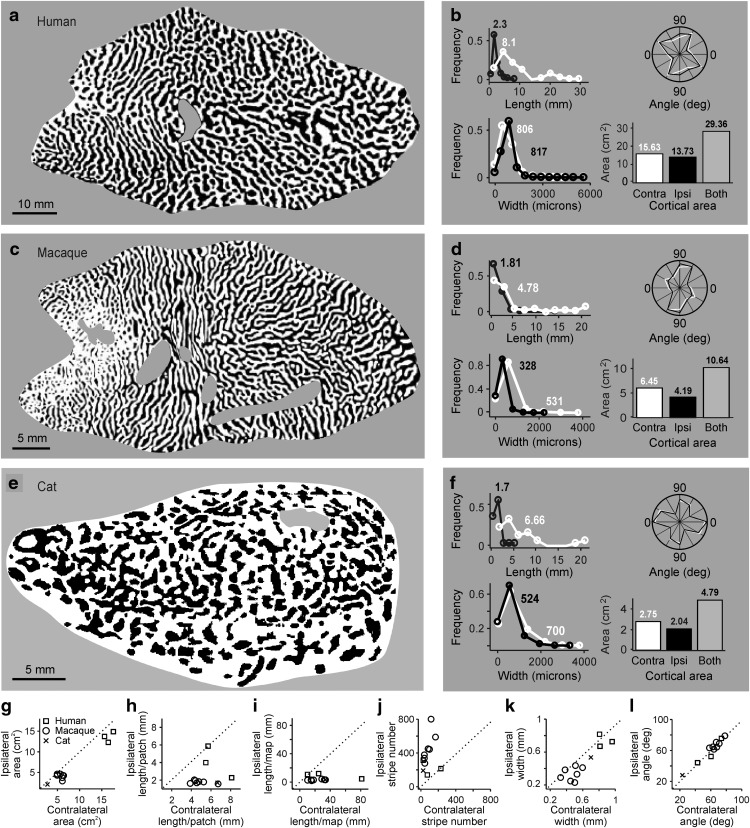
We started applying this algorithm to three ocular dominance maps from three different species published in the scientific literature: human (Adams et al., 2007), macaque (Adams et al., 2007), and cat (Kaschube et al., 2003). Before taking any measurements, we removed all map regions that had weak or missing ocular dominance patterns, such as the monocular crescent, optic disk, and regions not properly reconstructed (Fig. 2a,c,e). We then divided each ocular dominance map into multiple square patches, each patch covering three contralateral-ipsilateral pairs of ocular dominance stripes. To facilitate comparisons across species, we aligned the longest axis of the map with the horizontal axis of the image (Fig. 2a,c,e).
Figure 2.
Quantification of ocular dominance patterns in human, macaque, and cat cortex. a, Human ocular dominance map shown in a binary image. Reproduced with permission from Adams et al. (2007). Unless specified differently, all ocular dominance maps and plots within the paper show the contralateral eye in white and ipsilateral eye in black. b, Histograms illustrating distributions of length, angle, width, and total area of white and black image features. Contralateral-eye stripes (white) tend to be longer than ipsilateral-eye stripes (black). c, Same as in a, but for a male macaque. Reproduced with permission from Adams et al. (2007). d, Same as in b, but for a male macaque. e, Same as in a, but for a cat. Reproduced with permission from Kaschube et al. (2003). f, Same as in b, but for a cat. g–l, Comparison of ocular dominance stripes from contralateral- (x axis) and ipsilateral-eye stripes (y axis), shown for human (n = 3), macaque (n = 7; 4 males and 3 females), and cat cortical hemispheres (n = 1).
Our algorithm demonstrates that the contralateral eye occupies a larger cortical territory than the ipsilateral eye in the ocular dominance maps of the three species. We demonstrate this contralateral dominance with measurements of overall cortical area (Fig. 2a–g), as shown in the past (Shatz and Stryker, 1978; Anderson et al., 1988; Adams et al., 2007). In addition, we demonstrate an even stronger contralateral bias with measurements of stripe length and number (Fig. 2a–l). The stripes from the contralateral eye connected more frequently with each other than the stripes from the ipsilateral eye. Indeed, many cortical maps had nearly all contralateral-eye stripes connected forming a labyrinth that created multiple isolated ipsilateral-eye stripes (Movie 1). The average stripe length in cortical patches with three contralateral-ipsilateral stripe cycles was 1.6–3.9 times greater for the contralateral eye than ipsilateral eye (Fig. 2h; human: 6.4 ± 5.96 vs 4.13 ± 3.73 mm, p < 0.0001, n = 3 ocular dominance maps; macaque: 4.88 ± 4.95 vs 1.75 ± 1.14 mm, p < 0.0001, n = 7 ocular dominance maps; cat: 6.73 ± 4.85 vs 1.74 ± 1.01 mm, p < 0.0001, n = 1 ocular dominance map, Wilcoxon tests). The average stripe length in the entire cortical map was also 2.3–10.5 times greater for the contralateral than the ipsilateral eye (human: 19.03 ± 143.77 vs 8.14 ± 54.17 mm, p = 0.0085, n = 3 ocular dominance maps; macaque: 18.02 ± 112.44 vs 2.55 ± 9.73 mm, p < 0.0001, n = 7 ocular dominance maps; cat: 33.5 ± 168.5 vs 3.2 ± 5.78 mm, p < 0.0001, n = 1 ocular dominance map, Wilcoxon tests). Because the contralateral stripes were longer and more connected with each other than the ipsilateral stripes, they were also 2–7 times fewer in number (Fig. 2j). In addition to the pronounced contralateral bias for stripe length, the average stripe width was also slightly greater for the contralateral than ipsilateral eyes in most cortical maps (Fig. 2k; but see exception in Fig. 2b; 0.806 ± 0.449 vs 0.817 ± 0.353 mm, p < 0.0001, Wilcoxon test). Finally, many ocular dominance stripes showed a strong tendency to be orthogonal to the longest axis of area V1 (Fig. 2a–f,l).
Analysis of single stripes from contralateral (white) and ipsilateral eyes (black) in human cortex. The red outline shows the selected stripe. The top label shows the stripe number and length. The bottom panel shows histograms with the distribution of stripe width (left) and angle (right) measured at each image pixel and the mean stripe width and angle (top label).
Correlation between stripe width and eccentricity
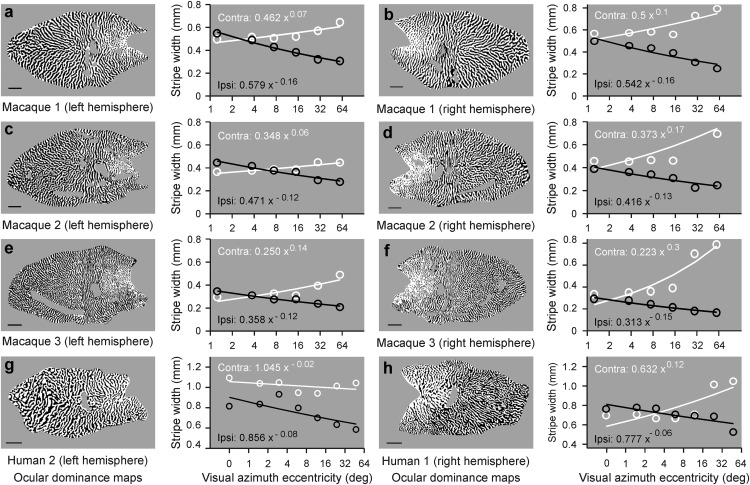
We hypothesize that the orthogonal relationship between the longest axes of the ocular dominance stripes and the longest axis of area V1 is a consequence of asymmetries in cortical retinotopy. Because the V1 area of humans and macaques is more elongated along its horizontal than vertical dimension, the two eye copies of each retinotopic position should be better accommodated along the horizontal cortical dimension. Moreover, because cortical retinotopy changes faster as visual eccentricity increases, the amount of cortical space needed to accommodate an ipsilateral-contralateral stripe-cycle should decrease with eccentricity, affecting stripe width. Consistent with this prediction, we found that the stripes from the ipsilateral eye become increasingly thinner as azimuth eccentricity increases, even within central vision (Fig. 3). This eccentricity thinning could be demonstrated in both macaques (Fig. 3a–f) and humans (Fig. 3g–h), and was very robust, even within the central 16 degrees (Fig. 3a–h). Contrary to the ipsilateral-eye stripes, the width of the contralateral-eye stripes increased with azimuth eccentricity (Fig. 3a–f,h) or did not change (Fig. 3g). The relation between eccentricity and ipsilateral-eye stripe width could be accurately fit with a power function, and the power values across different hemispheres were tightly constrained within 15% of the mean range (between −0.12 and −0.16 in macaque maps and −0.06 and −0.08 in human maps). The increase with eccentricity of contralateral-ipsilateral stripe width differences matches the increase of nasal-temporal cell-density differences within the retina (Curcio and Allen, 1990). The nasal and temporal retina feed the contralateral- and ipsilateral-eye stripes, respectively. Therefore, the relation between nasal-temporal retinal differences and contralateral-ipsilateral cortical differences supports our hypothesis that cortical retinotopy shapes ocular dominance segregation.
Figure 3.
Correlation between cortical stripe width and eccentricity. a, Cortical map of ocular dominance from a male macaque (left) and scatter plot showing a reduction in the width of ipsilateral-eye stripes (ipsi, in black) with eccentricity. The contralateral-eye stripes (contra, in white) tend to increase with eccentricity but the width change is not as pronounced as for the ipsilateral-eye stripes. Lines indicate fits to the power functions (equations shown in white for contralateral eye and black for ipsilateral eye). Scale bars: human, 10 mm; macaque, 5 mm. Ocular dominance map reproduced with permission from Horton and Hocking (1996). b–f, Same as in a, but for other male (b–d) and female (e, f) macaques. Reproduced with permission from Horton and Hocking (1996). g, h, Same for other human ocular dominance maps. Reproduced with permission from Adams et al. (2007).
Similar ocular dominance patterns between left and right hemispheres
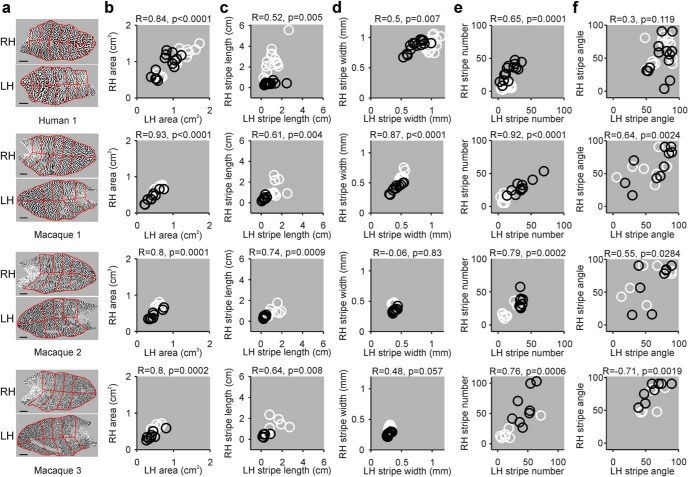
If V1 retinotopy shapes ocular dominance segregation, the overall pattern of ocular dominance should be similar between left and right hemispheres. Because the cell density of the two nasal retinas is similar (Curcio and Allen, 1990), the organization of the contralateral-eye stripes from the two hemispheres should also be similar (the same argument applies to the two temporal retinas and ipsilateral-eye stripes). At the same time, because the number of retinal ganglion cells can vary by more than twofold across individuals (Curcio and Allen, 1990), the pattern of ocular dominance should also show great individual variability. To test this hypothesis, we compared the ocular dominance patterns of the two hemispheres from 3 macaques and 1 human (Fig. 4a) published in the scientific literature (Horton and Hocking, 1996; Adams et al., 2007). To quantify the comparison, we divided each hemisphere in multiple eccentricity sections, and calculated the different parameters for each section (Fig. 4a,b). Consistent with our prediction, nearly all measures of ocular dominance patterns were correlated between hemispheres, including the stripe length and width (Fig. 4c,d), stripe number (Fig. 4e), and stripe angle (Fig. 4f). All correlations were highly significant, except the correlations for stripe width in Macaques 2 and 3 (Fig. 4d), which were constrained to a very narrow range of values. The correlations for stripe angle were also weaker but significant for all 3 macaques.
Figure 4.
Correlation between ocular dominance patterns from left and right V1 hemispheres. a, Maps of ocular dominance from the right hemisphere (RH) and left hemisphere (LH) obtained from the scientific literature for a human (Human 1; reproduced with permission from Adams et al., 2007) and 3 macaques (male macaques: 1–2, female macaques: 3, reproduced with permission from Horton and Hocking, 1996). Red lines indicate the retinotopic sectors from human and macaque retinotopic maps used to calculate the different ocular dominance parameters. Scale bars: human, 10 mm; macaque, 5 mm. b, Correlations between LH and RH area for human 1 (top) and macaques 1–3 (bottom). Each circle represents a measurement from a different retinotopic sector for the contralateral eye (white) and ipsilateral eye (black). c–f, Same as in b, but for stripe length (c), stripe width (d), stripe number (e), and stripe angle (f).
Similar ocular dominance patterns in upper and lower V1 halves
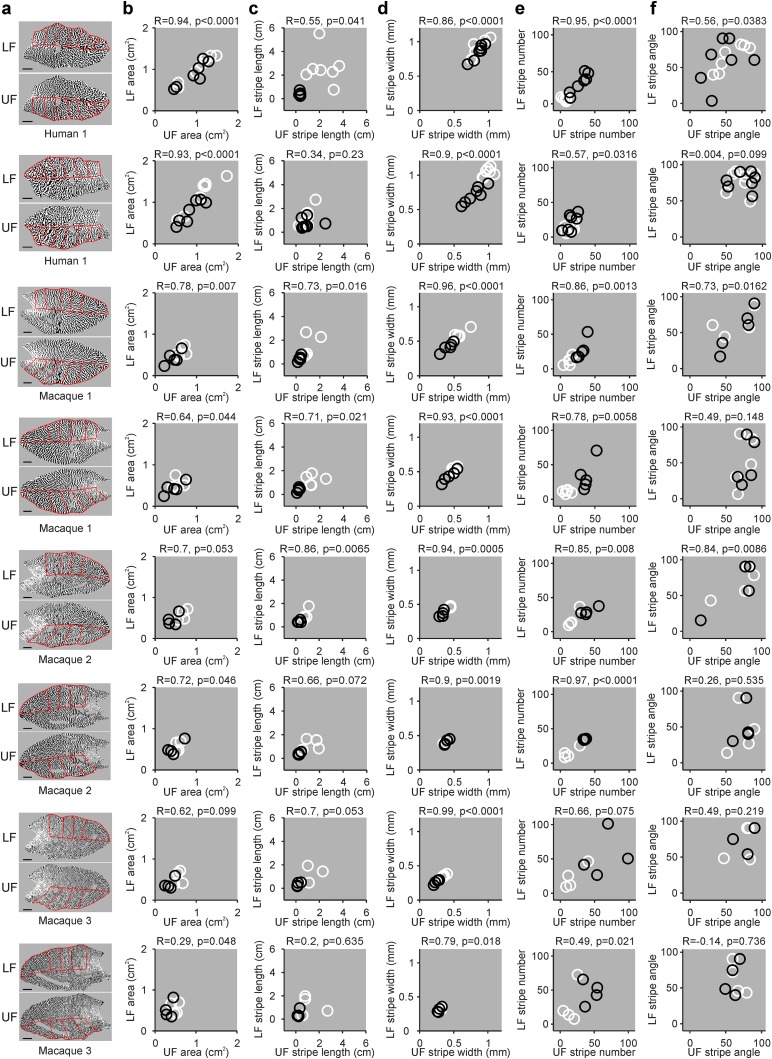
If cortical retinotopy shapes ocular dominance segregation, the overall pattern of ocular dominance should be also similar between the lower and upper halves of area V1 within each hemisphere. Similar ocular dominance patterns are expected because the two V1 halves receive input from the same two eyes, and the two eyes from the same individual animal have similar density of retinal ganglion cells (Curcio and Allen, 1990). To test this hypothesis, we used the same approach described above. We divided each hemisphere in multiple eccentricity sections and compared the different ocular dominance patterns from the lower and upper V1 halves (upper and lower visual field fields) across cortical sections with similar azimuth eccentricity (Fig. 5). As for left and right hemispheres, we found strong correlations between the ocular dominance patterns of upper and lower V1 halves. Unlike for left and right hemispheres, most correlations for stripe length did not reach significance (Fig. 5c). This lack of significance for stripe length is likely to reflect a sample size limitation (4–5 data points for each eye in Fig. 5 vs 8–10 in Fig. 4) since most correlations for stripe number were strong (Fig. 5e).
Figure 5.
Correlation between ocular dominance patterns between the two V1 halves representing lower and upper visual fields. a, Maps of ocular dominance from the V1 halves representing the lower visual field (LF) and upper visual fields (UF), obtained from the same brains shown in Figure 4. Scale bars: human, 10 mm; macaque, 5 mm. b, Correlations between UF and LF areas for Human 1 and Macaques 1–3. Each circle represents a measurement from a different retinotopic sector for the contralateral eye (white) and ipsilateral eye (black). c–f, Same as in b, but for stripe length (c), stripe width (d), stripe number (e), and stripe angle (f).
Diversity of ocular dominance maps measured with ASFs
To study the diversity of ocular dominance patterns in further detail, we simulated the pattern of each local cortical patch published in the scientific literature with a difference of multivariate Gaussian functions. We call this function afferent sorting filter or ASF because it simulates the sorting of thalamic afferents from contralateral and ipsilateral eyes during cortical development. The filter size simulates the cortical region receiving afferents with the same retinotopy (i.e., overlapping receptive fields), and the surround elongation simulates local retinotopic cortical asymmetries (e.g., slower change in retinotopy along the longer than shorter surround axis of the filter). The size of the cortical region receiving afferents with overlapping receptive fields is approximately constant across different eccentricities, as demonstrated by measurements of cortical regions representing the same point in visual space (Hubel and Wiesel, 1974b; Albus, 1975; Harvey and Dumoulin, 2011). Therefore, the filter size should remain constant across the entire cortex and independent of changes in receptive field size and spatial frequency preference with visual eccentricity. The ASF has a center-surround structure (Fig. 6a), which can be circular (Fig. 6b) or elliptical (Fig. 6c). The center diameter simulates the spread of attraction between afferents of the same type and determines the width of the ocular dominance bands. The surround simulates the spread of repulsion between afferents of different type and its elongation determines the band shape (e.g., stripes or beads).
Figure 6.
The ASF. a, ASFs are modeled as a difference of two multivariate Gaussian functions. The filter has a positive center (orange) and a negative surround (purple). b, c, Top, View of circular (b) and elliptical (c) filters superimposed on cortical space. The filter sorts contralateral (white pixels) and ipsilateral afferents (black pixels) over the mediolateral (ML) and anteroposterior (AP) axes of cortical space.
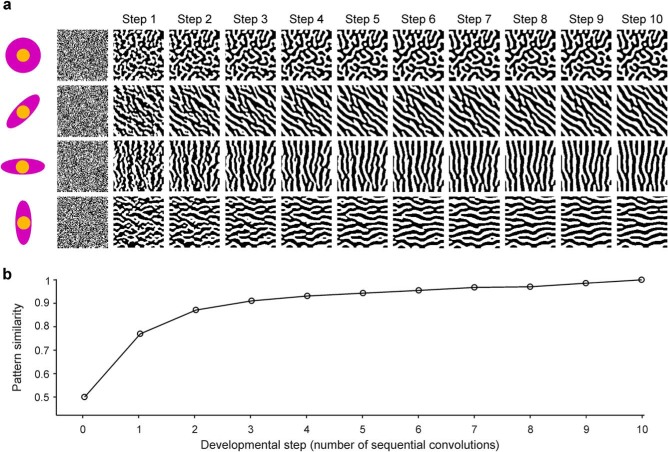
We simulate a patch of afferents in the cortical plate (i.e., cortex at earliest developmental stage) as a binary-noise image. White pixels represent afferents from the contralateral eye, and black pixels represent afferents from the ipsilateral eye (Fig. 6b,c). The sorting process changes the polarity of the pixel at the center of the filter when the polarity of the surrounding afferents is different (e.g., change from white to black when the average convolution is negative). This process aims to simulate the retraction/expansion of axonal growth cones from contralateral- and ipsilateral-eye afferents in the cortical plate (Rakic, 1977; Shatz and Stryker, 1978; Huberman et al., 2008). The sorting of thalamic afferents is simulated through sequential convolutions between the noise image representing the cortical patch and the ASF (Fig. 7a). In the first convolution (developmental Step 1), we convolve the filter with an image of random noise (i.e., randomly arranged afferents from contralateral and ipsilateral eyes). In the second convolution (developmental Step 2), we convolve again the filter with the image resulting from the first convolution, and we continue performing these sequential convolutions for 10 developmental steps. Ocular dominance patterns emerge at the first convolution between the filter and afferent image and become increasingly similar at subsequent convolutions (Fig. 7b). Because the patterns become nearly identical at developmental Step 10 (Fig. 7b; pattern similarity ∼ 1), we used 10 convolutions for all simulations (for more details, see Materials and Methods). As illustrated in Figure 7, the shape of the filter determines the shape of the ocular dominance pattern. Circular filters generate ocular dominance patterns with random orientations (Fig. 7a, top row), whereas elliptical filters generate ocular dominance stripes orthogonal to the filter orientation (Fig. 7a, bottom three rows).
Figure 7.
ASFs generate realistic ocular dominance patterns. a, The ASF is convolved with randomly organized afferents (Step 1), the result is convolved again (Step 2), and this process repeated for 10 sequential convolutions (Steps 1–10). The value of the convolution determines whether the polarity of the afferent changes or remains the same in each developmental step. Circular filters generate ocular dominance stripes with random orientations, and elliptical filters generate ocular dominance stripes oriented orthogonal to the longest axis of the filter. b, The ocular dominance pattern becomes increasingly similar as the number of sequential convolutions increases.
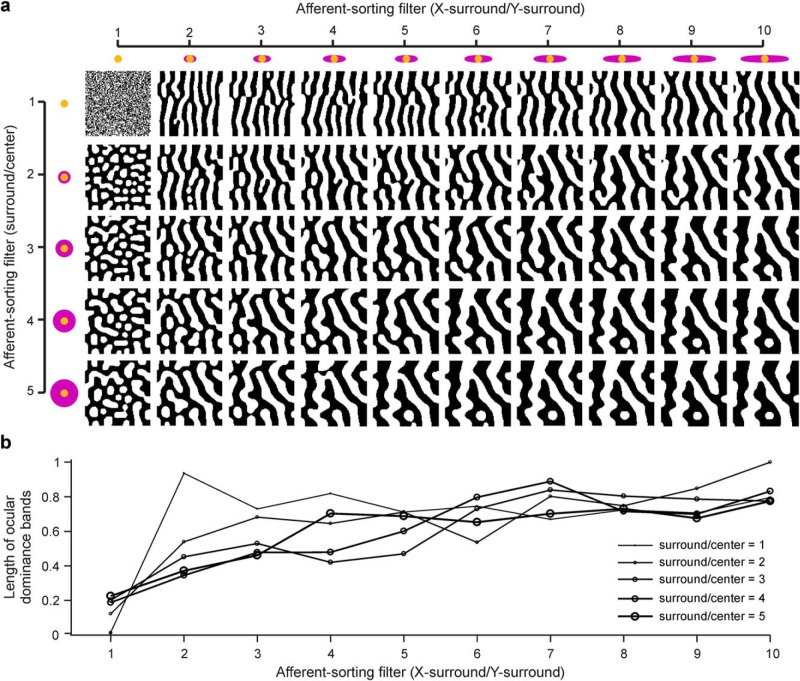
A large diversity of ocular dominance patterns can be generated by manipulating just four filter parameters: the center diameter, the ratio between surround and center diameter (surround/center ratio), the ratio between the longest and shortest axes of the surround (x-surround/y-surround ratio), and the angle of the filter (Fig. 8a). Circular surrounds generate bead patterns (Fig. 8a; x-surround/y-surround = 1) and elliptical surrounds generate stripe patterns (Fig. 8a; x-surround/y-surround ≥ 2). As we increase the center diameter, the surround/center ratio, or the x-surround/y-surround ratios, stripes and beads become wider, start intersecting with each other, and increase their total length (Fig. 8b). By systematically manipulating these four filter parameters, we generated a database of multiple ocular dominance patterns resembling those found in nature. We then used this database to identify the filters associated with different local patterns of ocular dominance segregation in ocular dominance maps published in the scientific literature.
Figure 8.
Different filter parameters generate different ocular dominance patterns. a, Ocular dominance patterns generated by systematically changing two parameters of the ASF: the X-surround/Y-surround ratio and the surround/center ratio. ASFs with a X-surround/Y-surround ratio of 1 generate beaded patterns that resemble the ocular dominance patterns of cats. ASFs with surround/center ratios >1 generate ocular dominance stripes resembling ocular dominance patterns of macaques and humans. Increasing the surround/center ratio or the X-surround/Y-surround ratio makes the ocular dominance stripes and beads wider and longer (i.e., more frequently connected with each other). b, Changes in the length of ocular dominance stripes as a function of changes in X-surround/Y-surround and surround/center ratios.
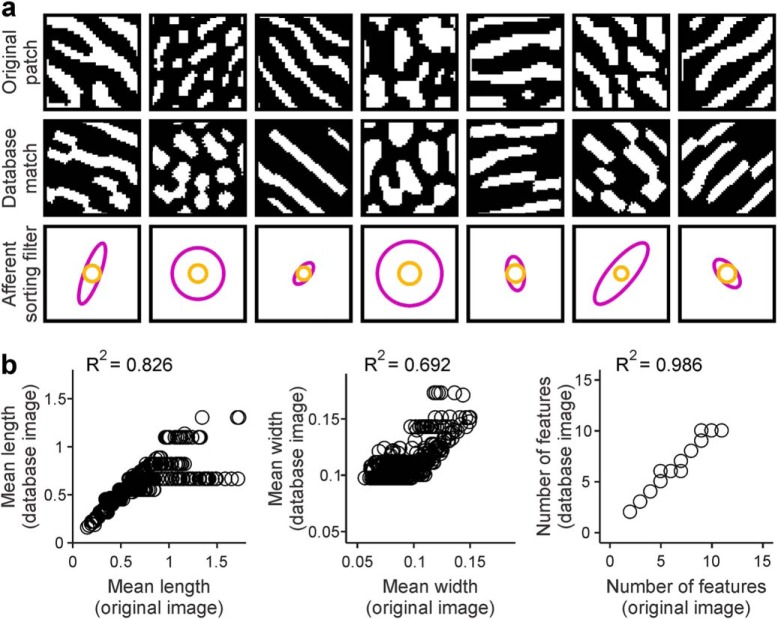
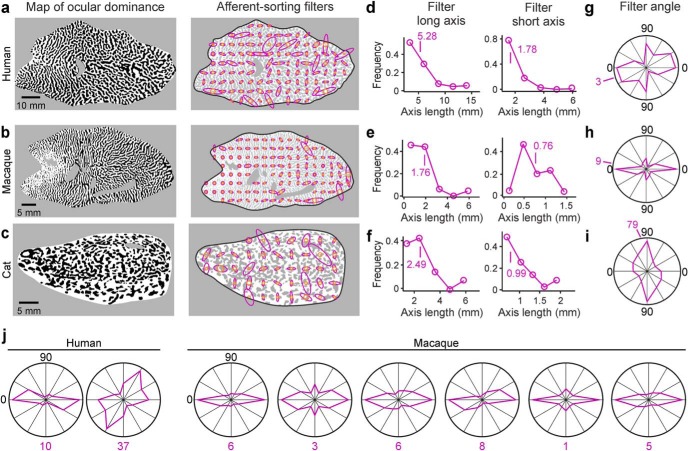
We divided each published ocular dominance map in multiple patches, each patch containing three cycles of contralateral and ipsilateral stripes. We then searched our image database for the best match for each ocular dominance patch (i.e., similar number of stripes, average length, width, and angle) and selected the ASF that generated the best match. The selected filters generated patterns very similar to the originals, as verified by visual inspection (Fig. 9a) and parameter correlations (Fig. 9b; n = 6 ocular dominance maps). Elongated filters reproduced stripe patterns, circular filters reproduced beaded patterns, filters with large center diameters reproduced patterns with wide features, and those with small diameters reproduced patterns with thin features (Fig. 9a). At the end of the search, we obtained a set of local filters (Fig. 10a–c) with diverse sizes, elongation ratios, and angles for each ocular dominance map. The average elongation ratio of the filters was constrained between 2 and 3 in the three species (Fig. 10d–f; long/short average filter axis: 3 in human, 2.3 in macaque, and 2.5 in cat). The longest axes of the filters also showed a strong tendency to be parallel to the longest axis of area V1 in humans and macaques but not in cats (Fig. 10g–j).
Figure 9.
Reproducing the ocular dominance pattern of each local cortical patch published in the scientific literature with ASFs. a, Ocular dominance patterns of cortical patches published in the scientific literature (top) and selected best matches from a database (middle) of patterns generated with ASFs (bottom). b, Ocular dominance comparison between mean parameters of the original cortical patches (x axis) and best matches obtained from our database (y axis), shown for mean length (left), mean width (middle), and number of features (right).
Figure 10.
ASF set associated with each ocular dominance map. a, Map of ocular dominance (left, same as Fig. 2a) and the associated set of ASFs (right) obtained from human cortex. b, Same as in a, but for male macaque (same ocular dominance map as Fig. 2c). c, Same as in a, but for cat (same ocular dominance map as Fig. 2e). d–f, Distribution of ASF lengths obtained from human (d), macaque (e), and cat (f) ocular dominance maps, shown separately for the longest (left) and shortest (right) axes of the filter. g–i, Distribution of filter angles and mean (purple number) obtained from ocular dominance maps from human (g), macaque (h), and cat (i). j, Distribution of filter angles obtained from other ocular dominance maps from human (left) and macaque (right). Most filter angles tend to be parallel to the longest axes of area V1 in macaques.
Ocular dominance bands segregate along the cortical axis with the slowest local retinotopy gradient
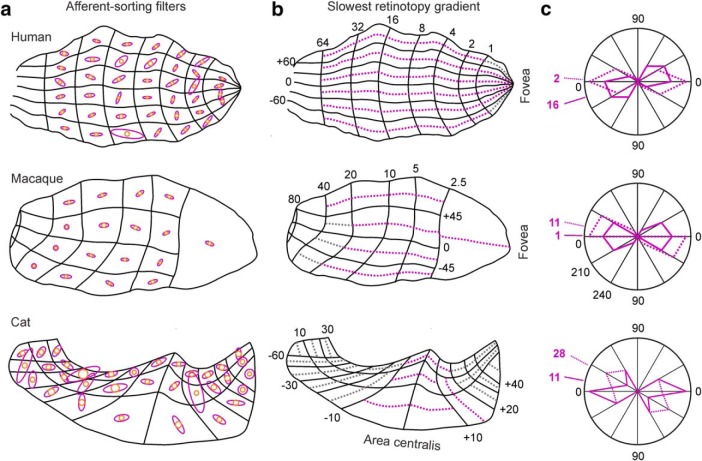
The cortical representation of visual space is much more distorted in humans and macaques than cats. For example, a patch of primary visual cortex representing the 10 × 10 central degrees is an order of magnitude more elongated in humans and macaques. We hypothesize that the more distorted cortical representation of visual space makes ocular dominance bands to segregate along the longest axis of area V1. The longest axis helps to maximize the retinotopic match between adjacent stripes from contralateral and ipsilateral eyes. To test this hypothesis, we divided each ocular dominance map into multiple retinotopy patches drawn from retinotopic maps published in the scientific literature (Tusa et al., 1978; Van Essen et al., 1984; Horton and Hoyt, 1991). We then searched in our database for the filters that best replicated the ocular dominance patterns associated with each retinotopic patch. To reduce the measurement errors as much as possible, we restricted our analysis to large retinotopic patches, which included most of the cortex in humans and macaques and a central patch of 30 × 30 degrees in cats (Fig. 11a,b).
Figure 11.
Ocular dominance bands segregate along the cortical axis with slowest local retinotopy gradient. a, Set of ASFs obtained from the same ocular dominance maps illustrated in Figures 2 and 10, but for larger cortical patches. Each ASF was obtained from a patch of an ocular dominance map that matched the size and position of a cortical retinotopic sector. Retinotopic sectors were estimated from published cortical retinotopic maps from human (Horton and Hoyt, 1991), macaque (Van Essen et al., 1984), and cat (Tusa et al., 1978). b, Axis of slowest retinotopy gradient (dotted purple line) shown for each retinotopic sector. Gray lines indicate axes of slowest retinotopic gradient in sectors that could not be properly measured. Because the retinotopic sectors in cat are small and the alignment with the ocular dominance map is prone to large error, only central large sectors are measured. c, Comparison of distributions for axis of slowest retinotopy gradient (dotted purple line) and longest axis of ASFs (solid purple line).
Consistent with our hypothesis, the angle of the ASF associated with each ocular dominance patch (Fig. 11a, purple ellipses) tended to be parallel to the axis of slowest retinotopy gradient within the patch (Fig. 11b, dotted purple lines). The angle difference between the filter and gradient axes was constrained within <20 degrees in example hemispheres from the three species (Fig. 11c; number of retinotopic sectors: 14 for human, 10 for macaque, and 17 for cat). The median angle difference was constrained to <25 degrees across all macaque and human hemispheres that we measured (macaques: 12.93 ± 14.06, n = 116 retinotopic sectors from 7 macaque hemispheres; humans: 22.7 ± 22.61, n = 123 retinotopic sectors from 3 human hemispheres; p < 0.0001 that the angle difference is due to chance, Wilcoxon tests). The filter angle is measured with Fourier analysis and is independent of the other filter parameters. Therefore, the results from Figure 11 would be identical if the angle of each retinotopic patch was calculated directly with Fourier analysis without using ASFs.
The tight relation between ocular dominance segregation and retinotopy that we demonstrate is particularly remarkable given the potential large sources of measurement error. The measurements require aligning published retinotopic and ocular dominance maps that have different shapes, are not from the same individual animal, and are measured with different methods: postmortem histology (Kaschube et al., 2003; Adams et al., 2007), electrophysiology (Tusa et al., 1978; Van Essen et al., 1984), or MRI (Horton and Hoyt, 1991). The large variability in V1 shape and size across individuals of the same species also introduces measurement errors (Tusa et al., 1978; Van Essen et al., 1984). The errors should be even larger in cats because the cortical distortions of visual space are smaller and the published retinotopic and ocular dominance maps have very different shapes (compare Fig. 10a–c with Fig. 11b). Despite these measurement errors, the relationship between ocular dominance segregation and local cortical retinotopy was very robust. Therefore, we conclude that ocular dominance segregation is closely associated with cortical retinotopy and that this association is present in the entire cortical map of different species, including humans.
Simulations of ocular dominance segregation in visual cortex
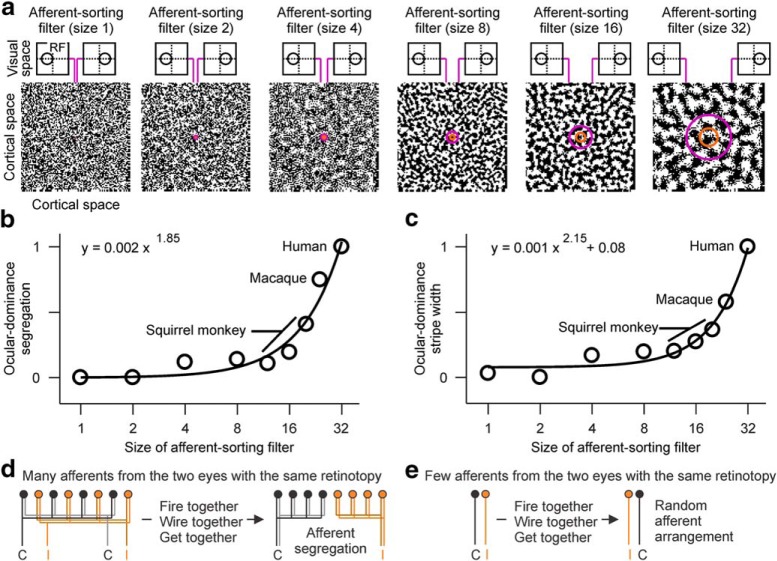
Our ASFs can be used to simulate differences in ocular dominance segregation across species. The cortical area covered by the ASF represents the cortical region receiving input from thalamic afferents with overlapping receptive fields (i.e., cortical region representing the same binocular point in visual space). Therefore, we can simulate an evolutionary increase in cortical area per binocular visual point simply by increasing the size of the ASF (Fig. 12a). For simplicity, we perform these simulations with a circular filter that generates randomly oriented ocular dominance bands and has a center/surround ratio of 2.5, which is the average ratio obtained with our measurements (Fig. 10). We apply ASFs of different sizes to images of binary white noise representing afferents in the cortical plate. We then assign a value of 1 to the smallest filter, which represents a species with a very small cortical area per binocular visual point (e.g., mouse cortex), and measure relative changes in ocular dominance segregation with filter size.
Figure 12.
Simulations of ocular dominance segregation in visual cortex. a, Simulation of cortical patches processed with different ASFs, from the smallest filter on the left (size 1) to the largest on the right (size 32). The size of the filter represents the cortical region receiving afferents with overlapping receptive fields. Afferents at the borders of the filter have nonoverlapping receptive fields (RF), as illustrated at the top of each figure panel. b, Strength of ocular dominance segregation (measured as maximum power in Fourier space) as a function of ASF size. The segregation strength increases with filter size following a power function with an exponent of 1.85. Top, Equation. c, Same as in b, but for stripe width. The model assumes a normalized stripe width of 1 for human visual cortex, which is used as reference to estimate the relative values for macaques and squirrel monkeys in c and then b. d, The model assumes that animals showing ocular dominance segregation have many afferents from the contralateral (C) and ipsilateral (I) eyes with overlapping receptive fields. Afferents with the same retinotopy from the same eye tend to fire together, connect to common targets and become neighbors in cortex, which reduces the axon needed for their connections. e, The model assumes that animals lacking ocular dominance segregation have very few afferents from the two eyes with overlapping receptive fields. Because the number of afferents from the two eyes with the same retinotopy is very limited, they remain randomly distributed in cortex.
This simple simulation demonstrates that increasing the cortical area per binocular visual point (i.e., size of ASF) strengthens ocular dominance segregation through a power law function. With the filter parameters that we used, doubling the size of the filter increases the strength of ocular dominance segregation by 3.6 times (Fig. 12b) and the stripe width by 2–4 times depending on filter size (Fig. 12c). These simulations explain the weaker ocular dominance segregation in New World monkeys and their thin (0.4–0.2 mm) or absent ocular dominance stripes (Adams and Horton, 2003; Takahata et al., 2014). The simulations also reproduce the strong ocular dominance segregation of cortices that represent each binocular visual point with a large cortical area, such as humans and macaques (Fig. 12a–c). In this model, the large cortical region per binocular visual point allows accommodating many afferents from the two eyes with the same retinotopy. Within this cortical region, afferents from each eye fire together more often and cooperate to connect neurons that are also close together. Consequently, the afferent segregation by eye input helps reduce the total amount of axon needed to make their connections (Fig. 12d). In contrast, ocular dominance segregation is weak and random in the visual cortex of rodents and lagomorphs because they have a small cortical region per binocular visual point and a limited number of afferents from the two eyes sharing the same retinotopy (Fig. 12e). The cortices of rodents and lagomorphs also have to represent large panoramic visual fields that are mostly monocular, leaving limited cortical resources to represent binocular visual points. For example, although ferrets and rabbits have cortices with very similar surface area (∼80 mm2), rabbits have lateral eyes, sample a much larger visual field and, unlike ferrets, do not have ocular dominance segregation in cortex (Mazade and Alonso, 2017).
Simulations of ON-OFF afferent segregation in visual cortex
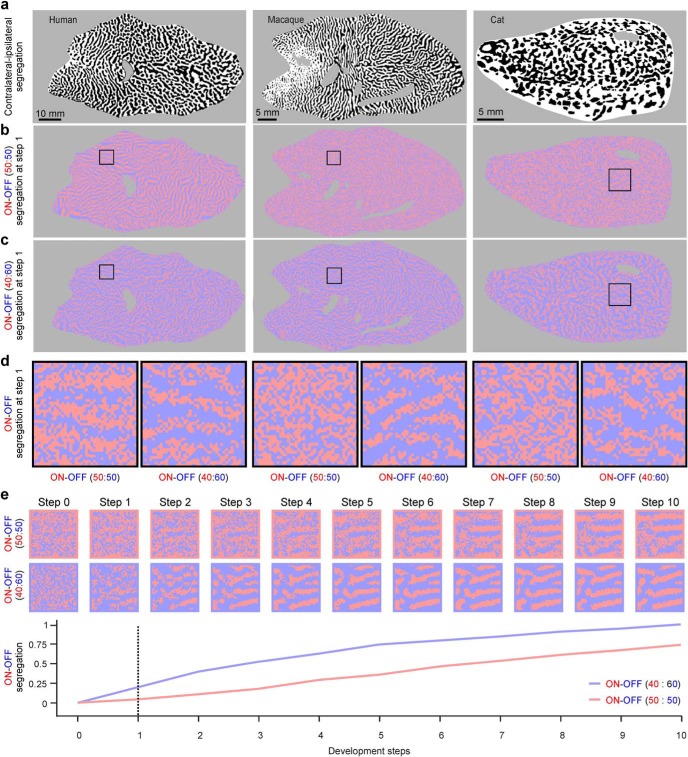
Thalamic afferents segregate in visual cortex not only by eye input (contralateral or ipsilateral) but also by contrast polarity (ON or OFF). This ON-OFF segregation is thought to be important in the development of cortical maps (Miller, 1994; Paik and Ringach, 2011; Jang and Paik, 2017), has been demonstrated in cats, ferrets, minks, and tree shrews (McConnell and LeVay, 1984; Norton et al., 1985; Zahs and Stryker, 1988; Jin et al., 2008; Kremkow et al., 2016), and is likely to be also present in primates (Kremkow et al., 2016; Kremkow and Alonso, 2018). In cat visual cortex, ON-OFF polarity and ocular dominance segregate along orthogonal cortical axes (Kremkow et al., 2016). Because of this orthogonal relationship, we can simulate an ON-OFF map with our ASFs if we know the ocular dominance map and make two main assumptions. First, the orthogonal relationship between ocular dominance and ON-OFF polarity is similar in cats, macaques, and humans. Second, the afferent segregation by ON-OFF polarity is weaker than the afferent segregation by ocular dominance because ON-OFF afferents segregate later (Speer et al., 2010; Kremkow and Alonso, 2018). To simulate the ON-OFF cortical map, we first took an ocular dominance map published in the scientific literature (Fig. 13a) and generated the set of ASFs for ocular dominance (Fig. 10a–c). We then rotated all ASFs by 90 degrees to obtain the set of ASFs for ON-OFF dominance (Fig. 13b–d). The algorithm for ON-OFF segregation is similar to the algorithm used for ocular dominance segregation but has a randomization factor that makes the ON-OFF afferent segregation weaker (see Materials and Methods). In these simulations, the afferent segregation for ocular dominance is already very pronounced at the first convolution (developmental Step 1) as previously shown in Figure 7. In contrast, the ON-OFF afferent segregation is nearly absent at developmental Step 1, particularly when there is an equal number of ON and OFF afferents (Fig. 13b,d,e). When OFF afferents dominate (e.g., 60% OFF and 40% ON), the ON-OFF afferent segregation is stronger (Fig. 13c–e).
Figure 13.
Simulations of ON-OFF segregation in visual cortex. a, V1 maps of ocular dominance used to obtain the ASFs for ON-OFF segregation (same maps of Fig. 2). b, Simulation of ON-OFF segregation for the V1 ocular dominance maps shown in a. c, Same as in b, but using 40% of ON afferents and 60% of OFF afferents instead of 50% of each. d, Detail of cortical square patch shown in b and c to illustrate better the more pronounced ON-OFF segregation when the cortex is OFF dominated (40% of ON and 60% of OFF afferents vs 50% of each). e, Strength of ON-OFF segregation for consecutive developmental steps showing the stronger segregation for the OFF dominated cortex. Top, Images represent example square patches from the macaque maps used to obtain the values in the plot below.
The eye/polarity grid: a developmental model of visual cortical topography
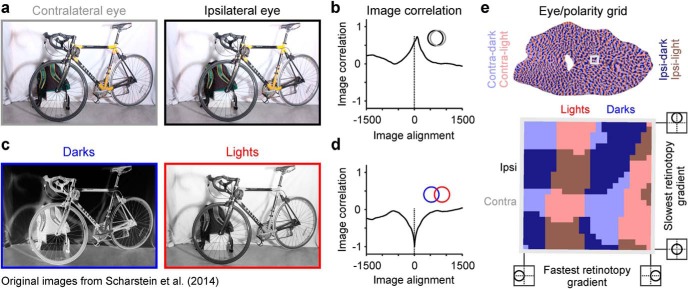
Together, our results support a developmental model of visual cortical topography that sorts thalamic afferents by eye input and contrast polarity along orthogonal cortical axis with different retinotopic gradients. The model assumes that afferents showing the strongest correlated firing are more likely to make connection with the same cortical targets and become closer together in the cortex. In the model, images perceived by the two eyes are very similar and positively correlated (Fig. 14a,b), making afferents from the two eyes fire together when they have overlapping receptive fields (Fig. 14b, inset). Consequently, afferents from the two eyes with overlapping receptive fields tend to be close together within the cortex, making the ocular dominance segregation align with the cortical axis of slowest retinotopy gradient. Conversely, images of light and dark features are negatively correlated (Fig. 14c,d), making ON and OFF afferents from the same eye fire together when they have partially overlapping receptive fields (Fig. 14d, inset). Consequently, ON and OFF afferents from the same eye with partially overlapping receptive fields tend to be close together within the cortex, making the ON-OFF segregation align with the cortical axis of fastest retinotopy gradient. This orthogonal arrangement of afferent segregation by eye input and contrast polarity (Kremkow et al., 2016) simply reflects the fact that the same point in visual space can be seen by both eyes but cannot be both dark and light at the same time.
Figure 14.
The eye/polarity grid. A model of visual cortical topography. a, Stereogram illustrating the image of a bicycle processed by the contralateral eye (left, gray frame) and ipsilateral eye (right, black frame). Images from public domain (http://vision.middlebury.edu/stereo/). b, Correlation between the two images illustrated in a, measured when the images are aligned (0 at x axis) and misaligned within a range between −1500 and 1500 pixels. The correlation between images seen by two frontal eyes is positive. Therefore, neighboring afferents from the two eyes should be most strongly correlated when they have overlapping receptive fields (inset). c, Stereogram illustrating the image of the bicycle processed by OFF (left, blue frame) and ON (right, red frame) cortical pathways. d, Image correlation of the two images illustrated in c. The correlation between images processed by ON and OFF cortical pathways is negative. Therefore, ON and OFF neighboring afferents should be most strongly correlated when they have partially overlapping receptive fields (inset). e, Simulation of the eye/polarity grid in human cortex shown for the entire map (top) and a cortical patch (gray square). Bottom, The cortical patch is shown in more detail. Thalamic afferents from contralateral (contra) and ipsilateral eyes (ipsi) segregate in a cortical axis (eye axis) orthogonal to the axis for ON and OFF thalamic segregation (polarity axis). The retinotopic gradient within the cortical patch is slowest along the eye axis to maximize the binocular retinotopic match across the ocular dominance border, which is needed for depth perception. It is fastest along the polarity axis to maximize the retinotopic mismatch across the ON-OFF border, which is needed to process stimulus orientation.
Discussion
We have demonstrated that the diversity of ocular dominance patterns in visual cortex is closely associated with asymmetries in cortical retinotopy. We show that ocular dominance stripes run across the cortical axis with slowest retinotopy gradient, an arrangement that maximizes the cortical retinotopic match across the ocular dominance border. The close relationship between retinotopy and ocular dominance is demonstrated in different regions of an individual cortical map, different species, and is particularly pronounced in macaques and humans. We also demonstrate that the ocular dominance stripes from the ipsilateral eye become thinner as visual cortical eccentricity increases, even within central vision. This thinning of ipsilateral-eye stripes further supports a close relationship between retinotopy and ocular dominance because retinal ganglion cell density decreases more with eccentricity in the temporal retina (that feeds ipsilateral-eye stripes) than the nasal retina (that feeds contralateral-eye stripes) (Curcio and Allen, 1990).
We use these results to propose a developmental model of visual cortical topography that segregates thalamic afferents by eye input and ON-OFF polarity along orthogonal cortical axes. Eye input segregates along the axis of slowest retinotopic gradient to maximize the binocular retinotopic match across the border of ocular dominance stripes, which is needed for depth perception. ON-OFF polarity segregates along the axis with fastest retinotopic gradient to maximize the retinotopic mismatch across the border of ON and OFF domains, which is needed to process stimulus orientation.
Relationship between cortical retinotopy and ocular dominance
Hubel and Wiesel were the first to predict a close relation between ocular dominance and cortical retinotopy. In their ice-cube model, Hubel and Wiesel represented each portion of visual space with a rectangular piece of cortex that has a length/width ratio of 2, one cortical square for each eye (Hubel and Wiesel, 1977). To accommodate the cortical machinery for the two eyes, retinotopy needs to change two times slower along the length than the width of this cortical rectangle. This prediction is consistent with the finding that ocular dominance stripes run orthogonal to the border between areas V1 and V2 because retinotopy changes slower along than across this border (Hubel and Wiesel, 1974a, 1977; Tootell et al., 1982, 1988; Blasdel and Campbell, 2001; Adams et al., 2007). However, the prediction is inconsistent with careful measurements of cortical patches near the V1/V2 border showing retinotopic ratios considerably lower than two. The retinotopic ratio within an ocular dominance stripe can range from 1.2 (Tootell et al., 1982) to 1.7 (Blasdel and Campbell, 2001), and the average cortical patch representing a square of visual space has a length/width ratio of 1.37 ± 0.15 (Blasdel and Campbell, 2001) (ratios averaged from V/H column in Table 1). The ratio of the cortical lines representing vertical/horizontal meridians in visual cortex is also 1.34 ± 0.09 (Tootell et al., 1988) (ratios averaged from Figure 13 using grabit from MATLAB to extract the data).
Comparative measurements of ocular dominance and retinotopy have been restricted in the past to the neighborhood of the V1/V2 border (Hubel and Wiesel, 1977; Blasdel and Campbell, 2001). Therefore, it has been suggested that the limited retinotopic distortion demonstrated at the V1/V2 border is a special case that cannot be generalized to the entire cortex (Tootell et al., 1982). The retinotopic ratio at the V1/V2 border could be larger than one simply because the cortical line representing the vertical meridian (V1/V2 border) is elliptical and longer than the straight line representing the horizontal meridian (Tootell et al., 1982, 1988). Contrary to this explanation, our results demonstrate a tight relation between cortical retinotopy and ocular dominance that is not restricted to the V1/V2 border but includes multiple cortical regions and different species. The strong relationship between retinotopy and ocular dominance that we demonstrate is also consistent with the asymmetric shapes of axonal arbors from thalamic afferents, which tend to run orthogonal to the V1/V2 border, even in cats (Kremkow and Alonso, 2018).
The eye/polarity grid of visual cortical topography
Hubel and Wiesel (1977) predicted that cortical retinotopy should abruptly change at the border between ocular dominance stripes. However, we could not find evidence for such abrupt retinotopic disruptions in multielectrode recordings from cat visual cortex (Kremkow et al., 2016). Also contrary to this prediction, the receptive fields from the left and right eyes of binocular neurons are exquisitely overlapped in visual space (Ohzawa et al., 1996; Tsao et al., 2003; Kara and Boyd, 2009; Wang et al., 2015; Kremkow et al., 2016). Therefore, in our model, retinotopy does not change rapidly at the border of ocular dominance stripes. It does exactly the opposite. It changes at the slowest rate across the ocular dominance border to minimize differences in retinotopy between neighboring afferents from the two eyes.
Unlike ocular dominance stripes, ON and OFF cortical domains need to be mismatched in retinotopy to process stimulus orientation and help build cortical receptive fields with spatially separate ON and OFF subregions (Reid and Alonso, 1995; Alonso et al., 1996, 2001; Lien and Scanziani, 2013; Sedigh-Sarvestani et al., 2017). In cat visual cortex, ON and OFF domains are cortically segregated, retinotopically mismatched, and run orthogonal to ocular dominance bands (Kremkow et al., 2016). Therefore, our model adopts this orthogonal relationship in what we call the eye/polarity grid (Kremkow and Alonso, 2018). In the eye/polarity grid, thalamic afferents segregate both by eye input (eye axis) and ON-OFF contrast polarity (polarity axis) along orthogonal cortical axes. The eye axis shows the slowest changes in retinotopy and the polarity axis the fastest changes. In the eye/polarity grid, ocular dominance stripes run parallel to iso-eccentricity lines (Hubel and Freeman, 1977; Adams et al., 2007) simply because cortical retinotopy changes faster along than across these lines. Moreover, the average length/width ratio of the local cortical retinotopy is 1.4 and not 2 because cortical retinotopy changes faster along the polarity than the eye axes.
Our model predicts that ocular dominance stripes should be present in any brain structure that can accommodate a large number of afferents with overlapping receptive fields from both eyes. Moreover, it predicts that variations in ocular dominance patterns should correlate with variations in the density of retinal ganglion cells that feed the cortex through the thalamus (Mazade and Alonso, 2017). Because retinal ganglion cell density can be 300% higher in the peripheral nasal than temporal retina (Curcio and Allen, 1990), the ocular dominance stripes from the ipsilateral eye should be thinner in the visual periphery. Moreover, because the density differences between nasal and temporal retina can be already present within 5 degree eccentricities (Curcio and Allen, 1990), the decrease in ipsilateral-eye stripe width should be already present within central vision, as our results demonstrate.
Our results indicate that, as retinal eccentricity increases, the cortex compensates limitations in retinal sampling by enhancing the dominance of the contralateral eye, a topographic adjustment that should have direct consequences in human vision (e.g., contralateral-eye dominance should increase with azimuth eccentricity). In our model, the decrease in retinal sampling with eccentricity makes cortical retinotopy change faster. In turn, the faster retinotopy gradient limits the ability of the cortex to accommodate a full ipsilateral-contralateral cycle of afferents with overlapping receptive fields. Therefore, in our model, ocular dominance segregation vanishes in the visual periphery of human and macaque cortex for the same reason that it vanishes in the cortex of some squirrel monkeys (Adams and Horton, 2003); because the number of afferents from the two eyes with overlapping receptive fields is reduced. In support of our model, adding more afferents from the ipsilateral eye to the cortex causes afferent segregation by eye input, even in rodents (Merlin et al., 2013; Laing et al., 2015). Moreover, directing retinal afferents from the two eyes into the same optic tectum causes ocular dominance segregation in frogs and fish (Constantine-Paton and Law, 1978; Boss and Schmidt, 1984).
Our model predicts close relationships among the V1 maps for retinotopy, ocular dominance, and ON-OFF polarity. Unfortunately, experimental measures of these relationships are still rare. Accurate reconstructions of individual V1 maps are available for ocular dominance but not for retinotopy or ON-OFF polarity. Maps with enough spatial resolution to measure retinotopy are only available as averages from multiple animals, and ON-OFF polarity maps are restricted to small cortical patches (Jin et al., 2008; Smith et al., 2015; Wang et al., 2015; Kremkow et al., 2016; Lee et al., 2016). Therefore, future experiments and new tools will be needed to reconstruct more precisely the organization of visual cortical maps and the relationship among the representation of different stimulus dimensions (Hübener et al., 1997; Nauhaus et al., 2016). These maps are crucial to understand how the cerebral cortex represents visual information and to guide future implants of cortical prosthesis in the blind.
Footnotes
This work was supported by National Institutes of Health Grant EY027361.
The authors declare no competing financial interests.
References
- Adams DL, Horton JC (2003) Capricious expression of cortical columns in the primate brain. Nat Neurosci 6:113–114. 10.1038/nn1004 [DOI] [PubMed] [Google Scholar]
- Adams DL, Horton JC (2006) Ocular dominance columns in strabismus. Vis Neurosci 23:795–805. 10.1017/S0952523806230116 [DOI] [PubMed] [Google Scholar]
- Adams DL, Sincich LC, Horton JC (2007) Complete pattern of ocular dominance columns in human primary visual cortex. J Neurosci 27:10391–10403. 10.1523/JNEUROSCI.2923-07.2007 [DOI] [PMC free article] [PubMed] [Google Scholar]
- Albus K. (1975) A quantitative study of the projection area of the central and the paracentral visual field in area 17 of the cat: I. The precision of the topography. Exp Brain Res 24:159–179. 10.1007/BF00234061 [DOI] [PubMed] [Google Scholar]
- Alonso JM, Usrey WM, Reid RC (1996) Precisely correlated firing in cells of the lateral geniculate nucleus. Nature 383:815–819. 10.1038/383815a0 [DOI] [PubMed] [Google Scholar]
- Alonso JM, Usrey WM, Reid RC (2001) Rules of connectivity between geniculate cells and simple cells in cat primary visual cortex. J Neurosci 21:4002–4015. 10.1523/JNEUROSCI.21-11-04002.2001 [DOI] [PMC free article] [PubMed] [Google Scholar]
- Anderson PA, Olavarria J, Van Sluyters RC (1988) The overall pattern of ocular dominance bands in cat visual cortex. J Neurosci 8:2183–2200. 10.1523/JNEUROSCI.08-06-02183.1988 [DOI] [PMC free article] [PubMed] [Google Scholar]
- Blasdel G, Campbell D (2001) Functional retinotopy of monkey visual cortex. J Neurosci 21:8286–8301. 10.1523/JNEUROSCI.21-20-08286.2001 [DOI] [PMC free article] [PubMed] [Google Scholar]
- Boss VC, Schmidt JT (1984) Activity and the formation of ocular dominance patches in dually innervated tectum of goldfish. J Neurosci 4:2891–2905. 10.1523/JNEUROSCI.04-12-02891.1984 [DOI] [PMC free article] [PubMed] [Google Scholar]
- Constantine-Paton M, Law MI (1978) Eye-specific termination bands in tecta of three-eyed frogs. Science 202:639–641. 10.1126/science.309179 [DOI] [PubMed] [Google Scholar]
- Curcio CA, Allen KA (1990) Topography of ganglion cells in human retina. J Comp Neurol 300:5–25. 10.1002/cne.903000103 [DOI] [PubMed] [Google Scholar]
- Daniel PM, Whitteridge D (1961) The representation of the visual field on the cerebral cortex in monkeys. J Physiol 159:203–221. 10.1113/jphysiol.1961.sp006803 [DOI] [PMC free article] [PubMed] [Google Scholar]
- DeBruyn EJ, Casagrande VA (1981) Demonstration of ocular dominance columns in a new world primate by means of monocular deprivation. Brain Res 207:453–458. 10.1016/0006-8993(81)90378-4 [DOI] [PubMed] [Google Scholar]
- Harvey BM, Dumoulin SO (2011) The relationship between cortical magnification factor and population receptive field size in human visual cortex: constancies in cortical architecture. J Neurosci 31:13604–13612. 10.1523/JNEUROSCI.2572-11.2011 [DOI] [PMC free article] [PubMed] [Google Scholar]
- Horton JC, Hocking DR (1996) Anatomical demonstration of ocular dominance columns in striate cortex of the squirrel monkey. J Neurosci 16:5510–5522. 10.1523/JNEUROSCI.16-17-05510.1996 [DOI] [PMC free article] [PubMed] [Google Scholar]
- Horton JC, Hoyt WF (1991) The representation of the visual field in human striate cortex: a revision of the classic Holmes map. Arch Ophthalmol 109:816–824. 10.1001/archopht.1991.01080060080030 [DOI] [PubMed] [Google Scholar]
- Hubel DH, Freeman DC (1977) Projection into the visual field of ocular dominance columns in macaque monkey. Brain Res 122:336–343. 10.1016/0006-8993(77)90299-2 [DOI] [PubMed] [Google Scholar]
- Hubel DH, Wiesel TN (1974a) Sequence regularity and geometry of orientation columns in the monkey striate cortex. J Comp Neurol 158:267–293. 10.1002/cne.901580304 [DOI] [PubMed] [Google Scholar]
- Hubel DH, Wiesel TN (1974b) Uniformity of monkey striate cortex: a parallel relationship between field size, scatter, and magnification factor. J Comp Neurol 158:295–305. 10.1002/cne.901580305 [DOI] [PubMed] [Google Scholar]
- Hubel DH, Wiesel TN (1977) Ferrier lecture: functional architecture of macaque monkey visual cortex. Proc R Soc Lond B Biol Sci 198:1–59. 10.1098/rspb.1977.0085 [DOI] [PubMed] [Google Scholar]
- Hübener M, Shoham D, Grinvald A, Bonhoeffer T (1997) Spatial relationships among three columnar systems in cat area 17. J Neurosci 17:9270–9284. 10.1523/JNEUROSCI.17-23-09270.1997 [DOI] [PMC free article] [PubMed] [Google Scholar]
- Huberman AD, Feller MB, Chapman B (2008) Mechanisms underlying development of visual maps and receptive fields. Annu Rev Neurosci 31:479–509. 10.1146/annurev.neuro.31.060407.125533 [DOI] [PMC free article] [PubMed] [Google Scholar]
- Jang J, Paik SB (2017) Interlayer repulsion of retinal ganglion cell mosaics regulates spatial organization of functional maps in the visual cortex. J Neurosci 37:12141–12152. 10.1523/JNEUROSCI.1873-17.2017 [DOI] [PMC free article] [PubMed] [Google Scholar]
- Jin JZ, Weng C, Yeh CI, Gordon JA, Ruthazer ES, Stryker MP, Swadlow HA, Alonso JM (2008) On and off domains of geniculate afferents in cat primary visual cortex. Nat Neurosci 11:88–94. 10.1038/nn2029 [DOI] [PMC free article] [PubMed] [Google Scholar]
- Kara P, Boyd JD (2009) A micro-architecture for binocular disparity and ocular dominance in visual cortex. Nature 458:627–631. 10.1038/nature07721 [DOI] [PMC free article] [PubMed] [Google Scholar]
- Kaschube M, Wolf F, Puhlmann M, Rathjen S, Schmidt KF, Geisel T, Löwel S (2003) The pattern of ocular dominance columns in cat primary visual cortex: intra- and interindividual variability of column spacing and its dependence on genetic background. Eur J Neurosci 18:3251–3266. 10.1111/j.1460-9568.2003.02979.x [DOI] [PubMed] [Google Scholar]
- Kremkow J, Alonso JM (2018) Thalamocortical circuits and functional architecture. Annu Rev Vis Sci 4:263–285. 10.1146/annurev-vision-091517-034122 [DOI] [PMC free article] [PubMed] [Google Scholar]
- Kremkow J, Jin J, Wang Y, Alonso JM (2016) Principles underlying sensory map topography in primary visual cortex. Nature 533:52–57. 10.1038/nature17936 [DOI] [PMC free article] [PubMed] [Google Scholar]
- Laing RJ, Turecek J, Takahata T, Olavarria JF (2015) Identification of eye-specific domains and their relation to callosal connections in primary visual cortex of Long–Evans rats. Cereb Cortex 25:3314–3329. 10.1093/cercor/bhu128 [DOI] [PMC free article] [PubMed] [Google Scholar]
- Lee KS, Huang X, Fitzpatrick D (2016) Topology of ON and OFF inputs in visual cortex enables an invariant columnar architecture. Nature 533:90–94. 10.1038/nature17941 [DOI] [PMC free article] [PubMed] [Google Scholar]
- LeVay S, Hubel DH, Wiesel TN (1975) The pattern of ocular dominance columns in macaque visual cortex revealed by a reduced silver stain. J Comp Neurol 159:559–576. 10.1002/cne.901590408 [DOI] [PubMed] [Google Scholar]
- LeVay S, Connolly M, Houde J, Van Essen DC (1985) The complete pattern of ocular dominance stripes in the striate cortex and visual field of the macaque monkey. J Neurosci 5:486–501. 10.1523/JNEUROSCI.05-02-00486.1985 [DOI] [PMC free article] [PubMed] [Google Scholar]
- Lien AD, Scanziani M (2013) Tuned thalamic excitation is amplified by visual cortical circuits. Nat Neurosci 16:1315–1323. 10.1038/nn.3488 [DOI] [PMC free article] [PubMed] [Google Scholar]
- Mazade R, Alonso JM (2017) Thalamocortical processing in vision. Vis Neurosci 34:E007. 10.1017/S0952523817000049 [DOI] [PMC free article] [PubMed] [Google Scholar]
- McConnell SK, LeVay S (1984) Segregation of on- and off-center afferents in mink visual cortex. Proc Natl Acad Sci U S A 81:1590–1593. 10.1073/pnas.81.5.1590 [DOI] [PMC free article] [PubMed] [Google Scholar]
- Merlin S, Horng S, Marotte LR, Sur M, Sawatari A, Leamey CA (2013) Deletion of ten-m3 induces the formation of eye dominance domains in mouse visual cortex. Cereb Cortex 23:763–774. 10.1093/cercor/bhs030 [DOI] [PMC free article] [PubMed] [Google Scholar]
- Miller KD. (1994) A model for the development of simple cell receptive fields and the ordered arrangement of orientation columns through activity-dependent competition between ON- and OFF-center inputs. J Neurosci 14:409–441. 10.1523/JNEUROSCI.14-01-00409.1994 [DOI] [PMC free article] [PubMed] [Google Scholar]
- Nauhaus I, Nielsen KJ, Callaway EM (2016) Efficient receptive field tiling in primate V1. Neuron 91:893–904. 10.1016/j.neuron.2016.07.015 [DOI] [PMC free article] [PubMed] [Google Scholar]
- Norton TT, Rager G, Kretz R (1985) ON and OFF regions in layer IV of striate cortex. Brain Res 327:319–323. 10.1016/0006-8993(85)91527-6 [DOI] [PubMed] [Google Scholar]
- Ohzawa I, DeAngelis GC, Freeman RD (1996) Encoding of binocular disparity by simple cells in the cat's visual cortex. J Neurophysiol 75:1779–1805. 10.1152/jn.1996.75.5.1779 [DOI] [PubMed] [Google Scholar]
- Paik SB, Ringach DL (2011) Retinal origin of orientation maps in visual cortex. Nat Neurosci 14:919–925. 10.1038/nn.2824 [DOI] [PMC free article] [PubMed] [Google Scholar]
- Rakic P. (1977) Prenatal development of the visual system in rhesus monkey. Philos Trans R Soc Lond B Biol Sci 278:245–260. 10.1098/rstb.1977.0040 [DOI] [PubMed] [Google Scholar]
- Reid RC, Alonso JM (1995) Specificity of monosynaptic connections from thalamus to visual cortex. Nature 378:281–284. 10.1038/378281a0 [DOI] [PubMed] [Google Scholar]
- Sedigh-Sarvestani M, Vigeland L, Fernandez-Lamo I, Taylor MM, Palmer LA, Contreras D (2017) Intracellular, in vivo, dynamics of thalamocortical synapses in visual cortex. J Neurosci 37:5250–5262. 10.1523/JNEUROSCI.3370-16.2017 [DOI] [PMC free article] [PubMed] [Google Scholar]
- Selemon LD, Begovic A (2007) Stereologic analysis of the lateral geniculate nucleus of the thalamus in normal and schizophrenic subjects. Psychiatry Res 151:1–10. 10.1016/j.psychres.2006.11.003 [DOI] [PMC free article] [PubMed] [Google Scholar]
- Shatz CJ, Stryker MP (1978) Ocular dominance in layer IV of the cat's visual cortex and the effects of monocular deprivation. J Physiol 281:267–283. 10.1113/jphysiol.1978.sp012421 [DOI] [PMC free article] [PubMed] [Google Scholar]
- Smith GB, Whitney DE, Fitzpatrick D (2015) Modular representation of luminance polarity in the superficial layers of primary visual cortex. Neuron 88:805–818. 10.1016/j.neuron.2015.10.019 [DOI] [PMC free article] [PubMed] [Google Scholar]
- Spatz WB. (1989) Loss of ocular dominance columns with maturity in the monkey, Callithrix jacchus. Brain Res 488:376–380. 10.1016/0006-8993(89)90734-8 [DOI] [PubMed] [Google Scholar]
- Speer CM, Mikula S, Huberman AD, Chapman B (2010) The developmental remodeling of eye-specific afferents in the ferret dorsal lateral geniculate nucleus. Anat Rec (Hoboken) 293:1–24. 10.1002/ar.21001 [DOI] [PMC free article] [PubMed] [Google Scholar]
- Swindale NV. (1980) A model for the formation of ocular dominance stripes. Proc R Soc Lond B Biol Sci 208:243–264. 10.1098/rspb.1980.0051 [DOI] [PubMed] [Google Scholar]
- Takahata T, Miyashita M, Tanaka S, Kaas JH (2014) Identification of ocular dominance domains in new world owl monkeys by immediate-early gene expression. Proc Natl Acad Sci U S A 111:4297–4302. 10.1073/pnas.1401951111 [DOI] [PMC free article] [PubMed] [Google Scholar]
- Tootell RB, Silverman MS, Switkes E, De Valois RL (1982) Deoxyglucose analysis of retinotopic organization in primate striate cortex. Science 218:902–904. 10.1126/science.7134981 [DOI] [PubMed] [Google Scholar]
- Tootell RB, Switkes E, Silverman MS, Hamilton SL (1988) Functional anatomy of macaque striate cortex: II. Retinotopic organization. J Neurosci 8:1531–1568. 10.1523/JNEUROSCI.08-05-01531.1988 [DOI] [PMC free article] [PubMed] [Google Scholar]
- Tsao DY, Conway BR, Livingstone MS (2003) Receptive fields of disparity-tuned simple cells in macaque V1. Neuron 38:103–114. 10.1016/S0896-6273(03)00150-8 [DOI] [PMC free article] [PubMed] [Google Scholar]
- Tusa RJ, Palmer LA, Rosenquist AC (1978) The retinotopic organization of area 17 (striate cortex) in the cat. J Comp Neurol 177:213–235. 10.1002/cne.901770204 [DOI] [PubMed] [Google Scholar]
- Van Essen DC, Newsome WT, Maunsell JH (1984) The visual field representation in striate cortex of the macaque monkey: asymmetries, anisotropies, and individual variability. Vision Res 24:429–448. 10.1016/0042-6989(84)90041-5 [DOI] [PubMed] [Google Scholar]
- Wang Y, Jin J, Kremkow J, Lashgari R, Komban SJ, Alonso JM (2015) Columnar organization of spatial phase in visual cortex. Nat Neurosci 18:97–103. 10.1038/nn.3878 [DOI] [PMC free article] [PubMed] [Google Scholar]
- Zahs KR, Stryker MP (1988) Segregation of ON and OFF afferents to ferret visual cortex. J Neurophysiol 59:1410–1429. 10.1152/jn.1988.59.5.1410 [DOI] [PubMed] [Google Scholar]
Associated Data
This section collects any data citations, data availability statements, or supplementary materials included in this article.
Supplementary Materials
Analysis of single stripes from contralateral (white) and ipsilateral eyes (black) in human cortex. The red outline shows the selected stripe. The top label shows the stripe number and length. The bottom panel shows histograms with the distribution of stripe width (left) and angle (right) measured at each image pixel and the mean stripe width and angle (top label).


