

Abstract
Whereas subcortical structures such as the basal ganglia have been widely explored in relation to motor control, recent evidence suggests that their mechanisms extend to the domain of attentional switching. We here investigated the subcortical involvement in reward related top-down control of visual alpha-band oscillations (8–13 Hz), which have been consistently linked to mechanisms supporting the allocation of visuospatial attention. Given that items associated with contextual saliency (e.g., monetary reward or loss) attract attention, it is not surprising that the acquired salience of visual items further modulates. The executive networks controlling such reward-dependent modulations of oscillatory brain activity have yet to be fully elucidated. Although such networks have been explored in terms of corticocortical interactions, subcortical regions are likely to be involved. To uncover this, we combined MRI and MEG data from 17 male and 11 female participants, investigating whether derived measures of subcortical structural asymmetries predict interhemispheric modulation of alpha power during a spatial attention task. We show that volumetric hemispheric lateralization of globus pallidus (GP) and thalamus (Th) explains individual hemispheric biases in the ability to modulate posterior alpha power. Importantly, for the GP, this effect became stronger when the value saliency parings in the task increased. Our findings suggest that the GP and Th in humans are part of a subcortical executive control network, differentially involved in modulating posterior alpha activity in the presence of saliency. Further investigation aimed at uncovering the interaction between subcortical and neocortical attentional networks would provide useful insight in future studies.
SIGNIFICANCE STATEMENT Whereas the involvement of subcortical regions into higher level cognitive processing, such as attention and reward attribution, has been already indicated in previous studies, little is known about its relationship with the functional oscillatory underpinnings of said processes. In particular, interhemispheric modulation of alpha band (8–13 Hz) oscillations, as recorded with magnetoencephalography, has been previously shown to vary as a function of salience (i.e., monetary reward/loss) in a spatial attention task. We here provide novel insights into the link between subcortical and cortical control of visual attention. Using the same reward-related spatial attention paradigm, we show that the volumetric lateralization of subcortical structures (specifically globus pallidus and thalamus) explains individual biases in the modulation of visual alpha activity.
Keywords: attention, basal ganglia, magnetic resonance imaging, magnetoencephalography, reward
Introduction
Functioning in the natural world necessitates the presence of neuronal mechanisms capable of prioritizing stimuli according to their relevance (Nobre and Kastner, 2014). Deployment of attentional resources is biased toward stimuli associated with salience (e.g., monetary reward or loss), even when unrelated to the current task (Chelazzi et al., 2013). Posterior neuronal oscillations in the alpha band (8–13 Hz) reflect the allocation of covert attention (Worden et al., 2000; Kelly et al., 2006; Thut et al., 2006; Jensen and Mazaheri, 2010) and they have been shown to be mediated by corticocortical interactions (Capotosto et al., 2012; Ptak, 2012; Vossel et al., 2014; Marshall et al., 2015a,b). Conversely, these cortical networks are further modulated by subcortical input (van Schouwenburg et al., 2010a,b), whose involvement in posterior oscillations remains still unclear. Previous literature has indeed linked subcortical activity to cognitive control (Cummings, 1993; Jahfari et al., 2011; Braunlich and Seger, 2013), but a direct link between these structures and alpha band oscillations has not been established.
Electrophysiological activity from subcortical regions are poorly detected with magnetoencephalography (MEG). Alternatively, subcortical structures measured by magnetic resonance imaging (MRI) can be related to oscillatory brain activity (Tomer et al., 2008, 2013). For instance, it has been demonstrated that individual hemispheric asymmetries in the volume of the superior longitudinal fasciculus (SLF) relates to the individual ability to modulate posterior alpha oscillations (Marshall et al., 2015a). Importantly, subjects with greater right than left SLF volume also displayed higher modulation of posterior alpha activity in the left hemisphere, compared with the right (and vice versa). Through an analogous approach, we postulated that volumetric asymmetries of subcortical areas would be reflected by individual interhemispheric biases in the modulation of alpha oscillations during selective attention in a reward context. Basal ganglia (BG), in addition to motor control, have a well established role in reward processing and salience attribution (Hikosaka et al., 2008, 2014; Shulman et al., 2009; Braunlich and Seger, 2013), and recent studies have already pointed to their functions extending into higher level cognitive processing (Arcizet and Krauzlis, 2018). This notion has been initially explored in animal recordings (Tremblay et al., 1998; Schultz et al., 2000; Lauwereyns et al., 2002; Shipp, 2004; Saalmann and Kastner, 2011; Schechtman et al., 2016), whereas in humans, it has recently been suggested that the BG play also a specific role in spatial attention and selection (van Schouwenburg et al., 2010a; Tommasi et al., 2015a; Van Schouwenburg et al., 2015). Another subcortical structure playing a crucial role in cognitive processing is the thalamus (Fiebelkorn et al., 2019; Jaramillo et al., 2019), whose nuclei are involved in the regulation of synchronized activity in the visual cortex in relation to visual attention and largely interact with the BG (Lopes da Silva et al., 1980; Saalmann et al., 2012; Zhou et al., 2016; Halgren et al., 2017).
Here, we reanalyzed MEG and structural data collected in a previous study that considered the impact of stimuli paired with value salience on the modulation of oscillatory brain activity in a covert attention task (Marshall et al., 2018). The participants performed a spatial cueing task, with Chinese symbols serving as targets and distractors. Before the recordings, stimuli were paired with monetary rewards or losses. Marshall et al. (2018) successfully demonstrated a location-specific influence for the stimuli associated with reward and loss. Specifically, alpha lateralization demonstrated sensitivity to stimulus salience, but not to stimulus valence: both positive and negative targets (i.e., salient targets) produced increased alpha lateralization compared with neutral targets, and both positive and negative distractors (i.e., salient distractors) reduced alpha lateralization compared with neutral distractors. Given these findings, we here examine the further link between lateralization of subcortical structures and alpha oscillations. We hence reanalyzed these data with the aim to investigate the putative role of the subcortical brain areas in biasing alpha power modulation during attentional shifts to stimuli paired with value saliency. MRI data of the participants were processed to estimate volumetric asymmetries of subcortical areas, consistent with methods used in previous studies on clinical and healthy population (Womer et al., 2014; Guadalupe et al., 2017; Okada et al., 2016). We focused on identifying the link between individual volumetric asymmetries of subcortical areas and individual interhemispheric bias in the ability to modulate posterior alpha oscillations. Crucially, we further examined whether this relationship was affected by the degree of stimulus-value associations in the task. Furthermore, we included 612 MRI scans to evaluate subcortical volumetric asymmetries in a larger dataset.
Materials and Methods
Participants
In the present study, we reanalyzed the previously acquired dataset described in Marshall et al. (2018), where 28 healthy volunteers participated in the study (mean age: 23 ± 2.7 years; 17 female; all right handed). All participants reported normal or corrected-to-normal vision and no prior knowledge of Chinese language. Of these, datasets from three participants were excluded from the analysis (due to respectively: technical error during acquisition, excessive eye movements during MEG recording and structural MRI data not acquired), leaving 25 participants. The experiment was conducted in compliance with the Declaration of Helsinki and was approved by the local ethics board (CMO region Arnhem-Nijmegen, CMO2001/095).
Experimental design
The experiment consisted of two phases: in the learning phase, participants were trained to memorize associations between six Chinese characters and three different values (positive, negative, neutral). Conditioning was implemented by means of visual and auditory feedback: two symbols were associated with reward (+80 cents and a “ka-ching” sound), two with loss (−80 cents and a “buzz” sound) and two with no value (0 cents and a “beep” sound) (see Fig. 1A for an example stimulus–reward association). The stimulus–reward pairing was randomized across participants. Each trial started with the display of three fixation crosses (1000 ms), followed by the presentation of a Chinese character (1000 ms), together with its matching visual and auditory feedback (Fig. 1B). Stimuli were displayed on a gray background and each was presented 12 times in a randomized order. The learning phase was conducted in a laboratory with attenuated sound and light and without MEG recording. With the aim of reducing extinction, upon completion of this phase participants were informed that the learnt stimulus-feedback associations would be signaling real reward outcomes throughout the testing phase (i.e., the presentation of a Chinese character, regardless of its role as target or distractor, would result in a financial reward, loss or none). After the learning phase, participants performed a testing phase (Fig. 1C), when they were required to perform a covert spatial attention tasks including the stimuli previously associated with a monetary outcome, whereas ongoing electromagnetic activity was recorded with MEG.
Figure 1.

Illustration of selective attention task: stimuli and reward manipulation. A, Six Chinese symbols served as stimuli for the task and were associated with three values: two paired with reward, two with loss and two with no financial change (neutral). B, Representative trial of the learning phase. Symbols were displayed for 1000 ms, systematically paired with the corresponding (positive, negative or neutral) value, via visual and auditory feedback. Characters presentation was alternated with a 1000 ms fixation period. During the training phase, participants learned associations between the stimuli and their reward value. C, Representative trial of the testing phase. After a 1000 ms pretrial interval, participants were primed with a 500 ms preparatory cue signaling the upcoming stimuli. Two characters were then presented to the left and right hemifield, together with a spatial cue, instructing participants to covertly attend the symbol on the cued side (target) and ignore the other one (distractor). Participants' task was to report when the target stimulus changed contrast. Contrast change could either occur after 750 ms (13% of trials), 1450 ms (47% of trials), or 2350 ms (40% of the trials). In 95% of the trials, the target changed contrast (valid trials), whereas in 5% of the trials, the distractor changed contrast (invalid trials). (Figure adapted with permission from Marshall et al., 2018).
In the testing phase, participants performed eight blocks of 72 trials. Each trial started with the presentation of three fixation crosses for 1000 ms (pretrial interval), whose contrast subsequently decreased, as a preparatory cue indicating imminent stimuli presentation. After 500 ms, two symbols were presented to the left and right of the screen (8° visual angle) respectively, together with a central fixation cross flanked by two arrows, indicating the target side. Participants were instructed to covertly attend the symbol on the cued side (“target”) and to ignore the other one (“distractor”), until one of them changed contrast. The contrast change either increased or decreased with equal probability, with onset after 750 ms (13% trials), 1450 ms (47% trials, “short interval trials”) or 2350 ms (40%, “long interval trials”) from stimulus presentation. Participants were asked to report the direction of the contrast change at the targeted ('cued') location as quickly as possible by button press, using the index or middle finger of the right hand to indicate their choice (finger-direction mapping was randomized across participants). Participants were instructed to refrain from responding when the distractor changed contrast. Shorter intervals of 750 ms were used to ensure that participants would start covertly directing their attention rapidly after the cue; these trials were not included in the analysis. The target changed contrast on 95% of the trials (valid trials), whereas in the remaining trials the distractor did (invalid trials). The approximate duration of the full task in the MEG was 50 min.
As a result of the conditioning manipulation in the learning phase, targets and distractors in the task would be associated with either a salient (positive or negative) or a neutral value, resulting in three categories of trials of interest, as represented by different levels of value salience, namely: zero (target and distractor neutral), one (target or distractor salient) or two (target and distractor salient) value salience levels.
MEG data acquisition
Electromagnetic brain activity was recorded from participants while seated, using a CTF 275-channel whole-head MEG system with axial gradiometers (CTF MEG System; VSM MedTech). The data were sampled at 1200 Hz, following an anti-aliasing filter set at 300 Hz. Head position was constantly monitored throughout the experiment via online head-localization software. This had access to the position of the three head localization coils placed at anatomical fiducials (nasion, left and right ear), allowing, if necessary, readjustment of the participant's position between blocks (Stolk et al., 2013). Horizontal and vertical EOG and ECG electrodes were recorded with bipolar Ag/AgCl electrodes.
MEG data analysis
MEG data analysis was performed using the FieldTrip Toolbox running in MATLAB (Oostenveld et al., 2011). Continuous data were segmented in epochs, centered at the onset of the target contrast change, encompassing the preceding 1500 ms and the following 200 ms (this way covering the full stimulus presentation window for short trials). A notch filter was applied at 50, 100, 150 Hz to remove line noise, the mean was subtracted and the linear trend removed. Automatic artifact rejection was implemented for detection and removal of trials containing eye blinks and horizontal eye movements (detected with EOG), MEG sensor jumps and muscle artifacts. We produced virtual planar gradiometers by computing spatial derivatives of the magnetic signal recorded with axial gradiometers (Bastiaansen and Knösche, 2000). The method has the advantage of improving the interpretation of the topographic mapping since neural sources would produce a gradient field directly above them. Time–frequency representations (TFR) of power were then calculated for the resulting pairs of orthogonal planar gradiometers, before summing the power values at each sensor. The analysis was performed by sliding a fixed time window of 500 ms in steps of 50 ms. The resulting data segments were multiplied by a Hanning taper and a fast Fourier transform was applied in the 2–30 Hz frequency range, in steps of 2 Hz. This procedure was applied only for correct valid trials, separately for left and right cued conditions.
For each participant, TFRs were averaged across trials and a modulation index (MI) was computed for each sensor k and over all time points t belonging to the time window of interest, 750–0 ms, according to the following formula:
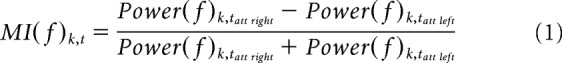 |
Where Power(f)k,tatt left represents the power at a given frequency f in the condition “attend left” and Power(f)k,tatt right is the power of the same frequency in the condition “attend right.” As a result, positive (or negative) MI values, at a given sensor k and given time point t, indicate higher power at a given frequency f when attention was covertly directed toward the right (or left) hemifield.
Two clusters of sensors were then derived, by selecting the 20 symmetrical occipitoparietal sensors (i.e., 10 pairs of sensors) showing the highest interhemispheric difference in alpha modulation indices, when considering the grand average over all conditions (see Fig. 2A) averaged over the previously defined time window of interest. These clusters constituted the regions of interests (ROIs) on which subsequent analysis was focused. Subsequently, to quantify individual hemispheric-specific bias with respect to modulation indices in the alpha range (MI(α), we calculated the hemispheric lateralized modulation (HLM) index per participant as follows:
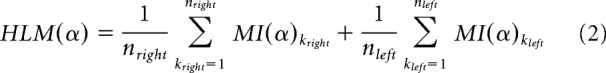 |
Where kleft and kright denote sensors belonging to the aforementioned and previously defined left and right clusters, respectively. Please note that MI(α)k indices in Equation2 (for both k = 1, …, nright and k = 1, …, nleft) are already a result of an average over time points of interest t. Since MI(α) values were obtained by subtracting alpha power in attend left trials from attend right trials and given that, as a result of attentional allocation, alpha power is suppressed in the hemisphere contralateral to the attended hemifield, a positive HLM(α) value indicated that a given participant displayed higher modulation of absolute magnitude of alpha power in the right compared with the left hemisphere, and vice versa (see Fig. 2B).
Figure 2.

Grand average MI and HLM distribution across participants. A, TFRs and topographical plot showing contrast between the 'attend right' and the 'attend left' trials trials. A clear modulation is visible at posterior sensors in the alpha band (8–13 Hz) in the −750 to 0 ms interval (this time window being considered for the computation of HLM(α) indices in B. Sensors included in the left and right ROIs are marked as dots. Trials are locked to the onset of the contrast change (t = 0). B, Side panels show the temporal evolution of modulation indices in the alpha range MI(α) averaged over sensors within left and right hemisphere ROIs. The magnitude (absolute value) of MI(α) progressively increased in the stimulus interval until the onset of the contrast change. Middle, Distribution of HLM(α) indices across participants, computed over the ROIs and 8 to 13 Hz frequency band (see Materials and Methods). A normal density function is superimposed, denoting no hemispheric bias in lateralized modulation values across participants (Shapiro–Wilk, W = 0.958, p = 0.392).
Analogously, lateralized indices (LI) of power modulation were computed for the alpha frequency band and for each subject at the cluster level according to the following formula:
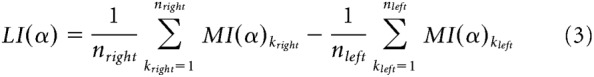 |
Also in this formula, kleft and kright denote sensors belonging to the aforementioned left and right clusters, respectively. Because MI(α) values were obtained by contrasting alpha power in 'attend right' versus 'attend left' trials (see Eq. 1), left hemisphere MI(α) were mostly represented by negative values, and right hemisphere MI(α) by positive values. Consequently, higher LI(α) indicated higher alpha lateralization for a given subject (i.e., higher interhemispheric difference in absolute alpha modulation).
Structural data acquisition
T1-weighted images of three out of 25 participants were acquired on a 3 T MRI scanner (Magnetom TIM Trio; Siemens), acquisition parameters: TR/TE = 2300/3.03 ms; FA = 8°; FoV = 256 × 256 mm; slice thickness = 1 mm; Acquisition matrix = 0 × 256 × 256 × 0. For the remaining participants, a 1.5T MRI scanner was used (Magnetom AVANTO; Siemens). Acquisition parameters were as follows: TR/TE = 2250/2.95 ms; FA = 15°; FoV = 256 × 256 mm; slice thickness = 1 mm; acquisition matrix = 0 × 256 × 256 × 0.
Analysis
Structural analyses were conducted using the Integrated Registration and Segmentation Tool (FIRST) within FMRIB's Software Library (FSL) v5.0.9 (www.fmrib.ox.ac.uk/fsl/, Oxford Centre for Functional MRI of the Brain). A standard 12 degrees of freedom affine registration to MNI152 space was applied to individual T1 images, adjusted with optimal subcortical weighting. Bayesian models implemented in the software are derived from a training based on previous manual segmentation of 336 datasets (provided by the Center for Morphometric Analysis at Massachusetts General Hospital in Boston) and applied to registered images to extract subcortical volumetric outputs for left and right hemispheres (see Fig. 3A).
Figure 3.

Basal ganglia volumes resulting from semiautomated subcortical segmentation implemented. A, Orthogonal view and 3D rendering. Subcortical volumes are overlaid as meshes on the anatomical MRI of one of the participants (following defacing procedure in Freesurfer, where voxels outside the brain mask with identifiable facial features were excluded (Bischoff-Grethe et al., 2007). B, Histograms with superimposition of normal density function, showing the distribution of subcortical lateralization indices for each substructure. In our sample, Acb and Th volumes were left lateralized (p = 0.0001 and p = 0.0003, respectively), whereas CN showed a right lateralization (p = 0.0029).
Given the reward components of the task we then focused on regions of the BG identified by the algorithm namely the globus pallidus (GP), nucleus accumbens (Acb), caudate nucleus (CN), and putamen (Pu), as well as the thalamus (Th). However, an appropriate model attempting to describe basal ganglia influence on reward-related alpha modulation needs to take into account the broader network of subcortical interconnections with neighboring nuclei. To this end, we included in the analysis the amygdala (Am) and the hippocampus (Hpc), whose interconnection has particularly been highlighted in the context of guided behavior when saliency processing was crucial (Paton et al., 2006; Zheng et al., 2017).
To compute hemispheric lateralized volume indices (LVs) for each substructure of interest s, we used the following formula, which controls for individual differences in specific subcortical volumes via normalization by total bilateral volume, commonly used to evaluate structural brain asymmetries (Guadalupe et al., 2017; Okada et al., 2016) as follows:
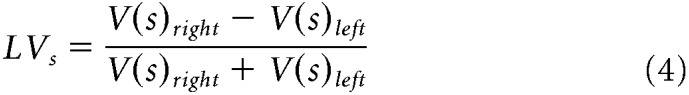 |
Where Vsright and Vsleft represent, respectively, the anatomical right and left volumes (in voxels) for a given substructure s. Analogously to Equation 2, a positive (or negative) LVs index, in a given participant, indicated a greater right (or left) volume for a given substructure s (see Fig. 3B).
Statistical analysis
Generalized linear model.
To determine the relationship between basal ganglia lateralized volumes (LVs) and electromagnetic indices [HLM(α)] we applied a generalized linear regression model (GLM), specifying subcortical volumes lateralization (LVs values) as regressors and individual HLM values as the response vector.
To identify the optimal set of regressors to best predict HLM(α) indices, we pursued a model building strategy that would enable us to test the key hypothesis concerning the role of the BG and the thalamus. Hence, we considered all linear mixed-effects models including all possible combinations of at least 3 regressors (LV indices) using maximum likelihood estimation as parameter estimation method. We hence separately considered the models derived from all possible combinations of regressors, including 2, 3, 4, 5, or 6 regressors (i.e., ROIs), by “picking” the regressors from the lateralized subcortical volumes initially considered: (LVGP, LVAcb, LVCN, LVPu, LVTh, LVAm, LVHpc).
This resulted into a set of models for each of the four options (2, 3, 4, 5, or 6 regressors). Next, for each of the options, we derived the model associated with the lowest Akaike information criterion (AIC) and Bayesian information criterion (BIC), values commonly used for selection of best predictor subsets for a statistical model. Upon selection, we ended up with the four best models, representative of each of the four options described above.
The final step, was to identify the winning model among the selected ones (i.e., those with the lowest AIC and BIC values) and compare it with the full model (seven regressors), which included the whole set of substructures, according to the following formula:
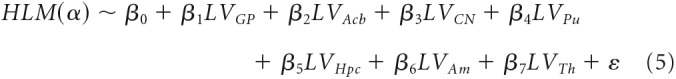 |
All subsequent analysis on the relationship between volumetric and oscillatory data specifically focused only on the subcortical structure(s) associated with a significant β coefficient in the model in Equation 5, below referred as LVs.
Cluster-based permutation test.
To evaluate whether the linear association between LVs and HLM was effectively limited to the alpha band, a cluster based permutation approach (Maris and Oostenveld, 2007) was used over the full time frequency spectrum of interest. This method effectively allows to statistically control for multiple comparisons over all time and frequency points of interest. After selecting the a priori sensors belonging to the formerly specified ROIs, we considered a permutation distribution of regression coefficients derived from randomly pairing participants' LVs value (independent variable) and modulation indices (MI(f) 1000 times. At every time-by-frequency point, the actual regression coefficient was evaluated against the aforementioned distribution by means of a specified critical α value. Afterward, a time–frequency map of the cluster level statistics was derived showing sets of sensors associated with a significant effect.
An equivalent approach was later applied to investigate possible hemisphere-specific differences in alpha modulation between participants showing a right or left lateralized substructure s. Directionality of lateralization was determined by median split of the distribution of LVs per participant, producing two subgroups of n = 12, representing subjects with a larger left or right volume of substructure s. After having a priori averaged across the time–frequency spectrum of interest ([−1500 to 0] ms, 8–13 Hz), MI(α) values at every sensor were compared between the two subgroups (right vs left lateralized substructure). The actual t-value was then compared with a permutation distribution of t-statistic derived from randomly partitioning indices between the two groups 1000 times. As a result, a topography map was plotted displaying eventual cluster(s) of sensors associated with a significant t-value (i.e., a significant difference in MI(α) between subgroups).
Comparison between Pearson's correlation coefficients.
Finally, we aimed at comparing the association between the derived structural and functional lateralization indices in different value salience occurrences. To this end, we calculated HLM(α) values for each participant separately for the three reward-related contingencies and computed the Pearson's correlations with LVs indices that displayed a significant β as arising from the model in Equation 5. We statistically assessed the difference in correlation coefficients between the three experimental conditions considered, according to the method described in (Wilcox, 2016a). The test implements a percentile resampling technique by generating a bootstrap sample of the difference of the correlation coefficients between the overlapping variable LVGP (Y) and the two variables representing the HLM(α) for the two experimental conditions (VO levels) to be compared (X1, X2). As suggested in the method, we used a Winsorized correlation to achieve a robust measure of association between variables. This transformation has been shown to effectively control for the influence of outliers on the correlation estimate (Wilcox, 2016b). A confidence interval was then computed on the resulting bootstrap distribution, to assess the statistical significance of the actual difference between correlation coefficients describing the different VOs.
Behavioral data analysis.
To assess whether subjects displayed a spatial bias during the task, we first averaged across left and right cued trials separately, averaged across all conditions (i.e., regardless of VO). We then used paired t test on the derived reaction times (RT) and accuracy (ACC) (expressed as percentage of correct responses) measures for the left and right cued trials. Second, we divided trials according to VO pairings, averaging left and right cued trials, to determine whether behavioral performance varied as a function of saliency in both RT and ACC. We here used one-way repeated-measures ANOVA to assess whether group means in the three conditions significantly differ from each other. We also considered individual lateralized measures of RT and ACC across different VO conditions. To this end, behavioral asymmetries in performance (BA) for both measures were calculated according to the following formula:
 |
Where BART right and BART left represent mean reaction times for attend right and attend left trials, respectively. A positive BART for a given subject indicated faster responses when a participant was validly cued to the left compared with the right hemisphere, whereas negative values indicated the opposite pattern. Consequently, positive BAACC values indicated higher accuracy on attend right trials compared with left attend trials and vice versa.
A one-way repeated-measures ANOVA was used to test the difference across group means in the three VO conditions examined.
In a next step, we sought to investigate the possible association of behavioral performance with structural and functional hemispheric lateralization, we used Pearson's correlation to examine the association of individual asymmetries in accuracy (BAACC) and reaction times (BART) with individual HLM(α) and LV values of subcortical structures that showed significant correlation with HLM(α).
In a last step, we used a GLM to assess whether spatial biases in behavioral performance could be explained by a combination of the other variables, namely HLM(α) and the LV indices of the subcortical areas considered, according to the following formula:
 |
Results
We acquired structural and electrophysiological data from 25 participants. Participants' performance was tested during a covert attention paradigm, where Chinese symbols served as targets and distractors (Fig. 1). During a learning phase, before the actual task, the stimuli were associated with different values (positive, negative, or neutral). In the testing phase, a central cue probed an upcoming contrast variation of the target, which appeared either at 1450 or 2350 ms, predicting its position in 95% of the trials. Participants were instructed to indicate, with button press, the direction of the contrast change, which could either increase or decrease with equal probability. MEG data, eye-tracking and behavioral responses were acquired during the testing phase. Time–frequency representations of power were calculated from MEG trials after preprocessing and artifacts rejection. Power modulation (MI) indices were computed by contrasting power in trials where participants were validly cued to the right (attend right trials) with trials where participants were validly cued to the left (attend left trials) (Eq. 1, Materials and Methods).
As presented in the previously reported results (Marshall et al., 2018), we confirmed that participants displayed a clear modulation of alpha band activity in parieto-occipital sensors (MI(α): when covertly orienting attention to the cued side, alpha power decreased in the contralateral hemisphere while it increased relatively in the ipsilateral hemisphere (Fig. 2A). The magnitude of alpha power modulation, as reflected by MI(α), progressively increased until the target changed contrast (Fig. 2B). To best quantify the modulation, we focused our analysis on the 750 ms interval immediately preceding the onset of the contrast change. Next, right and left ROIs were identified as clusters of symmetric pairs of sensors showing the highest alpha lateralization values (see Materials and Methods) (i.e., sensors displaying highest interhemispheric difference in alpha modulation).
Starting from the assumption that, to a certain extent, an intersubject variability in the ability to modulate alpha power-in absolute value-must exist in the right compared with the left hemisphere (and vice versa), we sought to quantify individual hemispheric biases in the ability to modulate alpha activity. To this purpose, hemispheric lateralized modulation of alpha power [HLM(α) values were then computed for each participant by summing the average MI(α) in the right and left hemisphere ROIs (Eq. 2), Materials and Methods]. As a result of this computation, positive HLM(α) values would demonstrate that a given subject was better at modulating their right, compared with left, hemisphere alpha power, whereas a negative index would reflect higher ability to modulate alpha power on their left, compared with right, hemisphere. The histogram in Figure 2B depicts the distribution of hemispheric biases related to attentional modulation of alpha power. HLM(α) indices ranged from ∼−0.1 to 0.1 (i.e., a 20% variation) but they were normally distributed around zero across participants (Shapiro–Wilk, W = 0.958, p = 0.392).
Volumetric asymmetry of basal ganglia in relation to hemispheric lateralized alpha modulation
The next step was to determine whether the biases in the ability to modulate left versus right hemisphere alpha HLM(α) was related to individual hemispheric lateralization of subcortical structures. A semiautomated segmentation tool implemented in FMRIB's Software Library (FSL), was used to estimate volumes for the left and right subcortical and limbic structures, namely: GP, Acb, CN, Pu, Hpc, Am, and Th. We then calculated the hemispheric LVs for each set of structures (see Materials and Methods, Eq. 4). Positive (or negative) LVs values for a given participant indicated whether a specific substructure s was larger in the right compared with the left hemisphere (and vice versa). Further analysis revealed that, over subjects, the Acb and Th were significantly left lateralized (z = −3.78, p = 1.56 × 10⁻⁴ and z = −3.59, p = 3.28 × 10⁻⁴, respectively; two-sided Wilcoxon signed-rank test), whereas the CN was right lateralized (z = 2.97, p = 0.003). For the other substructures, no significant lateralizations were identified.
To corroborate that the observed anatomical lateralizations were representative of the population and not merely a fluke in the dataset, we applied the same analysis to a pool of 612 independent, anonymized anatomical MRI scans internally available at the Donders Institute. We hence estimated left and right volumes for the same subcortical structures considered in our study, and derived respective LV indices (Eq. 4). Importantly, the same direction of lateralization in all the substructures was found in the Donders dataset and the one reported in our sample. Specifically, Th and the Acb were significantly left lateralized (z = −14.0, p = 1.4 × 10−44 and z= −17.04, p = 4.1 × 10−65, respectively), whereas the CN was right lateralized (z = 13.0, p = 1.2 × 10−38). In addition, the GP was found to be right lateralized (z = 4.0, p = 5.9 × 10⁻⁵, an effect only observed as trend in our dataset), as well as the Hpc (z = 4.95, p = 7.3 × 10⁻⁷), whereas the Pu was left lateralized (z = −3.27, p = 0.001).
These surprising significant lateralization biases in a large dataset are highly interesting, given they suggest differential lateralizations of subcortical structures on a population level. Moreover, they support the conclusions drawn in the context of the study.
Given the volumetric variability in the set of substructures considered for the segmentation protocol, we performed a cross-correlation analysis between the different substructures, including left and right volumes, to query about a potential bias in the segmentation algorithm. No significant effects were found (positive or negative correlations, all p > 0.688; highest negative correlation r = −.084) indicating that, if a given structure is larger for a given subject, this does not imply a bias in the segmentation protocol (e.g., to the expense of neighboring, allegedly smaller areas).
To investigate whether individual subcortical asymmetries (LVs, as defined in Eq. 4) predicted differences in hemispheric lateralized modulation of alpha power HLM(α), we implemented a GLM, where LV indices were included as multiple explanatory variables for the response variable [individual HLM(α)].
As described in Materials and Methods section, we pursued a model building strategy that would enable us to test the key hypothesis concerning the role of the BG and the thalamus.
We analyzed all linear mixed-effects models derived from all possible combinations of at least 2 regressors (LV indices). Following this evaluation, we identified the five-regressor model as the best (with AIC= −71.23 and BIC = −62.70). This model included as regressors LVGP (p = 4 × 10⁻⁴), LVAcb,(p = 0.036) LVPu (p = 0.028), LVHpc (p = 0.144), and LVTh (p = 0.022).
The selected five-regressor model provided a better estimation of HLM(α) given the set of predictors, when compared with the full model (including all the seven substructures), which had AIC of −67.5 and BIC = −56.5 (Eq. 5).
Despite having defined the five regressors model as the optimal set for predicting HLM(α), we proceeded our analysis with the full model, describing the predictive value of the whole set of lateralized subcortical volumes. The underlying aim was to be more conservative, address potentially confounding effects of neighboring regions, and to include the full set of BG structures for a complete overview of their effects. We therefore report related results below. Of importance here is to note that, in the five-regressor winning model, based on the output of our model comparison, the results concerning our structures of interest still held: LVGP and LVTh significantly predicted HLM(α) values.
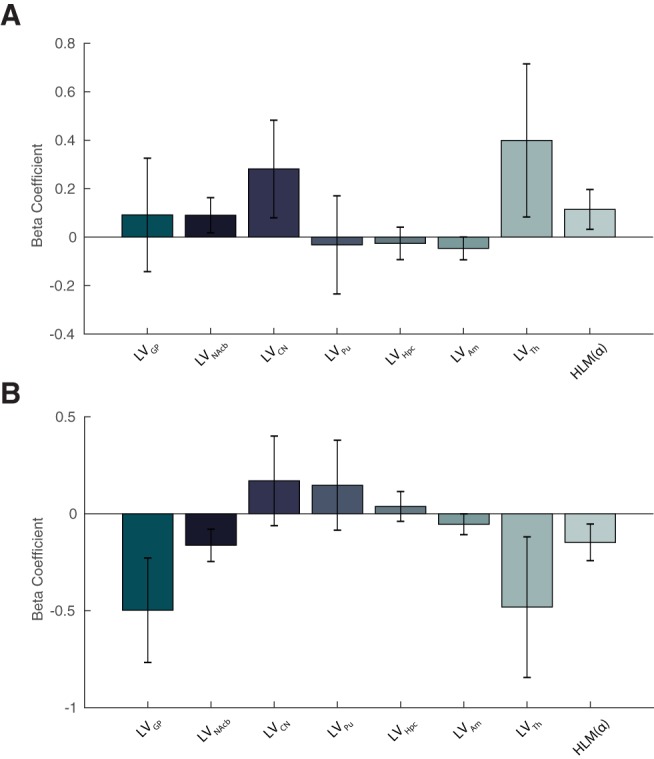
The full model was associated with a significant regression: when considering the grand average of all conditions, a linear combination of all the subcortical LVs was able to explain HLM(α) values (F(7,17) = 3.37, p = 0.019, adjusted R2 = 0.409). When assessing each predictor individually, only the beta coefficients for LVGP and LVTh were found to be significantly higher than zero (partial correlation: p = 0.004 and p = 0.028) (Fig. 4A). Hence, when controlling for the other explanatory variables in the model, only GP and TH asymmetry (LVGP, LVTH) significantly contributed to explain biases in hemispheric lateralized alpha band modulation (β = 1.768 and β = 1.924, respectively). The independent contribution of GP and TH lateralization is visible in Figure 4, B and C, showing the partial regression plots for LVGP and LVTH in relation to the HLM(α) values. We conclude that hemispheric biases in GP and TH volume are predictive of the individual abilities to modulate left versus right hemisphere alpha. Precisely, subjects presenting a larger GP volume in the left hemisphere compared with the right, also displayed a higher ability to modulate alpha power (in absolute value) in the left visual hemisphere compared with the right (and vice versa); the same association holding for the Th in relation to HLM(α) values.
Figure 4.

Lateralization of individual subcortical structures in relation to HLM in the task. A, Bar plot showing beta coefficients associated with a GLM where LV values were defined as explanatory variables for HLM(α). Error bars indicate SEM. Asterisks denote statistical significance; **p < 0.01. B, Partial regression plot showing the association between LVGP and HLM(α) while controlling for the other regressors in the model in A. C, Partial regression plot showing the association between LVTh and HLM(α) while controlling for the other regressors in the model in A. Given Equations 1 and 2 (see Materials and Methods), positive HLM(α) values indicate stronger modulation of alpha power in the right compared with the left hemisphere, and vice versa; similarly, positive (or negative) LVs indices denote greater right(or left) volume for a given substructure s. The dotted curves in B and C indicate 95% confidence bounds for the regression line fitted on the plot in black.
Hemispheric asymmetry of GP correlates selectively with power modulation in the alpha band
To better interpret the GLM results, we assessed whether the linear relationship arising from the model was restricted to the alpha band: to this end, a nonparametric approach was implemented to further explore the LVGP and LVTH in relation to HLM(α). This method allows circumvention of the multiple comparison problem over frequency and time points by evaluating the full low-frequency spectrum (2–30 Hz) from −1500 to 0 ms (Maris and Oostenveld, 2007). We therefore conducted a cluster-based permutation test using a dependent samples regression t-statistic to evaluate the effect (linear association between LVGP/TH indices and HLM over all frequencies) at the sample level. A p-value of 0.05 was chosen for thresholding the t-statistic of the permutation distribution and a critical value corresponding to alpha = 0.025 (two tailed) was considered for the cluster-level regression test statistic. As depicted in Figure 5A, we observed a significant cluster (p = 0.008) extending for 1000 ms window before contrast change (i.e., when covert attention was deployed to the cued stimulus), which confirmed a positive linear association (positive t-value) between LVGP asymmetry and HLM of power constrained to the alpha frequency range. When applying the same analysis to the Th asymmetry in relation to HLM, no significant clusters of sensors were identified.
Figure 5.

TFR of regression coefficient t-statistics on the linear relationship between low-frequency power modulation MI(f) and LVGP (A) and LVTh (B) indices averaged over ROIs (Fig. 2A). A black outline is used to highlight the significant time–frequency cluster found. For the LVGP, the analysis revealed a clear α-band-limited association between the variables across the full time window of interest (see Materials and Methods) extending up to 1 s before the response.
Hemisphere specific relations between alpha modulation and GP asymmetry
Given the specific association found between LVGP and HLM(α) arising from the previous analysis, we decided to further investigate the hemisphere-specific influence of GP volumetric asymmetry on alpha modulation indices. For this purpose, we sought to compare average left and right hemisphere MI(α)s of participants according to the direction of GP lateralization. This was done by means of median split of the LVGP distribution, hence resulting in two subgroups, that either had a bias toward a larger left than right GP volume or vice versa (see Materials and Methods). Figure 6 displays a topographical representation of MI(α) values per subgroup (Fig. 6A), together with individual raw data points, superimposed on bars representing average values per ROIs per each subgroup (Fig. 6B) and distribution of individual HLM(α) values (Fig. 6C). Consistent with the GLM results, participants with a larger right than left GP, also displayed a higher modulation of alpha band (in absolute value) in the right hemisphere compared with the left. Given that the assumption of normality required to perform a mixed-effect ANOVA, was not met for the distribution of MI(α) indices in the two subgroups, we implemented a nonparametric cluster-based permutation test to compare the MI(α) between the two aforementioned subgroups (averaged across specific time and frequency band of interest), using an independent sample t test score, and then comparing it with the resulting permutation distribution. This allowed us to explore whether there was a hemispheric-specific difference in the two subgroups in the extent of absolute alpha modulation. The test indicated a significant cluster of sensors over right posterior channels (p = 0.027), hence including the previously defined right ROI and denoting a significant difference in the right hemisphere absolute alpha modulation MI(α) between the two subgroups. These results might suggest that the linear association arising from the GLM (Fig. 4A,B) in relation to the association between LVGP and HLM(α), was largely driven by right hemisphere alpha modulation. The analogous analysis was conducted on the median split of the distribution of LVTH indices. In this case we did not find interhemispheric dominance in alpha modulation indices related to lateralization of the thalamus in the right compared with left hemisphere.
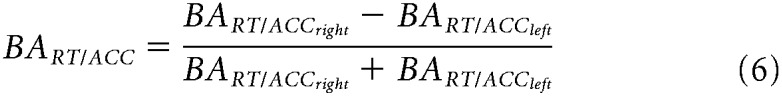
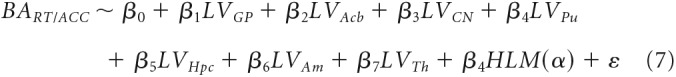
Figure 6.
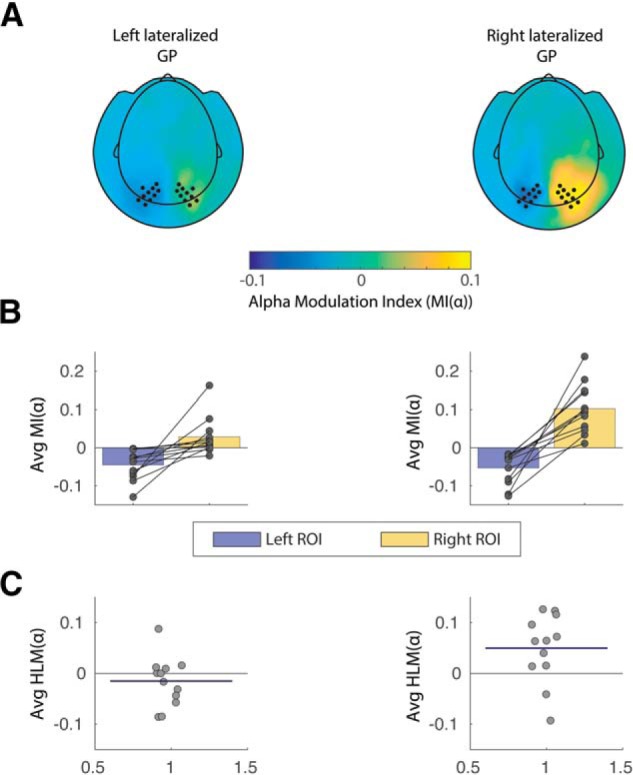
Alpha modulation indices for left and right hemispheres associated with two subgroups of the sample. A, Topographical plot of MI(α) values for the two participants groups, clustered according to directionality of GP lateralization (right vs left lateralized GP). Left and right sensors of interest are marked as dots and correspond to the same ROIs as in Figure 2. B, Individual data points superimposed on bar graph showing individual scores and MI(α) averaged over ROIs in the two subgroups. As indicated in the cluster-based permutation results, a difference is particularly observable for right hemisphere alpha modulation between the two groups, being higher in participants exhibiting a right lateralized GP. C, Individual data points showing HLM(α) scores for all participants. The horizontal blue line superimposed on the data indicates average HLM(α) index for each subgroup.
Involvement of GP and Th in relation to stimulus–value associations
Crucially, we aimed at assessing whether the level of VO in a given trial influenced the association between the structural and functional lateralization indices arisen from the GLM. We first calculated HLM(α) (Eq. 2, Materials and Methods) values for each participant separately for the three VO levels, namely two, one and zero value saliency occurrences (see Materials and Methods). We then examined Pearson correlations between HLM(α) and LV values for both GP and Th, which showed a positive significant β in the model, across the three levels considered (Figs. 7, 8). LVGP significantly correlated with HLM(α) only in trials where both target and distractors had value salience (two VO) (r = 0.68, p = 1.75 × 10⁻⁴; Fig. 7A). This denotes that, in trials with two value-salient items presented, participants exhibiting a right lateralized GP volume also displayed a stronger alpha modulation in the right compared with the left hemisphere and vice versa. LVGP did not significantly correlate with HLM(α) when only one or none of the stimuli presented were associated with a salient value (p = 0.144 and p = 0.314, respectively; Fig. 7A).
Figure 7.

Linear association between GP volumetric asymmetry and alpha modulation asymmetry as a function of value saliency occurrences in the task. A, Correlation between GP volume lateralization and HLM(α), grouped accordingly to the number of value-salient stimuli in the trials (see Materials and Methods). From left to right, respectively, two, one and zero value saliency occurrences are displayed. GP asymmetry significantly explained HLM(α) only when value-salient stimuli featured as both target and distractors, regardless of their valence (r = 0.68, significant at the p < 0.001 level after Bonferroni correction for three comparisons). B, The association between HLM(α) and GP volume lateralization increased as a function of value saliency in the task: the linear relationship was stronger when two value-salient stimuli were presented, when compared with conditions characterized by either one or value salience pairings, with a 95% CI of [0.106, 0.672] and [0.125, 0.897], respectively for the two comparisons. This suggests that, when both target and distractor were associated with a salient value, participants exhibiting bigger GP volume in the left hemisphere than in the right hemisphere were also better at modulating alpha oscillations in the left compared with the right hemisphere. Asterisks denote statistical significance; **p < 0.01. C, Raincloud plot (Allen et al., 2019) showing the bootstrap distribution of the difference in pairwise correlation coefficients examined.
Figure 8.

Linear association between Th volumetric asymmetry and alpha modulation asymmetry as a function of value saliency occurrences in the task. A, Correlation between TH volume lateralization and HLM(α), grouped accordingly to the number of value-salient stimuli in the trials (see Materials and Methods). From left to right, respectively, two, one and zero value saliency occurrences are displayed. When considering individual correlations between Th asymmetry and HLM(α), no significant linear relationship was found. B, Association between the two measures also did not significantly differ as a function of saliency in the trials. C, Raincloud plot showing the bootstrap distribution of the difference in pairwise correlation coefficients examined.
To statistically quantify the influence of the stimulus-value association on the relationship between LVGP and HLM(α), we compared robust correlations in the three conditions according to the bootstrap method described in (Wilcox, 2016c) for dependent overlapping correlations (see Materials and Methods). The correlation between LVGP and HLM(α) in trials with two occurrences of value salience, significantly differed both from the condition characterized by one (95% confidence interval, CI, [0.106, 0.672]) and zero (95% CI [0.125, 0.897]) occurrences. This confirmed that the association between lateralized GP volume and alpha modulation bias significantly increased as a function of the number of value-salient occurrences in the task (Fig. 7B). Bootstrap distributions of the pairwise difference in correlation coefficients is shown in Figure 7C. We performed the same analysis to assess whether value saliency occurrences mediated also the association between LVTH and HLM(α). When considering the correlation indices in the three conditions separately, no significant linear relationship was found between the two indices (Fig. 8A). Also in this case, when comparing robust correlations between the three conditions, according to the same method above, no significant difference was found (Fig. 8B,C). This suggested that the relationship between thalamus volumetric lateralization and alpha modulation arising from the model in Equation 5 was not driven by the number of value-salient occurrences in the task.
Behavioral analysis
Stronger alpha lateralization is associated with better behavioral performance in the task
At the behavioral level, we expected to corroborate existing literature linking alpha oscillations to behavioral performance in spatial attention tasks. To disentangle possible confounds derived from the value component of the task, we first considered only neutral trials (holding 0 V.O.). We then performed a trial-based analysis, by first grouping, for each subject, fast and slow trials, with respect to the reaction times distribution median. This was done separately for left-cued and right-cued (valid) trials. For each subject, we then computed alpha modulation indices MI(α) of derived fast and slow trials, according to Equation1 (see Materials and Methods). Next, we averaged MI(α)s in slow and fast trials across subjects. Figure 9A shows the topographical representation of MI(α) values for the two trial groups (fast vs slow trials). Figure 9B shows individual and mean values for MI(α) over left and right ROIs in the two subgroups, whereas values in Figure 9C are displayed individual and averaged LI(α)s per subgroup. To statistically assess the difference in alpha lateralization between the two subgroups, we compared LI(α)s (according to Eq. 3) between fast and slow trials, by means of dependent-samples t test. This revealed that, on average, subjects displayed a stronger alpha lateralization in fast trials, compared with slow trials (t(24) = 2.27, p = 0.032), when no saliency processing was required (0 VO trials).
Figure 9.
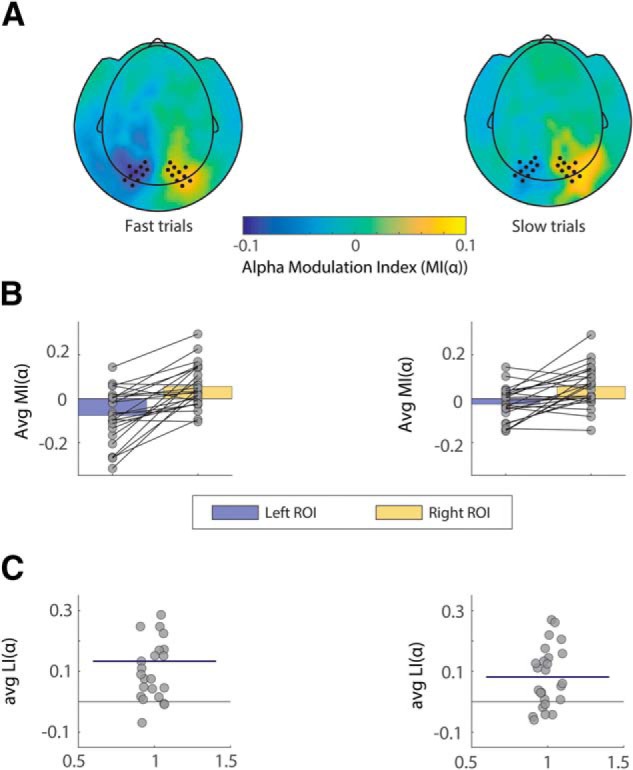
Alpha modulation indices for left and right hemispheres associated with fast versus slow trials, neutral condition only. A, Topographical plot of MI(α) values for the two trial groups, clustered according to median split of reaction times (fast versus slow trials). Left and right sensors of interest are marked as dots and correspond to the same ROIs as in Figure 2. B, Individual data points superimposed on bar graph showing individual scores and MI(α) averaged over ROIs in the two subgroups. C, Individual data points showing LI(α) scores for all participants (difference in MI(α) values between right and left ROIs above). The horizontal blue line superimposed on the data indicates average LI(α) index for each subgroup.
To be able to generalize the effect to the whole task, we performed the same trial-based analysis described above on all the conditions regardless of their VO levels. The analysis showed that, overall, subjects produced a significantly stronger alpha lateralization in fast trials, compared with slow trials, regardless of trial type (t(24) = 2.63, p = 0.014).
Behavioral performance is not dependent on saliency occurrences in the task
At the behavioral level, we sought to investigate whether subjects displayed a spatial bias in task performance, regardless of the value saliency levels. To this end we performed a paired t test to assess whether participants' performance differed between left and right cued trials, in both reaction times (RTs) and accuracy measures. No behavioral spatial bias was found either in RTs (p = 0.341) in accuracy (p = 0.572) values. Second, we investigated whether VO levels modulated participants' behavioral performance.
We then compared mean RT and accuracy for the three VO levels (see Materials and Methods). There were no statistically significant differences between the three groups, as determined by one-way ANOVA, in mean RT (F(2,72) = 0.004, p = 0.995) (Fig. 10A) or in mean accuracy (F(2,72)= 0.003, p = 0.996) (Fig. 10C). We then tested whether a behavioral spatial bias occurred across value saliency occurrences (i.e., whether subjects displayed a difference in RT or accuracy asymmetry across VOs). We computed measures of BAACC and BART (Eq. 6, Materials and Methods). Analogously to the method used to compute HLM(α), we created asymmetry indices for every subject by contrasting behavioral measures for attend right with attend left trials. As such, a positive BART would indicate that subjects were faster when cued to the left compared with the right hemisphere, and vice versa. Similarly, positive BAACC indices reflected higher accuracy when cued to the right compared with the left hemisphere. With the method aforementioned, we performed a one-way ANOVA to assess whether a significant difference in behavioral bias occurred across the three VO conditions. Neither BART nor BAACC values significantly differed across VOs (F(2,72) = 0.191, p = 0.826 and F(2,72) = 0.669, p = 0.515, respectively) (Fig. 10B,D).
Figure 10.
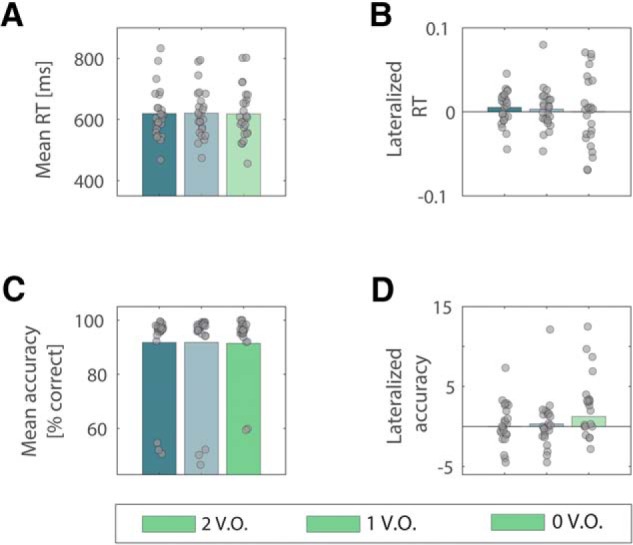
Mean and lateralized RTs and accuracy values across the three value saliency occurrences in the task. Mean RT (A) and accuracy (C) values averaged across participants in the three value-salient occurrences conditions in the task. No significant difference was found between groups by means of one-way repeated-measures ANOVA, indicating that different levels of value saliency pairings did not influence behavioral performance. No significant difference emerged also when comparing average lateralized values of RT (B) and accuracy (D) across the same conditions, and by means of same statistical analysis, indicating that the behavioral spatial bias was not affected by the different levels of value saliency pairings. Respective individual scores are superimposed on bars in all plots.
The resultant lack of a relationship between spatial bias in task performance and degree of saliency processing required (VOs) is likely explained by the orthogonalization of attentional orienting and stimulus-value associations in the task.
With the aim of determining a potential link between lateralized indices of behavioral performance and the anatomical (LVs) and functional HLM(α) lateralization indices of interest, we used three separate GLMs to assess whether a linear combination of BART and BAACC values could explain LVGP, LVTH and/or HLM(α) indices. Neither LVGP nor LVTH could be explained by the behavioral lateralized measures (F(1,23) = 0.18, p = 0.834, adjusted R2 = −.07 and F(1,23) = 0.16, p = 0.849, adjusted R2 = −.07). The same result held for the prediction of HLM(α), yielding also in this case no significant regression coefficients (F(1,23) = 1.17, p = 0.33, adjusted R2 = −.01).
Last, we investigated whether individual behavioral spatial biases could be accounted for by a combination of the other measures examined. To this end, we considered all subcortical LVs and HLM(α) indices and specified them as regressors in a general linear model (Eq. 7, Materials and Methods), to determine whether they could explain biases in RT and accuracy (BART and BAACC). No significant regression was found that could account for BART indices (F(8,16) = 0.85, p = 0.570, adjusted R2 = −0.05) nor for BAACC indices (F(8,16) = 1.07, p = 0.429, adjusted R2 = −.023, respectively; Fig. 11A,B).
Figure 11.
GLM displaying combined lateralized subcortical volumes and hemispheric lateralized modulation as multiple regressors for the prediction of spatial behavioral bias in RT (A) and accuracy (B). No significant regression was found that could account for either the lateralized accuracy or RTs (p = 0.429 and p = 0.570, respectively).
Discussion
The aim of this study was to investigate the involvement of subcortical structures in modulating spatial attention to stimuli associated with contextual salience. We observed that volumetric lateralization of subcortical areas explained individual differences in the ability to modulate interhemispheric alpha power. Specifically, participants exhibiting a right lateralized GP also had a better ability to modulate posterior alpha oscillations in the right compared with left hemisphere and vice versa. The same association held for the relationship between Th hemispheric asymmetry and alpha modulation. Importantly, only the correlation between GP and alpha hemispheric lateralized modulation increased as a function of value saliency occurrences in the task. To the best of our knowledge, this is the first finding relating individual volumetric differences in BG and thalamus to the modulation of posterior alpha oscillations.
Subcortical areas and alpha synchronization
Our first finding is consistent with a growing body of literature demonstrating a subcortical involvement in high level cognitive functions, such as conscious perception (Slagter et al., 2017), working memory performance (Frank et al., 2001), cognitive control (O'Reilly et al., 2010; Ceaser and Barch, 2015; Piray et al., 2016), and attentional control (Yantis et al., 2012; Tommasi et al., 2015b). We showed that volumetric asymmetry of subcortical areas predicts individual biases in the ability to efficiently allocate attention, as indexed by interhemispheric modulation of alpha power. This is strong support in favor of a subcortical involvement in attentional processing, given the well established role of alpha oscillations in the allocation of spatial visuospatial attention (Jensen and Mazaheri, 2010). Consistent with the functional association between BG and cognitive control in the context of reward (Fallon and Cools, 2014; Fallon et al., 2017), we provide novel insights into the involvement of subcortical regions in the modulation of posterior alpha oscillations.
Pulsed inhibition
A well recognized function of the BG is to inhibit or promote cortical activity via GABAergic signaling, through the globus pallidus pars interna (GPi), one of its major output structures (Lanciego et al., 2012; Goldberg et al., 2013). The BG might exercise its influence by applying control over activity in the prefrontal cortex or it might directly coordinate posterior regions (as reflected by its relationship to alpha power modulation during reward processing). Our results suggest that individual differences in GP volume lateralization may correspond to interhemispheric variability in GABAergic signaling and thus reflect the subcortical potential to inhibit cortex. This input is likely responsible for producing the mechanisms of “pulsed inhibition” in the visual cortex (Jensen and Mazaheri, 2010), reflected by interhemispheric modulation of alpha power, allowing the selective processing of stimuli.
Implicitly, we assumed that the volume of the GP indirectly reflects its ability to exert its top-down control over posterior areas, its size possibly representing a determinant for the number of GABAergic neurons involved in the control mechanism.
GP in relation to attentional selection and cognitive control
Interestingly, our results emphasize the specific contribution of the GP in supporting stimulus-driven allocation of attention in a value-based context. The GPi is considered to mediate the output of the BG (Lanciego et al., 2012; Goldberg et al., 2013), and previous literature has implicated this structure in voluntary movement regulation: its functions have indeed been predominantly investigated in clinical and animal models in association with motor functions and action control (Filion and Tremblay, 1991; Jahfari et al., 2011), describing, for instance, reduction of hypokinetic and rigidity symptoms following pallidotomy in humans (Schuurman et al., 1997; Dostrovsky et al., 2002). Nevertheless, recent results from single unit recordings in humans provided indications that electrophysiological activity in the GPi reflects processing of stimuli associated with different reward contingencies (Howell et al., 2016). This is corroborated by evidence of alterations of cognitive, in addition to motor, abilities, following pallidotomy in Parkinson's disease (PD) patients (Lombardi et al., 2000); In addition, electrical stimulation of the GPi to treat PD has been reported to be associated with several cognitive impairments, such as subtle declines in attention and concentration, although to a lesser extent when compared with subthalamic stimulation (Combs et al., 2015). This aspect has been further addressed in clinical studies showing a link between PD, associated with abnormal pallidal activity (Dostrovsky et al., 2002; Rosenberg-Katz et al., 2016), and altered reward processing as well as updating (Aarts et al., 2012; Chong et al., 2015). Structural GP abnormalities have also been linked to impaired suppression of distractors in ADHD (Aylward et al., 1996; Qiu et al., 2009) and psychotic symptoms in schizophrenia (Hokama et al., 1995; Spinks et al., 2005; Mamah et al., 2007), which has been related to aberrant salience attribution and reward learning (Early et al., 1987; Okada et al., 2016). As an important output component of the reward circuit (Haber, 2011), the GPi might serve to indirectly influence the cortical information flow by biasing selective processing of value-related stimuli. Our data expands on this notion by suggesting a further pallidal influence on the modulation of visual alpha oscillations. Importantly, given that the association between LVGP and HLM(α) increases as a function of the saliency, we here postulate a specific role for the GP in value-related shifts of attention. Conversely, it is still unclear to what extent this modulation is dependent on value-related stimuli rather than covert visual attention: additional studies would be valuable to further disentangle the role of these two features and generalize the findings.
Right lateralization of the association between GP and alpha modulation
Notably, the association between GP lateralization and interhemispheric alpha power (Fig. 6) was largely related to right hemisphere differences in absolute alpha modulation between subjects exhibiting a right, compared with left, lateralized GP volume. This finding possibly reflects the right hemisphere dominance allegedly characterizing spatial attention processes (Shulman et al., 2010), corroborated by the right lateralized feature of the ventral attentional network, which has been described as specifically involved in the processing of behaviorally salient stimuli (Corbetta and Shulman, 2002).
Differential role of GP and Th in relation to posterior alpha modulation
Our results show that GP and Th lateralizations were related to the interhemispheric bias in alpha modulation during selective allocation of attention. However, only GP lateralization was related to the value saliency pairings in the task. The different contribution from GP and Th in relation to saliency occurrences might likely reflect different roles of the two areas in the top-down control of attentional processing. The GP provides a modulatory signal related to the processing of stimuli that draw attention due to their strong saliency associations. The perceptual competition resulting from attending to a salient target while required to suppress an equally salient distractor, might be resolved by a network involving the GP. Increased midbrain activity has indeed been shown to accompany attentional suppression of a highly rewarding distractor carrying a strong perceptual competition with the target (Gong et al., 2017), suggesting that dopaminergic networks might flexibly modulate attentional selection in reward-related contexts.
With regard to thalamic regulation of interhemispheric alpha power, it is important to mention that our interpretation is limited by the current pragmatic difficulty in reliably disentangling different thalamic nuclei's volume, by means of the automatic segmentation algorithm. By considering the full thalamic volume, one is subject to intrinsic confounds derived from the fact that thalamic nuclei might exert differential modulatory effects on cortical activity. It is not to be excluded that a saliency specific processing might still occur within specific nuclei in the structure.
In our sample, the correlation between thalamic lateralization and attention-related alpha modulation was regardless of the saliency component in the current task. Despite the considerations above, our interpretation of the findings builds upon previous extensive evidence describing how thalamic activity, particularly arising from its largest nucleus, the pulvinar, modulates the alpha rhythm in extended visual areas (Lopes da Silva et al., 1980; Wilke et al., 2009; Saalmann et al., 2012; Zhou et al., 2016; Green et al., 2017). The pulvinar was first shown to contribute to the generation of the posterior alpha rhythm in dogs (Lopes da Silva et al., 1980) and also to regulate synchronized activity between visual cortical areas to support the allocation of attention in human and nonhuman primates (Petersen et al., 1987; Kastner et al., 2004; Saalmann et al., 2012; Green et al., 2017). Our findings, therefore, add to the growing body of evidence suggesting that thalamo-cortical interactions play a fundamental role in shaping cognitive processing (Saalmann and Kastner, 2011; Leszczyński and Staudigl, 2016; Sherman, 2016; Green et al., 2017; Halassa and Kastner, 2017; Fiebelkorn and Kastner, 2019).
Pallido-cortical pathways
Through which route does the GP influence visual alpha oscillations? A possibility is that the GP modulates prefrontal activity, which in turn engages and affects dorsal attentional networks (Cummings, 1993; Pauls et al., 2014). The dorsal attention network, with the intraparietal sulcus (IPS) and frontal eye fields (FEFs) as its major hubs, has been suggested to mediate top-down allocation of attention. Both the IPS and FEFs have been indeed causally implicated in the control over posterior alpha oscillations in relation to attentional shifts (Corbetta and Shulman, 2002; Capotosto et al., 2012; Ptak, 2012; Vossel et al., 2014; Marshall et al., 2015a). Based on our results, we propose the existence of a network that allows salience driven signals from the BG to influence the prefrontal cortex in biasing the competition among posterior regions. The idea of a BG-cortico loop involved in stimulus driven reorienting of attention has been already introduced (Alexander et al., 1986; Shulman et al., 2009) and is consistent with the notion of a salience network, which integrates behaviorally relevant input to bias and guide cognitive control (Seeley et al., 2007; Metzger et al., 2010; Chen et al., 2015; Peters et al., 2016). Within this framework, the BG, through their main output via the GPi, are thought to influence the connectivity between frontoparietal regions by updating goal-directed behavior, to adapt to changes in the environment (van Schouwenburg et al., 2010b).
The influence of GP on posterior alpha oscillations could further be mediated through indirect projections via the thalamus. The major target of GPi projections is the motor thalamus, including ventrolateral and ventral anterior thalamic nuclei, which innervates motor and premotor cortex (Herrero et al., 2002; Sommer, 2003; Goldberg et al., 2013). However, cortical projections from thalamic nuclei receiving input from the BG might be more diverse and target also prefrontal areas (McFarland and Haber, 2002), which would enable an indirect modulation of frontoparietal networks by the GPi via the thalamus. Additionally, intrathalamic connectivity (Crabtree et al., 1998; Crabtree and Isaac, 2002) as well as complex interactions between the thalamic reticular nucleus and thalamic nuclei (Guillery et al., 1998; Halassa and Acsády, 2016) may provide multiple alternative pathways to convey influence of the GPi on cortical areas and modulate behavior (Haber and Calzavara, 2009).
The proposed models provide a theoretical framework in favor of a flexible subcortical modulation of top-down regulation of attentional allocation, which for the GP appears to be specifically involved in tasks involving value saliency processing. Nevertheless, the aforementioned possible modulatory routes should not be considered as mutually exclusive: a more comprehensive model of attentional control should instead account for multiple cortical and subcortical pathways operating in parallel, which would allow optimization of the organism's interaction with the environment.
Data availability
The preprocessed MEG and MRI anonymized datasets that support the findings of this study are available as downloadable online data collection in the Donders Data Repository (https://data.donders.ru.nl) with persistent identifier 11633/di.dccn.DSC_3016045.01_337 upon reasonable request to the corresponding author.
Footnotes
This work was supported by the Netherlands Organisation for Scientific Research (NWO, VICI Grants 453-09-002 and 453-14-015) and the James S. McDonnell Foundation (Grants 220020328 and 220020448). S.J.F. was supported by the National Institute for Health Research (NIHR) Biomedical Research Centre at University Hospitals Bristol National Health Service (NHS) Foundation Trust and the University of Bristol. O.J. was further supported by the Wellcome Trust Investigator Award in Science (grant number 207550) and the Royal Society Wolfson Research Merit Award ' and T.S. was supported by the European Research Council (https://erc.europa.eu/, Starting Grant 802681). We thank Sebastiaan den Boer for help with the data collection process and experimental design. The views expressed in this publication are those of the author(s) and not necessarily those of the NHS, the NIHR, or the Department of Health and Social Care.
The authors declare no competing financial interests.
References
- Aarts E, Helmich RC, Janssen MJ, Oyen WJ, Bloem BR, Cools R (2012) Aberrant reward processing in Parkinson's disease is associated with dopamine cell loss. Neuroimage 59:3339–3346. 10.1016/j.neuroimage.2011.11.073 [DOI] [PubMed] [Google Scholar]
- Alexander GE, DeLong MR, Strick PL (1986) Parallel organization of functionally segregated circuits linking basal ganglia and cortex. Annu Rev Neurosci 9:357–381. 10.1146/annurev.ne.09.030186.002041 [DOI] [PubMed] [Google Scholar]
- Allen M, Poggiali D, Whitaker K, Marshall TR, Kievit RA (2019) Raincloud plots: a multi-platform tool for robust data visualization. Wellcome Open Res 4:63. 10.12688/wellcomeopenres.15191.1 [DOI] [PMC free article] [PubMed] [Google Scholar]
- Arcizet F, Krauzlis RJ (2018) Covert spatial selection in primate basal ganglia. PLoS Biol 16:e2005930. 10.1371/journal.pbio.2005930 [DOI] [PMC free article] [PubMed] [Google Scholar]
- Aylward EH, Reiss AL, Reader MJ, Singer HS, Brown JE, Denckla MB (1996) Basal ganglia volumes in children with attention-deficit hyperactivity disorder. J Child Neurol 11:112–115. 10.1177/088307389601100210 [DOI] [PubMed] [Google Scholar]
- Bastiaansen MC, Knösche TR (2000) Tangential derivative mapping of axial MEG applied to event-related desynchronization research. Clin Neurophysiol 111:1300–1305. 10.1016/S1388-2457(00)00272-8 [DOI] [PubMed] [Google Scholar]
- Bischoff-Grethe A, Ozyurt IB, Busa E, Quinn BT, Fennema-Notestine C, Clark CP, Morris S, Bondi MW, Jernigan TL, Dale AM, Brown GG, Fischl B (2007) A technique for the deidentification of structural brain MR images. Hum Brain Mapp 28:892–903. 10.1002/hbm.20312 [DOI] [PMC free article] [PubMed] [Google Scholar]
- Braunlich K, Seger C (2013) The basal ganglia. Wiley Interdiscip Rev Cogn Sci 4:135–148. 10.1002/wcs.1217 [DOI] [PubMed] [Google Scholar]
- Capotosto P, Corbetta M, Romani GL, Babiloni C (2012) Electrophysiological correlates of stimulus-driven reorienting deficits after interference with right parietal cortex during a spatial attention task: a TMS-EEG study. J Cogn Neurosci 24:2363–2371. 10.1162/jocn_a_00287 [DOI] [PMC free article] [PubMed] [Google Scholar]
- Ceaser AE, Barch DM (2015) Striatal activity is associated with deficits of cognitive control and aberrant salience for patients with schizophrenia. Front Hum Neurosci 9:687. 10.3389/fnhum.2015.00687 [DOI] [PMC free article] [PubMed] [Google Scholar]
- Chelazzi L, Perlato A, Santandrea E, Della Libera C (2013) Rewards teach visual selective attention. Vision Res 85:58–72. 10.1016/j.visres.2012.12.005 [DOI] [PubMed] [Google Scholar]
- Chen MC, Ferrari L, Sacchet MD, Foland-Ross LC, Qiu MH, Gotlib IH, Fuller PM, Arrigoni E, Lu J (2015) Identification of a direct GABAergic pallidocortical pathway in rodents. Eur J Neurosci 41:748–759. 10.1111/ejn.12822 [DOI] [PMC free article] [PubMed] [Google Scholar]
- Chong TT, Bonnelle V, Manohar S, Veromann KR, Muhammed K, Tofaris GK, Hu M, Husain M (2015) Dopamine enhances willingness to exert effort for reward in Parkinson's disease. Cortex 69:40–46. 10.1016/j.cortex.2015.04.003 [DOI] [PMC free article] [PubMed] [Google Scholar]
- Combs HL, Folley BS, Berry DT, Segerstrom SC, Han DY, Anderson-Mooney AJ, Walls BD, van Horne C (2015) Cognition and depression following deep brain stimulation of the subthalamic nucleus and globus pallidus pars internus in Parkinson's disease: a meta-analysis. Neuropsychol Rev 25:439–454. 10.1007/s11065-015-9302-0 [DOI] [PubMed] [Google Scholar]
- Corbetta M, Shulman GL (2002) Control of goal-directed and stimulus-driven attention in the brain. Nat Rev Neurosci 3:201–215. 10.1038/nrn755 [DOI] [PubMed] [Google Scholar]
- Crabtree JW, Isaac JT (2002) New intrathalamic pathways allowing modality-related and cross-modality switching in the dorsal thalamus. J Neurosci 22:8754–8761. 10.1523/JNEUROSCI.22-19-08754.2002 [DOI] [PMC free article] [PubMed] [Google Scholar]
- Crabtree JW, Collingridge GL, Isaac JT (1998) A new intrathalamic pathway linking modality-related nuclei in the dorsal thalamus. Nat Neurosci 1:389–394. 10.1038/1603 [DOI] [PubMed] [Google Scholar]
- Cummings JL. (1993) Frontal-subcortical circuits and human behavior. Arch Neurol 50:873–880. 10.1001/archneur.1993.00540080076020 [DOI] [PubMed] [Google Scholar]
- Dostrovsky JO, Hutchison WD, Lozano AM (2002) The globus pallidus, deep brain stimulation, and Parkinson's disease. Neuroscientist 8:284–290. 10.1177/1073858402008003014 [DOI] [PubMed] [Google Scholar]
- Early TS, Reiman EM, Raichle ME, Spitznagel EL (1987) Left globus pallidus abnormality in never-medicated patients with schizophrenia. Proc Natl Acad Sci U S A 84:561–563. 10.1073/pnas.84.2.561 [DOI] [PMC free article] [PubMed] [Google Scholar]
- Fallon SJ, Cools R (2014) Reward acts on the pFC to enhance distractor resistance of working memory representations. J Cogn Neurosci 26:2812–2826. 10.1162/jocn_a_00676 [DOI] [PubMed] [Google Scholar]
- Fallon SJ, Zokaei N, Norbury A, Manohar SG, Husain M (2017) Dopamine alters the fidelity of working memory representations according to attentional demands. J Cogn Neurosci 29:728–738. 10.1162/jocn_a_01073 [DOI] [PMC free article] [PubMed] [Google Scholar]
- Fiebelkorn IC, Kastner S (2019) The puzzling pulvinar. Neuron 101:201–203. 10.1016/j.neuron.2018.12.032 [DOI] [PMC free article] [PubMed] [Google Scholar]
- Fiebelkorn IC, Pinsk MA, Kastner S (2019) The mediodorsal pulvinar coordinates the macaque fronto-parietal network during rhythmic spatial attention. Nat Commun 10:215. 10.1038/s41467-018-08151-4 [DOI] [PMC free article] [PubMed] [Google Scholar]
- Filion M, Tremblay L (1991) Abnormal spontaneous activity of globus pallidus neurons in monkeys with MPTP-induced parkinsonism. Brain Res 547:142–151. 10.1016/0006-8993(91)90585-J [DOI] [PubMed] [Google Scholar]
- Frank MJ, Loughry B, O'Reilly RC (2001) Interactions between frontal cortex and basal ganglia in working memory: a computational model. Cogn Affect Behav Neurosci 1:137–160. 10.3758/CABN.1.2.137 [DOI] [PubMed] [Google Scholar]
- Goldberg JH, Farries MA, Fee MS (2013) Basal ganglia output to the thalamus: still a paradox. Trends Neurosci 36:695–705. 10.1016/j.tins.2013.09.001 [DOI] [PMC free article] [PubMed] [Google Scholar]
- Gong M, Jia K, Li S (2017) Perceptual competition promotes suppression of reward salience in behavioral selection and neural representation. J Neurosci 37:6242–6252. 10.1523/JNEUROSCI.0217-17.2017 [DOI] [PMC free article] [PubMed] [Google Scholar]
- Green JJ, Boehler CN, Roberts KC, Chen LC, Krebs RM, Song AW, Woldorff MG (2017) Cortical and subcortical coordination of visual spatial attention revealed by simultaneous EEG–fMRI recording. J Neurosci 37:7803–7810. 10.1523/JNEUROSCI.0326-17.2017 [DOI] [PMC free article] [PubMed] [Google Scholar]
- Guadalupe T, Mathias SR, vanErp TGM, Whelan CD, Zwiers MP, Abe Y, Abramovic L, Agartz I, Andreassen OA, Arias-Vásquez A, Aribisala BS, Armstrong NJ, Arolt V, Artiges E, Ayesa-Arriola R, Baboyan VG, Banaschewski T, Barker G, Bastin ME, Baune BT, et al. (2017) Human subcortical brain asymmetries in 15,847 people worldwide reveal effects of age and sex. Brain Imaging Behav 11:1497–1514. [DOI] [PMC free article] [PubMed] [Google Scholar]
- Guillery RW, Feig SL, Lozsádi DA, Lozsadi DA, Lozsádi DA (1998) Paying attention to the thalamic reticular nucleus. Trends Neurosci 21:28–32. 10.1016/S0166-2236(97)01157-0 [DOI] [PubMed] [Google Scholar]
- Haber S. (2011) Neuroanatomy of reward: a view from the ventral striatum. In: Neurobiology of sensation and reward (Gottfried HA, ed), pp 235–262. Boca Raton, FL: CRC. [PubMed] [Google Scholar]
- Haber SN, Calzavara R (2009) The cortico-basal ganglia integrative network: the role of the thalamus. Brain Res Bull 78:69–74. 10.1016/j.brainresbull.2008.09.013 [DOI] [PMC free article] [PubMed] [Google Scholar]
- Halassa MM, Acsády L (2016) Thalamic inhibition: diverse sources, Diverse Scales. Trends Neurosci 39:680–693. 10.1016/j.tins.2016.08.001 [DOI] [PMC free article] [PubMed] [Google Scholar]
- Halassa MM, Kastner S (2017) Thalamic functions in distributed cognitive control. Nat Neurosci 20:1669–1679. 10.1038/s41593-017-0020-1 [DOI] [PubMed] [Google Scholar]
- Halgren M, Devinsky O, Doyle WK, Bastuji H, Rey M, Mak-McCully R, Chauvel P, Ulbert I, Fabó D, Erőss L, Wittner L, Heit G, Eskandar E, Mandell A, Cash SS (2017) The generation and propagation of the human alpha rhythm. Available from: at https://www.biorxiv.org/content/10.1101/202564v2. [DOI] [PMC free article] [PubMed]
- Herrero MT, Barcia C, Navarro JM (2002) Functional anatomy of thalamus and basal ganglia. Childs Nerv Syst 18:386–404. 10.1007/s00381-002-0604-1 [DOI] [PubMed] [Google Scholar]
- Hikosaka O, Bromberg-Martin E, Hong S, Matsumoto M (2008) New insights on the subcortical representation of reward. Curr Opin Neurobiol 18:203–208. 10.1016/j.conb.2008.07.002 [DOI] [PMC free article] [PubMed] [Google Scholar]
- Hikosaka O, Kim HF, Yasuda M, Yamamoto S (2014) Basal ganglia circuits for reward value-guided behavior. Annu Rev Neurosci 37:289–306. 10.1146/annurev-neuro-071013-013924 [DOI] [PMC free article] [PubMed] [Google Scholar]
- Hokama H, Shenton ME, Nestor PG, Kikinis R, Levitt JJ, Metcalf D, Wible CG, O'Donnell BF, Jolesz FA, McCarley RW (1995) Caudate, putamen, and globus pallidus volume in schizophrenia: a quantitative MRI study. Psychiatry Res 61:209–229. 10.1016/0925-4927(95)02729-H [DOI] [PubMed] [Google Scholar]
- Howell NA, Prescott IA, Lozano AM, Hodaie M, Voon V, Hutchison WD (2016) Preliminary evidence for human globus pallidus pars interna neurons signaling reward and sensory stimuli. Neuroscience 328:30–39. 10.1016/j.neuroscience.2016.04.020 [DOI] [PMC free article] [PubMed] [Google Scholar]
- Jahfari S, Waldorp L, van den Wildenberg WP, Scholte HS, Ridderinkhof KR, Forstmann BU (2011) Effective connectivity reveals important roles for both the hyperdirect (fronto-subthalamic) and the indirect (fronto-striatal-pallidal) fronto-basal ganglia pathways during response inhibition. J Neurosci 31:6891–6899. 10.1523/JNEUROSCI.5253-10.2011 [DOI] [PMC free article] [PubMed] [Google Scholar]
- Jaramillo J, Mejias JF, Wang XJ (2019) Engagement of pulvino-cortical feedforward and feedback pathways in cognitive computations. Neuron 101:321–336.e9. 10.1016/j.neuron.2018.11.023 [DOI] [PMC free article] [PubMed] [Google Scholar]
- Jensen O, Mazaheri A (2010) Shaping functional architecture by oscillatory alpha activity: gating by inhibition. Front Hum Neurosci 4:186. 10.3389/fnhum.2010.00186 [DOI] [PMC free article] [PubMed] [Google Scholar]
- Kastner S, O'Connor DH, Fukui MM, Fehd HM, Herwig U, Pinsk MA (2004) Functional imaging of the human lateral geniculate nucleus and pulvinar. J Neurophysiol 91:438–448. 10.1152/jn.00553.2003 [DOI] [PubMed] [Google Scholar]
- Kelly SP, Lalor EC, Reilly RB, Foxe JJ (2006) Increases in alpha oscillatory power reflect an active retinotopic mechanism for distracter suppression during sustained visuospatial attention. J Neurophysiol 95:3844–3851. 10.1152/jn.01234.2005 [DOI] [PubMed] [Google Scholar]
- Lanciego JL, Luquin N, Obeso JA (2012) Functional neuroanatomy of the basal ganglia. Cold Spring Harb Perspect Med 2:a009621. 10.1101/cshperspect.a009621 [DOI] [PMC free article] [PubMed] [Google Scholar]
- Lauwereyns J, Takikawa Y, Kawagoe R, Kobayashi S, Koizumi M, Coe B, Sakagami M, Hikosaka O (2002) Feature-based anticipation of cues that predict reward in monkey caudate nucleus. Neuron 33:463–473. 10.1016/S0896-6273(02)00571-8 [DOI] [PubMed] [Google Scholar]
- Leszczyński M, Staudigl T (2016) Memory-guided attention in the anterior thalamus. Neurosci Biobehav Rev 66:163–165. 10.1016/j.neubiorev.2016.04.015 [DOI] [PubMed] [Google Scholar]
- Lombardi WJ, Gross RE, Trepanier LL, Lang AE, Lozano AM, Saint-Cyr JA (2000) Relationship of lesion location to cognitive outcome following microelectrode-guided pallidotomy for Parkinson's disease: support for the existence of cognitive circuits in the human pallidum. Brain 123:746–758. 10.1093/brain/123.4.746 [DOI] [PubMed] [Google Scholar]
- Lopes da Silva FH, Vos JE, Mooibroek J, Van Rotterdam A (1980) Relative contributions of intracortical and thalamo-cortical processes in the generation of alpha rhythms, revealed by partial coherence analysis. Electroencephalogr Clin Neurophysiol 50:449–456. 10.1016/0013-4694(80)90011-5 [DOI] [PubMed] [Google Scholar]
- Mamah D, Wang L, Barch D, de Erausquin GA, Gado M, Csernansky JG (2007) Structural analysis of the basal ganglia in schizophrenia. Schizophr Res 89:59–71. 10.1016/j.schres.2006.08.031 [DOI] [PMC free article] [PubMed] [Google Scholar]
- Maris E, Oostenveld R (2007) Nonparametric statistical testing of EEG- and MEG-data. J Neurosci Methods 164:177–190. 10.1016/j.jneumeth.2007.03.024 [DOI] [PubMed] [Google Scholar]
- Marshall TR, Bergmann TO, Jensen O (2015a) Frontoparietal structural connectivity mediates the top-down control of neuronal synchronization associated with selective attention. PLoS Biol 13:e1002272. 10.1371/journal.pbio.1002272 [DOI] [PMC free article] [PubMed] [Google Scholar]
- Marshall TR, O'Shea J, Jensen O, Bergmann TO (2015b) Frontal eye fields control attentional modulation of alpha and gamma oscillations in contralateral occipitoparietal cortex. J Neurosci 35:1638–1647. 10.1523/JNEUROSCI.3116-14.2015 [DOI] [PMC free article] [PubMed] [Google Scholar]
- Marshall TR, den Boer S, Cools R, Jensen O, Fallon SJ, Zumer JM (2018) Occipital alpha and gamma oscillations support complementary mechanisms for processing stimulus value associations. J Cogn Neurosci 30:119–129. 10.1162/jocn_a_01185 [DOI] [PubMed] [Google Scholar]
- McFarland NR, Haber SN (2002) Thalamic relay nuclei of the basal ganglia form both reciprocal and nonreciprocal cortical connections, linking multiple frontal cortical areas. J Neurosci 22:8117–8132. 10.1523/JNEUROSCI.22-18-08117.2002 [DOI] [PMC free article] [PubMed] [Google Scholar]
- Metzger CD, Eckert U, Steiner J, Sartorius A, Buchmann JE, Stadler J, Tempelmann C, Speck O, Bogerts B, Abler B, Walter M (2010) High field fMRI reveals thalamocortical integration of segregated cognitive and emotional processing in mediodorsal and intralaminar thalamic nuclei. Front Neuroanat 4:138. 10.3389/fnana.2010.00138 [DOI] [PMC free article] [PubMed] [Google Scholar]
- Nobre K, Kastner S (2014) The Oxford handbook of attention. Oxford: OUP. [Google Scholar]
- Okada N, Fukunaga M, Yamashita F, Koshiyama D, Yamamori H, Ohi K, Yasuda Y, Fujimoto M, Watanabe Y, Yahata N, Nemoto K, Hibar DP, van Erp TG, Fujino H, Isobe M, Isomura S, Natsubori T, Narita H, Hashimoto N, Miyata J, Koike S, et al. (2016) Abnormal asymmetries in subcortical brain volume in schizophrenia. Mol Psychiatry 21:1460–1466. 10.1038/mp.2015.209 [DOI] [PMC free article] [PubMed] [Google Scholar]
- Oostenveld R, Fries P, Maris E, Schoffelen JM (2011) FieldTrip: Open source software for advanced analysis of MEG, EEG, and invasive electrophysiological data. Comput Intell Neurosci 2011:156869. 10.1155/2011/156869 [DOI] [PMC free article] [PubMed] [Google Scholar]
- O'Reilly RC, Herd SA, Pauli WM (2010) Computational models of cognitive control. Curr Opin Neurobiol 20:257–261. 10.1016/j.conb.2010.01.008 [DOI] [PMC free article] [PubMed] [Google Scholar]
- Paton JJ, Belova MA, Morrison SE, Salzman CD (2006) The primate amygdala represents the positive and negative value of visual stimuli during learning. Nature 439:865–870. 10.1038/nature04490 [DOI] [PMC free article] [PubMed] [Google Scholar]
- Pauls DL, Abramovitch A, Rauch SL, Geller DA (2014) Obsessive-compulsive disorder: an integrative genetic and neurobiological perspective. Nat Rev Neurosci 15:410–424. 10.1038/nrn3746 [DOI] [PubMed] [Google Scholar]
- Peters SK, Dunlop K, Downar J (2016) Cortico-striatal-thalamic loop circuits of the salience network: a central pathway in psychiatric disease and treatment. Front Syst Neurosci 10:104. 10.3389/fnsys.2016.00104 [DOI] [PMC free article] [PubMed] [Google Scholar]
- Petersen SE, Robinson DL, Morris JD (1987) Contributions of the pulvinar to visual spatial attention. Neuropsychologia 25:97–105. 10.1016/0028-3932(87)90046-7 [DOI] [PubMed] [Google Scholar]
- Piray P, Toni I, Cools R (2016) Human choice strategy varies with anatomical projections from ventromedial prefrontal cortex to medial striatum. J Neurosci 36:2857–2867. 10.1523/JNEUROSCI.2033-15.2016 [DOI] [PMC free article] [PubMed] [Google Scholar]
- Ptak R. (2012) The frontoparietal attention network of the human brain. Neuroscientist 18:502–515. 10.1177/1073858411409051 [DOI] [PubMed] [Google Scholar]
- Qiu A, Crocetti D, Adler M, Mahone EM, Denckla MB, Miller MI, Mostofsky SH (2009) Basal ganglia volume and shape in children with attention deficit hyperactivity disorder. Am J Psychiatry 166:74–82. 10.1176/appi.ajp.2008.08030426 [DOI] [PMC free article] [PubMed] [Google Scholar]
- Rosenberg-Katz K, Herman T, Jacob Y, Kliper E, Giladi N, Hausdorff JM (2016) Subcortical volumes differ in Parkinson's disease motor subtypes: new insights into the pathophysiology of disparate symptoms. Front Hum Neurosci 10:356. 10.3389/fnhum.2016.00356 [DOI] [PMC free article] [PubMed] [Google Scholar]
- Saalmann YB, Kastner S (2011) Cognitive and perceptual functions of the visual thalamus. Neuron 71:209–223. 10.1016/j.neuron.2011.06.027 [DOI] [PMC free article] [PubMed] [Google Scholar]
- Saalmann YB, Pinsk MA, Wang L, Li X, Kastner S (2012) The pulvinar regulates information transmission between cortical areas based on attention demands. Science 337:753–756. 10.1126/science.1223082 [DOI] [PMC free article] [PubMed] [Google Scholar]
- Schechtman E, Noblejas MI, Mizrahi AD, Dauber O, Bergman H (2016) Pallidal spiking activity reflects learning dynamics and predicts performance. Proc Natl Acad Sci U S A 113:E6281–E6289. 10.1073/pnas.1612392113 [DOI] [PMC free article] [PubMed] [Google Scholar]
- Schultz W, Tremblay L, Hollerman JR (2000) Reward processing in primate orbitofrontal cortex and basal ganglia. Cereb Cortex 10:272–284. 10.1093/cercor/10.3.272 [DOI] [PubMed] [Google Scholar]
- Schuurman PR, de Bie RMA, Speelman JD, Bosch DA (1997) Posteroventral pallidotomy in movement disorders. In: Advances in Stereotactic and Functional Neurosurgery 12: Proceedings of the 12th Meeting of the European Society for Stereotactic and Functional Neurosurgery, Milan 1996 (Ostertag CB, Thomas DGT, Bosch A, Linderoth B, Broggi G, eds), pp 14–17. Vienna: Springer. [Google Scholar]
- Seeley WW, Menon V, Schatzberg AF, Keller J, Glover GH, Kenna H, Reiss AL, Greicius MD (2007) Dissociable intrinsic connectivity networks for salience processing and executive control. J Neurosci 27:2349–2356. 10.1523/JNEUROSCI.5587-06.2007 [DOI] [PMC free article] [PubMed] [Google Scholar]
- Sherman SM. (2016) Thalamus plays a central role in ongoing cortical functioning. Nat Neurosci 19:533–541. 10.1038/nn.4269 [DOI] [PubMed] [Google Scholar]
- Shipp S. (2004) The brain circuitry of attention. Trends Cogn Sci 8:223–230. 10.1016/j.tics.2004.03.004 [DOI] [PubMed] [Google Scholar]
- Shulman GL, Astafiev SV, Franke D, Pope DL, Snyder AZ, McAvoy MP, Corbetta M (2009) Interaction of stimulus-driven reorienting and expectation in ventral and dorsal fronto-parietal and basal ganglia-cortical networks. J Neurosci 29:4392–4407. 10.1523/JNEUROSCI.5609-08.2009 [DOI] [PMC free article] [PubMed] [Google Scholar]
- Shulman GL, Pope DL, Astafiev SV, McAvoy MP, Snyder AZ, Corbetta M (2010) Right hemisphere dominance during spatial selective attention and target detection occurs outside the dorsal frontoparietal network. J Neurosci 30:3640–3651. 10.1523/JNEUROSCI.4085-09.2010 [DOI] [PMC free article] [PubMed] [Google Scholar]
- Slagter HA, Mazaheri A, Reteig LC, Smolders R, Figee M, Mantione M, Schuurman PR, Denys D (2017) Contributions of the ventral striatum to conscious perception: an intracranial EEG study of the attentional blink. J Neurosci 37:1081–1089. 10.1523/JNEUROSCI.2282-16.2016 [DOI] [PMC free article] [PubMed] [Google Scholar]
- Sommer MA. (2003) The role of the thalamus in motor control. Curr Opin Neurobiol 13:663–670. 10.1016/j.conb.2003.10.014 [DOI] [PubMed] [Google Scholar]
- Spinks R, Nopoulos P, Ward J, Fuller R, Magnotta VA, Andreasen NC (2005) Globus pallidus volume is related to symptom severity in neuroleptic naive patients with schizophrenia. Schizophr Res 73:229–233. 10.1016/j.schres.2004.05.020 [DOI] [PubMed] [Google Scholar]
- Stolk A, Todorovic A, Schoffelen JM, Oostenveld R (2013) Online and offline tools for head movement compensation in MEG. Neuroimage 68:39–48. 10.1016/j.neuroimage.2012.11.047 [DOI] [PubMed] [Google Scholar]
- Thut G, Nietzel A, Brandt SA, Pascual-Leone A (2006) -band electroencephalographic activity over occipital cortex indexes visuospatial attention bias and predicts visual target detection. J Neurosci 26:9494–9502. 10.1523/JNEUROSCI.0875-06.2006 [DOI] [PMC free article] [PubMed] [Google Scholar]
- Tomer R, Goldstein RZ, Wang GJ, Wong C, Volkow ND (2008) Incentive motivation is associated with striatal dopamine asymmetry. Biol Psychol 77:98–101. 10.1016/j.biopsycho.2007.08.001 [DOI] [PMC free article] [PubMed] [Google Scholar]
- Tomer R, Slagter HA, Christian BT, Fox AS, King CR, Murali D, Davidson RJ (2013) Dopamine asymmetries predict orienting bias in healthy individuals. Cereb Cortex 23:2899–2904. 10.1093/cercor/bhs277 [DOI] [PMC free article] [PubMed] [Google Scholar]
- Tommasi G, Fiorio M, Yelnik J, Krack P, Sala F, Schmitt E, Fraix V, Bertolasi L, Le Bas JF, Ricciardi GK, Fiaschi A, Theeuwes J, Pollak P, Chelazzi L (2015a) Disentangling the role of cortico-basal ganglia loops in top-down and bottom-up visual attention: an investigation of attention deficits in parkinson disease. J Cogn Neurosci 27:1215–1237. 10.1162/jocn_a_00770 [DOI] [PubMed] [Google Scholar]
- Tommasi G, Fiorio M, Yelnik J, Krack P, Sala F, Schmitt E, Fraix V, Bertolasi L, Le Bas JF, Ricciardi GK, Fiaschi A, Theeuwes J, Pollak P, Chelazzi L (2015b) Disentangling the role of cortico-basal ganglia loops in top-down and bottom-up visual attention: an investigation of attention deficits in Parkinson disease. J Cogn Neurosci 27:1215–1237. 10.1162/jocn_a_00770 [DOI] [PubMed] [Google Scholar]
- Tremblay L, Hollerman JR, Schultz W (1998) Modifications of reward expectation-related neuronal activity during learning in primate striatum. J Neurophysiol 80:964–977. 10.1152/jn.1998.80.2.964 [DOI] [PubMed] [Google Scholar]
- van Schouwenburg M, Aarts E, Cools R (2010a) Dopaminergic modulation of cognitive control: distinct roles for the prefrontal cortex and the basal ganglia. Curr Pharm Des 16:2026–2032. 10.2174/138161210791293097 [DOI] [PubMed] [Google Scholar]
- van Schouwenburg MR, den Ouden HE, Cools R (2010b) The human basal ganglia modulate frontal-posterior connectivity during attention shifting. J Neurosci 30:9910–9918. 10.1523/JNEUROSCI.1111-10.2010 [DOI] [PMC free article] [PubMed] [Google Scholar]
- van Schouwenburg MR, den Ouden HE, Cools R (2015) Selective attentional enhancement and inhibition of fronto-posterior connectivity by the basal ganglia during attention switching. Cereb Cortex 25:1527–1534. 10.1093/cercor/bht345 [DOI] [PubMed] [Google Scholar]
- Vossel S, Geng JJ, Fink GR (2014) Dorsal and ventral attention systems. Neuroscientist 20:150–159. 10.1177/1073858413494269 [DOI] [PMC free article] [PubMed] [Google Scholar]
- Wilcox RR. (2016a) Comparing dependent robust correlations. Br J Math Stat Psychol 69:215–224. 10.1111/bmsp.12069 [DOI] [PubMed] [Google Scholar]
- Wilcox RR. (2016b) Introduction to robust estimation and hypothesis testing. San Diego: Academic. [Google Scholar]
- Wilcox RR. (2016c) Comparing dependent robust correlations. Br J Math Stat Psychol 69:215–224. 10.1111/bmsp.12069 [DOI] [PubMed] [Google Scholar]
- Wilke M, Mueller KM, Leopold DA (2009) Neural activity in the visual thalamus reflects perceptual suppression. Proc Natl Acad Sci U S A 106:9465–9470. 10.1073/pnas.0900714106 [DOI] [PMC free article] [PubMed] [Google Scholar]
- Womer FY, Wang L, Alpert KI, Smith MJ, Csernansky JG, Barch DM, Mamah D (2014) Basal ganglia and thalamic morphology in schizophrenia and bipolar disorder. Psychiatry Res 223:75–83. 10.1016/j.pscychresns.2014.05.017 [DOI] [PMC free article] [PubMed] [Google Scholar]
- Worden MS, Foxe JJ, Wang N, Simpson GV (2000) Anticipatory biasing of visuospatial attention indexed by retinotopically specific alpha-band electroencephalography increases over occipital cortex. J Neurosci 20:RC63. 10.1523/JNEUROSCI.20-06-j0002.2000 [DOI] [PMC free article] [PubMed] [Google Scholar]
- Yantis S, Anderson BA, Wampler EK, Laurent PA (2012) Reward and attentional control in visual search. Nebr Symp Motiv 59:91–116. [DOI] [PMC free article] [PubMed] [Google Scholar]
- Zheng J, Anderson KL, Leal SL, Shestyuk A, Gulsen G, Mnatsakanyan L, Vadera S, Hsu FP, Yassa MA, Knight RT, Lin JJ (2017) Amygdala-hippocampal dynamics during salient information processing. Nat Commun 8:14413. 10.1038/ncomms14413 [DOI] [PMC free article] [PubMed] [Google Scholar]
- Zhou H, Schafer RJ, Desimone R (2016) Pulvinar-cortex interactions in vision and attention. Neuron 89:209–220. 10.1016/j.neuron.2015.11.034 [DOI] [PMC free article] [PubMed] [Google Scholar]
Associated Data
This section collects any data citations, data availability statements, or supplementary materials included in this article.
Data Availability Statement
The preprocessed MEG and MRI anonymized datasets that support the findings of this study are available as downloadable online data collection in the Donders Data Repository (https://data.donders.ru.nl) with persistent identifier 11633/di.dccn.DSC_3016045.01_337 upon reasonable request to the corresponding author.