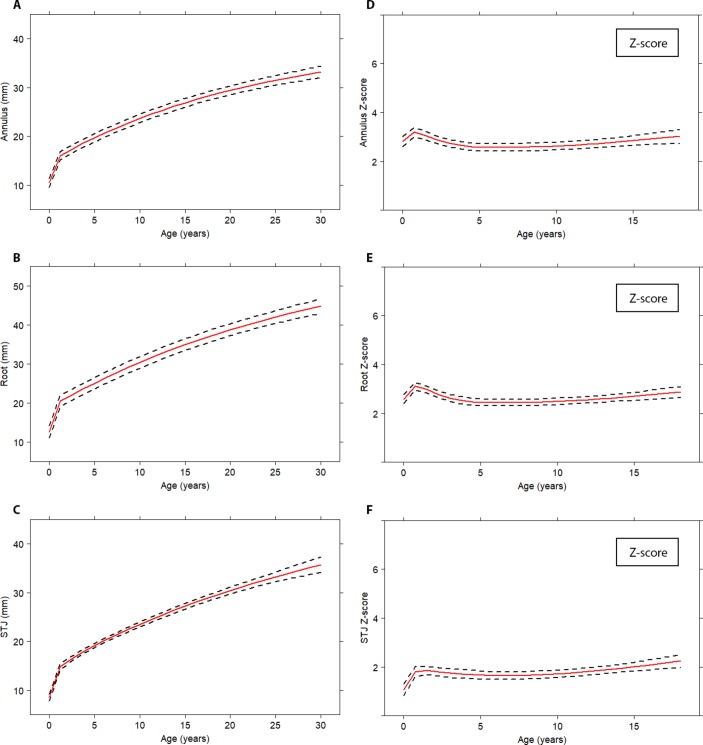
Figure 2.
Mean progression of neo-aortic dimensions over time for all patients with TGA. Absolute neo-aortic diameters (A–C); neo-aortic Z-scores (D–F). Mean profiles are plotted with the described risk factors set to the reference level; dashed lines represent 95% CI. STJ, sinotubular junction; TGA, transposition of the great arteries.

