Abstract
Cation-chloride cotransporters (CCCs) mediate the electroneutral transport of chloride, potassium, and/or sodium across the membrane. They play critical roles in regulating cell volume, controlling ion absorption and secretion across epithelia, and maintaining intracellular chloride homeostasis. These transporters are the primary targets for some of the most commonly prescribed drugs. Here, we determined the cryo-EM structure of a Na-K-Cl cotransporter NKCC1, an extensively-studied member of the CCCs. The structure defines the architecture of this protein family and reveals how cytosolic and transmembrane domains are strategically positioned for communication. Structural analyses, functional characterizations, and computational studies uncover the ion-translocation pathway, ion-binding sites, and key residues for transport activity. These results provide insights into ion selectivity, coupling, and translocation, and establish a framework for understanding the physiological functions of CCCs and interpreting disease-related mutations.
Cation-chloride cotransporters mediate coupled movement of chloride with potassium and/or sodium across the membrane and are critical for maintaining K+, Na+, and Cl− homeostasis1–4. CCCs play important roles in physiological processes, from regulating volume and blood pressure to modulating hearing and neuronal excitability1,4,5. This family can be divided into two main clades1–3,6: Clade I is Na+ dependent and includes the Na+-K+-Cl− cotransporters NKCC1 and NKCC2, and the Na+-Cl− cotransporter NCC. Clade II is Na+ independent and includes the K+-Cl− cotransporters KCC1–42,6. Malfunction or dysregulation results in disorders including hypertension, fluid overload, and kidney filtration problems1. Mutations cause Gitelman syndrome, Bartter syndrome and Andermann syndrome1.
Many widely prescribed medications target Na+-dependent CCCs7. Thiazide diuretics, the preferred first-line pharmacological therapy for hypertension, inhibit NCC8. Furosemide, bumetanide, and other loop diuretics commonly prescribed for acute edema target NKCC9. Despite CCCs’ clinical use as major drug targets for decades, the molecular mechanisms underlying ion transport and drug inhibition remain unclear.
CCCs consist of a transmembrane domain (TMD) containing the ion translocation pathway, and cytosolic N- and C-terminal domains (NTDs; CTDs) that regulate transport and trafficking10,11. CCCs mediate electroneutral movement of co-transported ions. Intriguingly, a common structural scaffold gives rise to diverse stoichiometries for different family members: 1Na+:1K+:2Cl− for NKCCs, 1Na+:1Cl− for NCC, and 1K+:1Cl− for KCC1. Substrate specificity and coupling stoichiometry are central to interpreting CCCs’ physiological functions. Major advances in physiological, biochemical, biophysical, genetic, and cellular studies have laid a foundation towards understanding their function and malfunction10,12,13. However, fundamental questions remain, including ion selectivity, transport coupling, and cytosolic regulation.
Here, we report the cryo-electron microscopy (cryo-EM) structure of a vertebrate NKCC1. The structure, together with functional studies and molecular dynamics (MD) simulations, defines the architecture of this family of transporters and gives insight into its regulation and mechanisms of ion translocation.
Structure determination
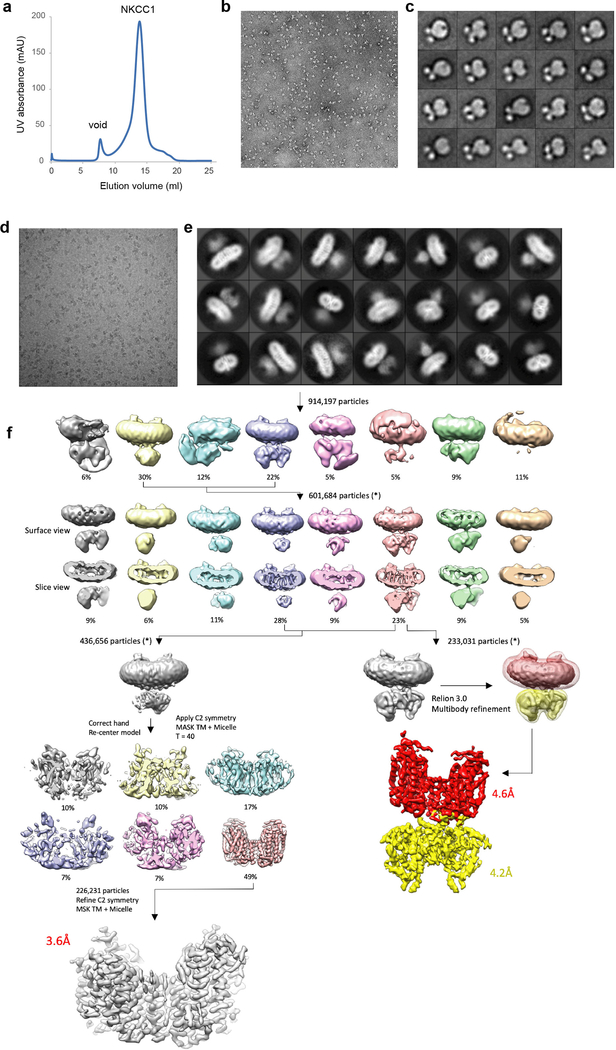
We focused on the Na+-dependent NKCC1, an extensively studied CCC2,14. NKCC1 plays important roles in regulating volume, intracellular Cl− concentration, and trans-epithelia salt secretion1,2. Moreover, NKCC1 is a promising neurological drug target, given its importance in GABAergic signaling15. We determined that zebrafish NKCC1 (zNKCC1) showed desirable properties for structural studies (Extended Data Fig. 1a-c).
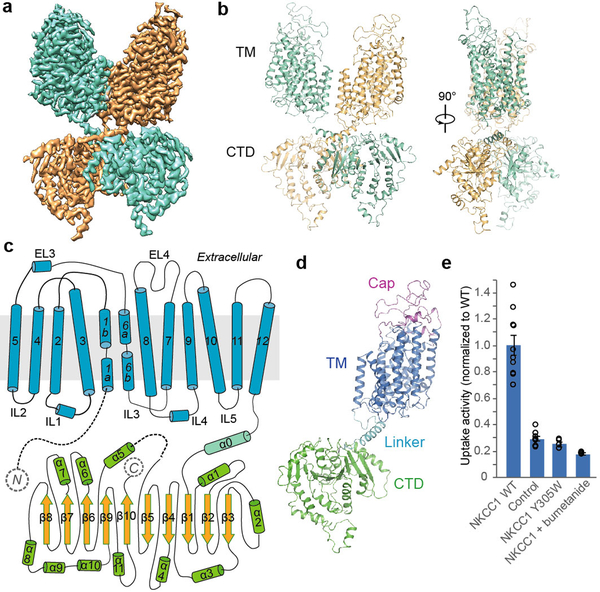
zNKCC1 and human NKCC1 (hNKCC1) sequences share 71% identity and 87% similarity (Supplementary Fig. 1). Similar to mouse NKCC1, loss of function of zNKCC1 leads to endolymph collapse16,17. Cells overexpressing wild-type zNKCC1 showed robust Rb+ (a classic K+ congener) influx (Fig. 1e). Influx was minimized by substituting an equivalent residue critical for hNKCC1 activity18 or addition of the classic NKCC inhibitor bumetanide. Thus, zNKCC1 recapitulates key characteristics of hNKCCs.
Figure 1 |. Overall structure and functional characterization of NKCC1.
a, Full-length NKCC1 density map coloured by protomer. b, Overall structure of NKCC1 dimer. Ribbon representations viewed at two angles. c, Topology diagram. d, Ribbon representation of NKCC1 protomer, coloured by structural element. e, Uptake activities of zNKCC1. The activity was normalized to WT (mean±s.e.m., n=4 independent experiments except for WT and control, n=10 independent experiments).
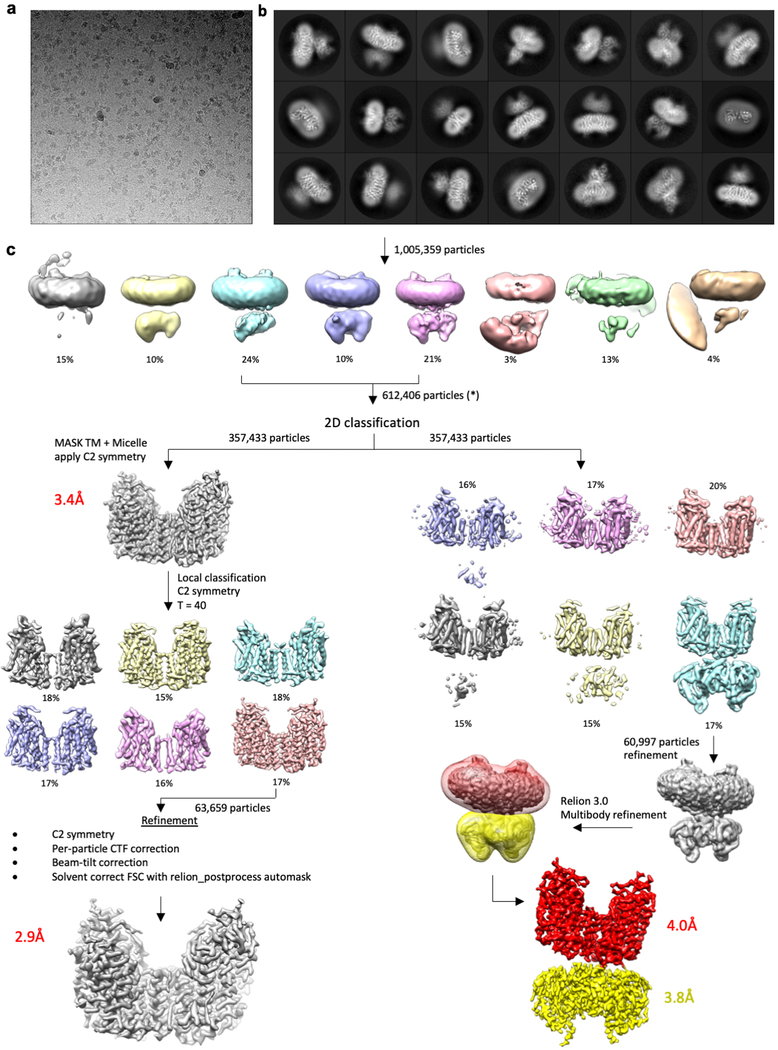
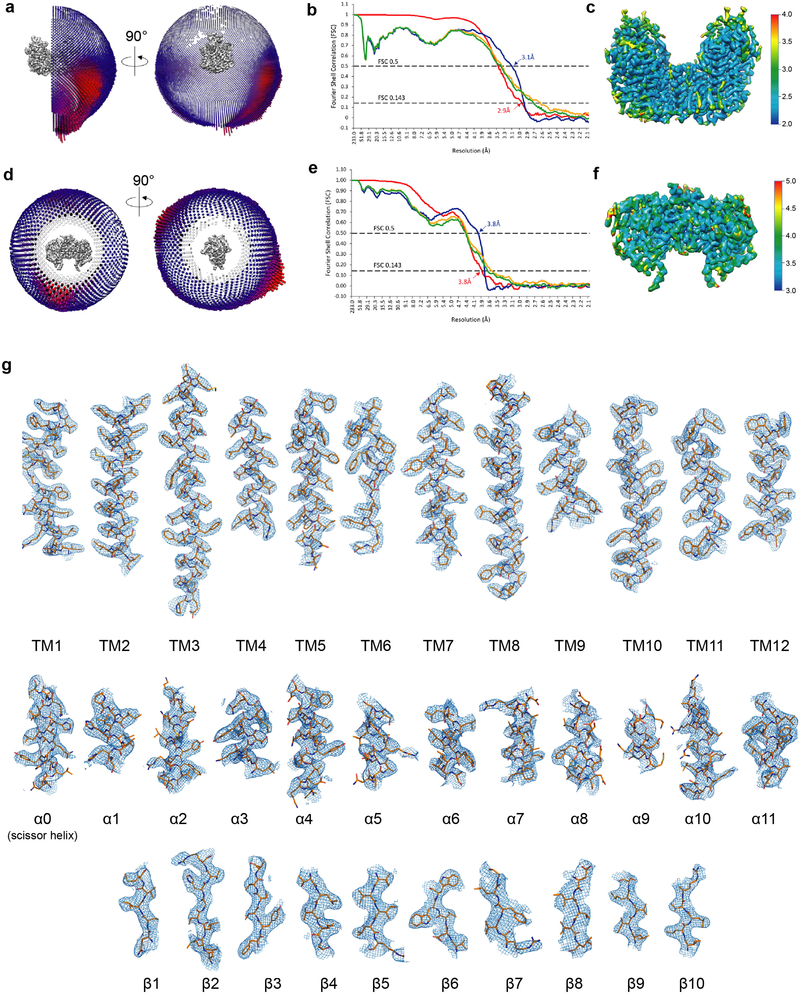
Cryo-EM analyses of full-length and NTD-truncated zNKCC1 generated similar three-dimensional (3D) reconstructions with well-resolved TMD and CTD (Extended Data Fig. 1, 2). Full-length NKCC1 yielded a higher-resolution map, and is therefore the focus of the text below. To overcome substantial CTD conformational flexibility (Extended Data Fig. 2), we utilized multi-body refinement, producing EM maps with clear side-chain densities for unambiguous model building (Extended Data Fig. 3). TMD-focused image processing produced a 2.9 Å-resolution map, revealing several ion-binding sites, discussed below.
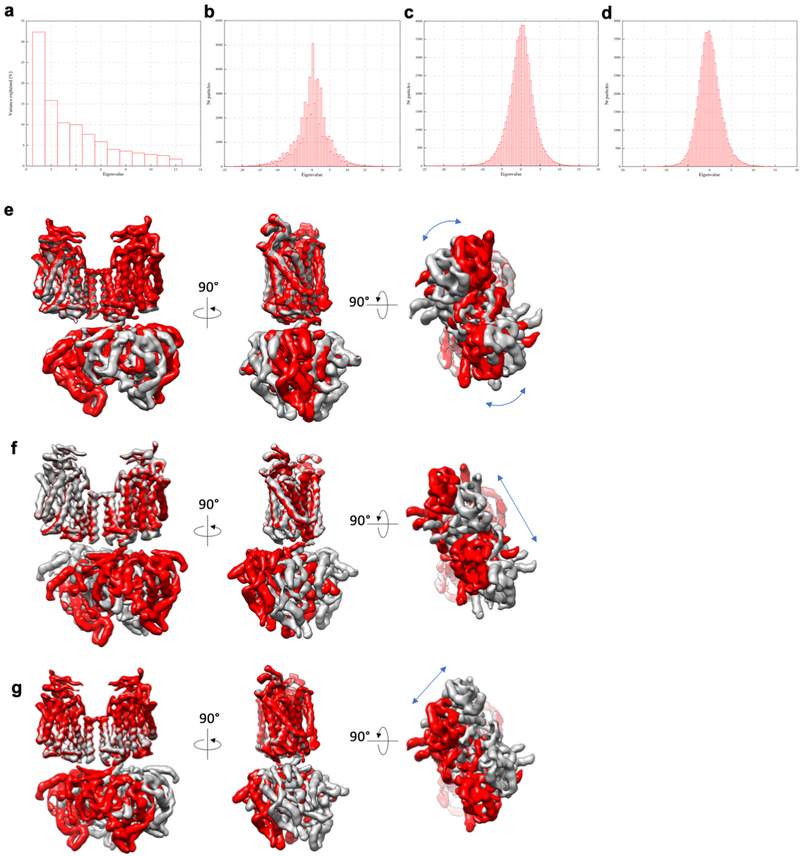
Our cryo-EM structures reveal a dimeric assembly of NKCC1, consistent with previous crosslinking and FRET studies19,20. The twofold axis of the TMDs is perpendicular to the membrane surface while that of the CTDs is tilted by ~11 degrees. The CTD of one subunit is close to the TMD of the opposing subunit, showing a domain-swap configuration. Multi-body analysis revealed several modes of motion between TMD and CTD (Extended Data Fig. 4), including swivelling and rocking (Supplementary Videos 1, 2, 3).
Transmembrane domain
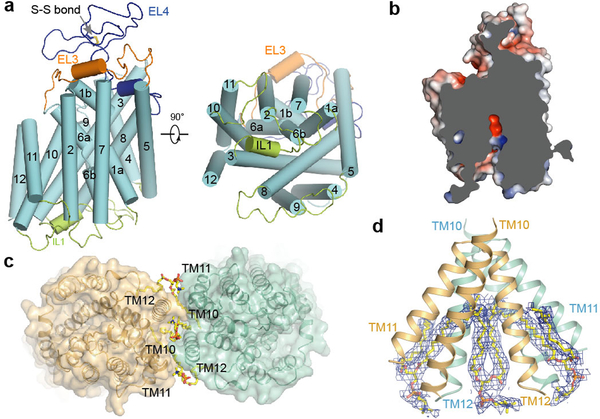
The TMD adopts an APC superfamily fold, with an inverted repeat architecture formed by TM1-TM5 and TM6-TM1012,21 (Fig. 1c). NKCC1 shares limited structural similarity with other transporter families beyond the basic protein fold. Its top-ranked hit (DALI comparison) is a distant bacterial amino acid transporter, GkApcT (Cα RMSD=3.2 Å for 399 out of 1136 residues, 15% sequence identity). NKCC1 has two substantial extracellular elements: an extensive ordered loop between TM7 and TM8 (EL4) stabilized by a conserved disulfide bond and a structured element between TM5 and TM6 (EL3). These elements form a cap domain, shielding the extracellular surface of the TMD (Fig. 1d, 2a). The cap domain is important for surface expression and transport regulation in hNKCC122.
Figure 2 |. TM domain and dimer interface.
a, TM domain structure in one subunit, viewed from membrane (left) or intracellular side (right). b, Slab view of one TM domain showing partially inward-open conformation. Surface coloured by electrostatic potential (red, −5 kT e−1; blue, +5 kT e−1). c, Lipids and dimer of TMDs, viewed from intracellular side. d, Ordered lipid molecules at dimer interface. Densities attributed to lipids shown as blue meshes.
Two TMDs interact through an interface formed by TM11, TM12, and the TM10 C-terminal end (Fig. 2c, d), consistent with bioinformatic predictions18. However, the TMD dimer interface shows only modest shape complementarity in the membrane near the cytoplasm. Three lipids in the inner membrane leaflet were observed at the dimer interface (Fig. 2c, d). One lipid inserts both tails into a central cavity, while the other two lipids each have one acyl tail wedged into the side cavity, acting like molecular glue to fill gaps and bridge interactions between the two TMDs. These observations provide direct evidence of interfacial lipids, previously proposed to play important roles in membrane protein oligomerization and association23.
Cytosolic domains and TMD-CTD interface
The NTD has variable length and limited sequence conservation24,25. In the 3D reconstruction of full-length NKCC1, the NTD lacked discernible density, indicating disordered structure or conformational flexibility. The NTD apparently does not make stable direct contacts with the TMD or CTDs. The TMD and CTD adopt similar conformations as the NTD-truncated protein. The structural basis of the NTD’s role in NKCC1 activation awaits future investigation.
Large, conserved CTDs are characteristic of CCCs. The CTD plays key roles in protein folding, membrane trafficking, quaternary structure maintenance, and transport regulation26–28. NKCC1 activation is accompanied by large CTD movements; in KCC, CTD phosphorylation results in de-activation28,29.
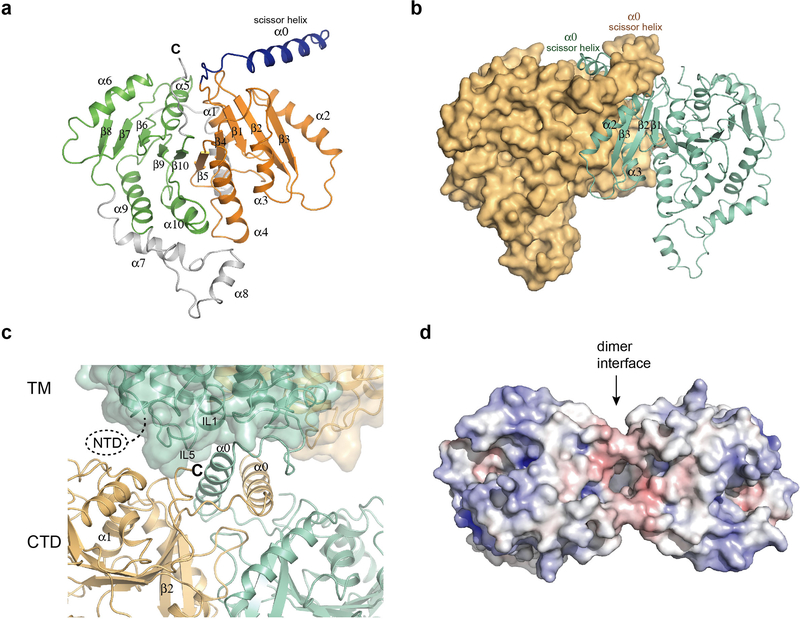
The CTD core adopts a mixed α/β fold with two structurally related subdomains (Extended Data Fig. 5a). Despite limited sequence conservation (identity <12%), each CTD of NKCC1 resembles that of MaCCC (prokaryotic CCC transporter)30. Compared with MaCCC, the NKCC1 CTD contains several large loops and additional helices, significantly increasing surface area for potential interactions.
The two CTDs within the NKCC1 dimer directly interact (Extended Data Fig. 5b), consistent with the CTD affecting dimerization26,28. Cross-protomer interactions are mainly mediated by helix α3, its subsequent loop and strand β3. The CTD dimer interface is distinct from what was proposed based on the isolated MaCCC soluble domain30. A region previously linked to dimerization participates in this interface, corroborating our structure31. The interface between two CTDs is relatively small without cross-interface hydrogen bonds, making it potentially flexible for structural rearrangement. Changes in interface packing could potentially result in significant movements in distant regions, as suggested by past FRET studies20,28.
The TMD and CTD are connected by an α-helix with a ~ten-residue linker on each end (Fig. 1d). The helix from one subunit packs against that of the other, a region we term the “scissor helix,” given its shape and structural role. This scissor helix crosses below the TM dimer interface, bringing the CTD of one protomer under the TMD of its neighbouring protomer, producing a domain-swapped architecture. The scissor helix sits in a groove formed by its neighbouring scissor helix and the CTD (Extended Data Fig. 5b), contributing substantially to the dimer interface.
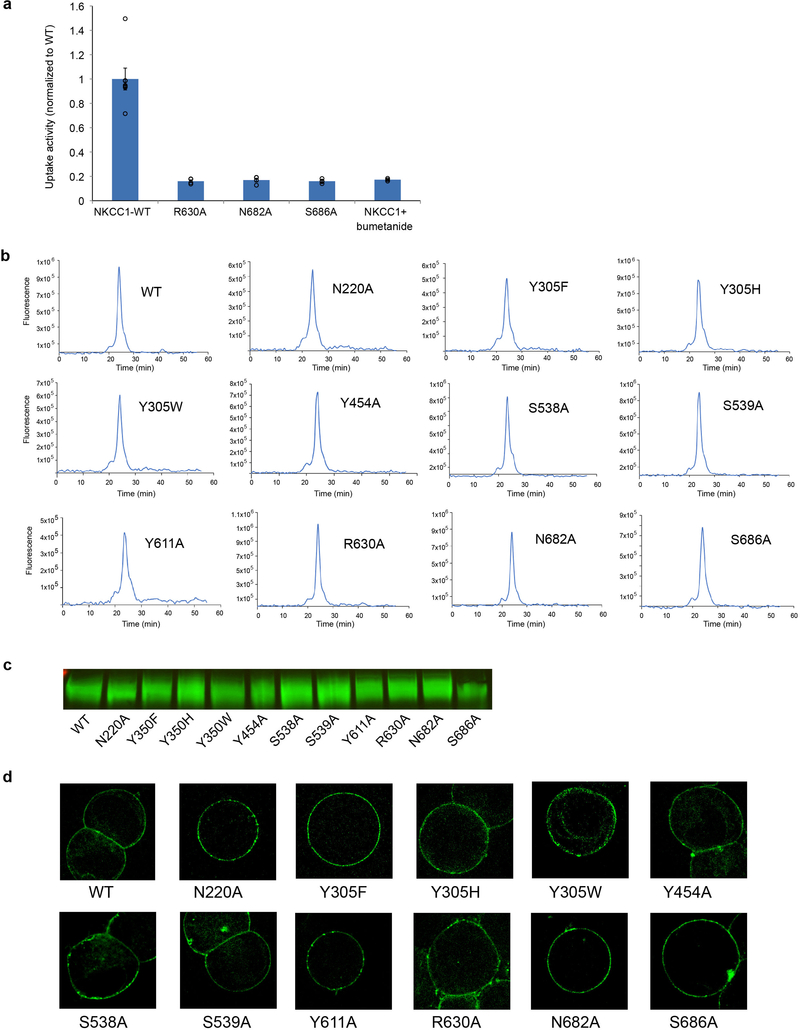
Multi-body refinement revealed transient interactions between the CTD and TMD (Extended Data Fig. 4). The intracellular loop and the short helix IL1 between TM2 and TM3 contact the N-terminal end of the scissor helix and the C-terminus of the CTD (Extended Data Fig. 5c). Additionally, the intracellular loop IL5 is in close proximity to the loop after helix α1. The multiple contacts with the TMD by cytosolic elements provide potential mechanisms to regulate transport by restricting conformational transitions in the TMD. The intracellular surface of the TMD is mostly positively charged except near the dimer interface (Extended Data Fig. 5d). NTD phosphorylation might facilitate interaction with the positively charged intracellular surface of the TMD, potentially leading to activation. Substituting select residues that make prominent contacts at the TMD-cytosolic domain interface (TMD R630; cytosolic N682, S686) abolished transport (Extended Data Fig. 6a-d), suggesting TMD-cytosolic domain communication plays an important role.
Ion transport pathway and cation-binding sites
In our structure, zNKCC1 is captured in a partially inward-open conformation (Fig. 2b). A solvent-accessible vestibule, surrounded mainly by TM1, TM3, TM6, and TM8, extends from the intracellular surface into the TMD (Fig. 2b). Near the end of the vestibule, the electrostatic surface is highly negative. After a narrow restriction point ~8 Å into the vestibule, the electrostatic surface turns positive. These electrostatic properties might provide a local environment that accommodates different substrate ions. As the vestibule widens halfway towards the intracellular side, its electrostatic distribution shows sidedness, suggesting that cations and anions might take separate routes to reach substrate-binding sites.
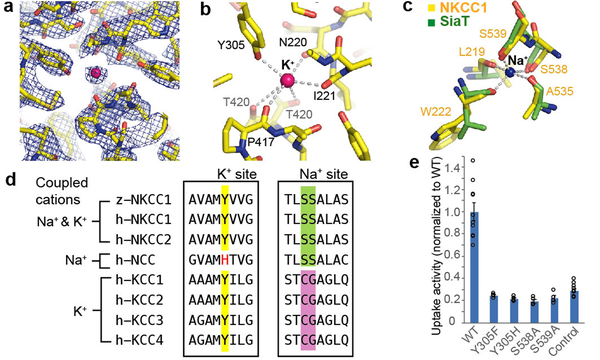
Cryo-EM samples contained K+, Na+, and Cl−. The strongest non-protein density (~20 σ) is roughly spherical and located within the typical substrate-binding pocket in APC transporters (Fig. 3a), which we ascribe to a substrate ion. Several lines of evidence suggest this ion is K+. First, its negatively charged environment and coordination by multiple backbone carbonyls suggest a cation. Second, it is directly coordinated by the hydroxyl group of Tyr305, which is strictly conserved in K+-transporting NKCC and KCC but not in K+-independent NCC (containing histidine instead)12 (Fig. 3d). The conservation of Tyr305 in NKCC and KCC but not NCC likely reflects a functional requirement, given the low sequence similarity between NKCC and KCC (~18%) compared to NKCC and NCC (~50%) (Supplementary Fig. 1). Thus, the most plausible ion is K+.
Figure 3 |. Potassium- and sodium-binding sites.
a, Potassium-binding site density map (10.0 σ, blue mesh). Strong extra density is attributed to K+ (pink sphere). b, Potassium-binding site. Dashed lines denote possible coordination. c, Sodium-binding site. NKCC1’s proposed Na+-binding site (yellow) is superimposed onto SiaT’s Na2 site (green). Dashed lines denote the sodium coordination in SiaT. d, The sequence alignment around key K+- or Na+-coordinating residues. Human and zebrafish proteins are denoted by “h” and “z”, respectively. Highlighted positions show Y305 (potassium-coordinating), S538 and S539 (sodium-coordinating). e, Uptake activities of the substrate-binding pocket mutants, normalized to WT (mean±s.e.m., n=4 independent experiments; WT and control are the same as in Fig. 1e).
The potassium is located close to the helical breaks of TM1 and TM6 and is coordinated by the Tyr305 side-chain oxygen and main-chain carbonyls from Asn220, Ile221, Pro417 and Thr420 (Fig. 3b). The ~2.94 Å average coordination distance is much closer to the average reported for potassium (2.84 Å) than for Na+ (2.42 Å)32. Additionally, the Thr420 side-chain oxygen is ~3.8 Å from potassium and might contribute to K+-binding.
A Na+-binding site called Na2 is conserved across many APC transporters33–36. An equivalent site is found in NKCC1. When superimposed onto the Na2 of SiaT, a well-characterized Na+-coupled sialic acid transporter, all Na+-coordinating elements were positioned nearly identically36 (Fig. 3c). We thus propose that this is the Na+-binding site in NKCC1. Like SiaT, the backbone carbonyls of two TM1 residues (Leu219, Trp222), one TM8 residue (Ala535) and the side-chain oxygen of two consecutive TM8 serines (Ser538, Ser539) would directly coordinate Na+. Both Ser538 and Ser539 are strictly conserved in Na+-transporting NKCCs and NCC, whereas cysteine and glycine are typically found in Na+-independent KCCs (Fig. 3d). This sequence analysis corroborates the proposed Na+-binding site. In the cryo-EM map, we only observe a weak non-protein density barely above background levels at this position, insufficient for unambiguous ion placement. We speculate this might reflect a partially occupied or loosely bound state. This would be in line with the partially inward-open conformation depicted in our structure, given that the Na2 site is often disrupted in a fully inward-open conformation of other APC transporters37.
To validate proposed ion-binding sites, we performed mutagenesis (Fig. 3e; Extended Data Fig. 6b-d). Substituting Ser538 or Ser539 reduced transport to background levels. Mutating Tyr305 to tryptophan, histidine or a more conserved phenylalanine abolished transport, confirming previous mutagenesis studies in hNKCC118. These results are consistent with our structural observations.
MD simulations and Cl−-binding sites
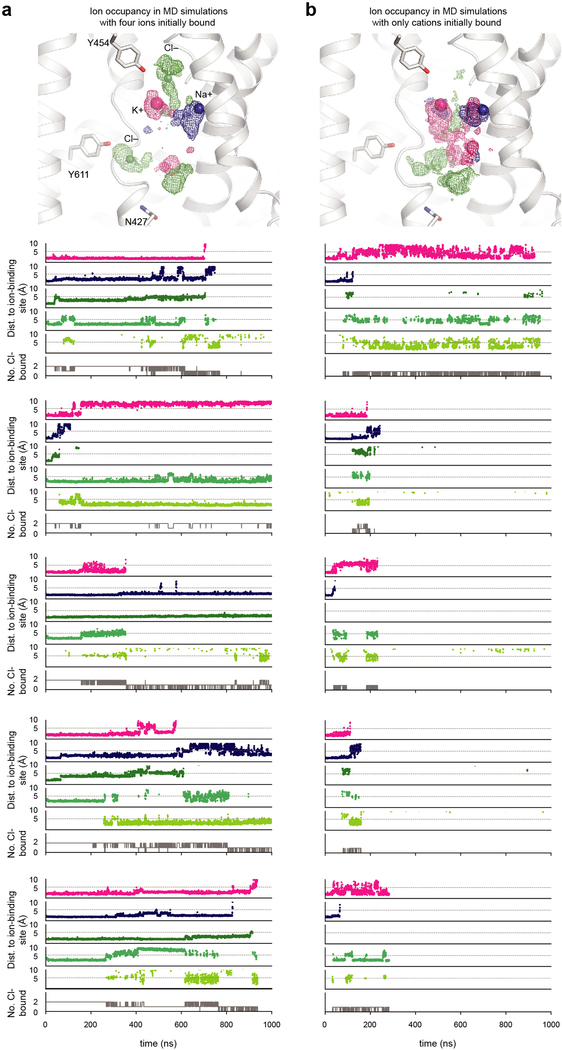
To better understand the translocation pathway and identify potential chloride-binding sites, we performed all-atom MD simulations on the TMD. In simulations initiated with K+ and Na+ bound, both cations typically remained in their respective binding pockets for hundreds of ns. In nearly all these simulations, but not in simulations lacking bound cations, chloride ions from the bulk solvent spontaneously bound within a solvent-accessible region of the transporter (Extended Data Table 2).
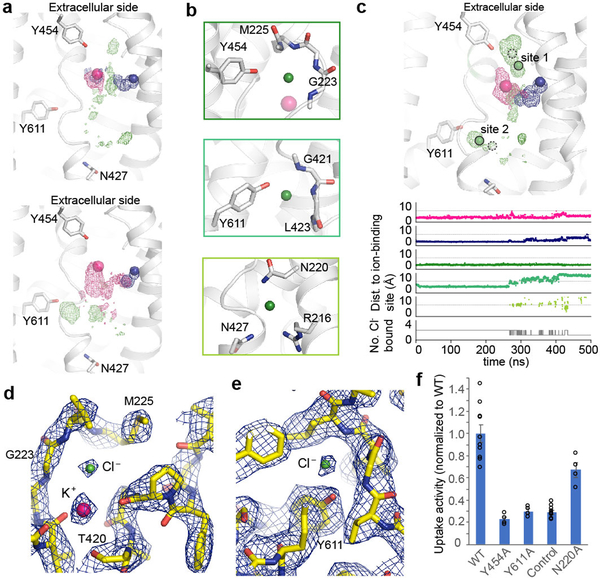
Visualizing the chloride probability densities in simulations revealed at least three binding regions (Fig. 4a). Chloride ions first diffused into the TMD between TM1 and TM6a (Fig. 4b, bottom), remaining here transiently before exiting intracellularly or moving deeper into the cavity. In some simulations, chloride explored an additional intracellular region between TM6a and TM10 (Fig. 4b, middle). In a small fraction of simulations, chloride diffused into a region between TM1 and TM6b, above the potassium-binding site (Fig. 4b, top). At most two chloride ions bound any of these three regions at once (Extended Data Fig. 7). Among the three potential chloride-binding sites, two are deep in the translocation pathway and resemble chloride-coordinating sites in other transporters with adjacent main-chain amide coordination (Fig. 4b, top and middle), leading to stable binding in simulation. In contrast, the site closest to the intracellular bulk solvent (Fig. 4b, bottom) coordinated chloride less tightly through side-chain interactions. We reasoned that this represents a transient site, akin to a third lower-affinity site in 2Cl−:H+ CLC transporters38, while the other two sites likely mediate coupled 1Na+:1K+:2Cl− transport.
Figure 4 |. Chloride-binding sites.
a, Probability density for potassium (pink), sodium (blue), or chloride (green) across two simulations initiated with bound cations. Spheres indicate the initial position of cations. b, Three regions of chloride binding identified in simulation. c, Ion probability densities (top), as shown in a, for a simulation initiated with all four ions bound. The initial position of K+, Na+, and Cl− are indicated as pink, blue, and green (dashed boundaries) spheres, respectively. The positions of Cl− based on the cryo-EM are indicated by green spheres with solid boundaries. First five traces (bottom) show distance from ion-binding site to nearest ion of that type (see Methods). In the presence of stably bound chlorides, cations reside longer within the translocation pore. Light grey lines at 5 Å offer visual guide. Bottom trace shows number of chlorides occupying the chloride-binding sites. d, Upper chloride-binding site (site 1) and potassium-binding site density map (11.0 σ, blue mesh). e, Lower chloride-binding site (site 2) density map (6.0 σ, blue mesh). f, Mutant uptake activities, normalized to WT (mean±s.e.m., n=4 independent experiments; WT and control are the same as in Fig. 1e).
We initiated further simulations with both cations bound and with chlorides bound at the two stable chloride-binding regions (Fig. 4b, top and middle). In slightly over half of simulations, the upper chloride shifted away from Tyr454 to form an electrostatic interaction with K+ (Fig. 4c), matching well with a strong EM density (~18 σ) close to the K+ density (~20 σ) (Fig. 4c, d). We therefore propose that K+ and the main-chain amides from Val224 and Met225 constitute a primary chloride-binding site (‘site 1’). In simulation, the lower chloride shifted to coordinate with main-chain amides at positions 421–423 and the side chain of Tyr611 (Fig. 4c). Again, this shifted position (‘site 2’) matches with a strong non-protein EM density (~9 σ) in this region (Fig. 4c, e). Two proposed chloride densities and the potassium density are the strongest non-protein/lipid densities in the cryo-EM map. Both chloride densities are located in highly positively charged environments and coordinated by backbone amides in helical breaks, bearing similarity to CLC transporter chloride-binding sites38. Together, our cryo-EM and simulation results suggest these two sites represent bona fide chloride-binding sites.
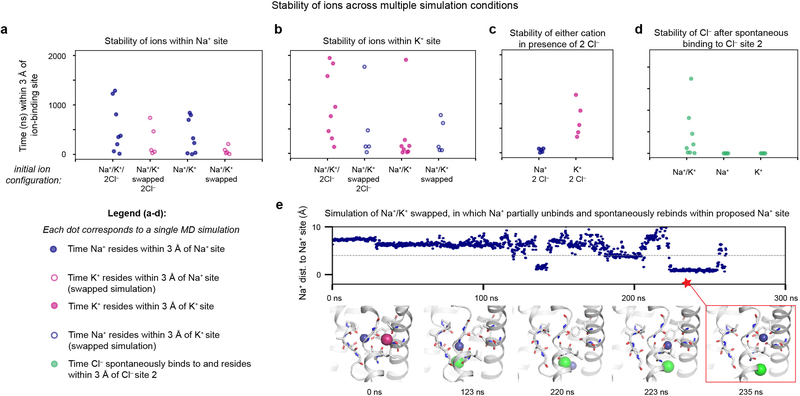
Simulations initiated with K+ and Na+ bound—but not with only K+ or Na+ bound—exhibited frequent Cl−-binding to the more intracellular Cl− site (‘site 2’), suggesting that both cations are needed to facilitate Cl−-binding (Extended Data Fig. 8d). Additional simulations suggest that in the presence of two chlorides, K+ is more stabilized than Na+ (Extended Data Fig. 8c), in line with EM observations (Extended Data Fig. 8e). Swapping K+ and Na+ initial placement generally reduced the stability of each ion (Extended Data Fig. 8a, b). In one such simulation, K+ escaped, and then Na+ spontaneously moved to the proposed Na+ site (Extended Data Fig. 8e). These results support cooperative ion binding and the K+- and Na+-binding site assignments.
To probe the roles of the proposed chloride-coordinating residues, we performed mutagenesis studies (Fig. 4f; Extended Data Fig. 6b-d). Replacing Tyr611 diminished activity, consistent with its important role in coordinating the lower chloride. Interestingly, mutating Tyr454 also abolished uptake, suggesting its involvement with the upper chloride during transport. Mutating Asn220 compromised activity, but to a lesser extent, in line with its proposed role in forming a transient site visited en route to stable binding sites. These results are consistent with our structural and computational observations regarding the location and make-up of chloride-binding sites.
Disease-related mutations
Given the sequence and functional conservation among NKCCs and NCC, the zNKCC1 structure provides a framework to interpret disease-related mutations in Na+-dependent CCC transporters1,12.
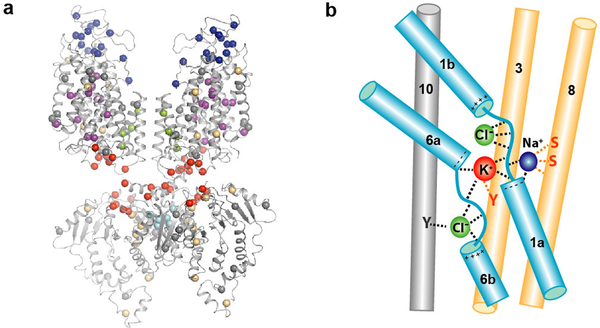
Few hNKCC1 mutations have been discovered, likely due to its diverse functions and essential roles in development. Here, we focused on Gitelman syndrome-associated mutations in NCC39, which has the largest number of known mutations in a CCC1. We mapped known mutations onto the structure1,40, grouping them into six categories (Fig. 5a; Supplementary Table 1): 1) Ion translocation pathway mutations, expected to impact transport. 2) Cap mutations, suggesting an important role in transporter function/folding. 3) TMD dimer interface mutations that might affect interactions with the other protomer or interfacial lipids. 4) TMD-soluble interface mutations that might impact domain interactions. The enrichment of cytosolic mutations near the TMD-CTD interface suggests an important role of TMD-CTD communication in regulating transport. 5) CTD dimer interface mutations that might affect CTD interactions and communication. 6) Structural mutations, such as those replacing glycine, introducing proline, or replacing bulky hydrophobic residues with charged ones, likely causing destabilization or folding problems.
Figure 5 |. Disease-related mutations and interconnected ion-binding sites.
a, Mutations on NCC linked to Gitelman syndrome mapped onto the structure through sequence alignment. Mutations are shown as spheres and grouped into six categories: ion translocation pathway (purple), cap domain (blue), TM domain dimer interface (green), TM-soluble interface (red), CTD dimer interface (cyan), and structural/folding (yellow) mutations. Other mutations in grey. b, Schematic of ion-binding sites: coordination, dashed lines; core domain helices, light blue; and scaffold domain helices, yellow.
Discussion
Dimerization has been found in a variety of transporter families, and implicated in regulating transport41. In transporters with cytosolic regulatory domains like NKCCs, TMD-cytosolic domain linkers are often flexible. The geometrical constraints imposed by dimerization can help maintain proximity between cytosolic and TMDs, thereby facilitating communication to regulate transport. It remains to be elucidated whether two protomers of NKCC1 communicate during transport.
Our structural observations shed light on ion coupling (Fig. 5b). The Na+- and K+-binding sites are in close proximity and formed between the core and scaffold domains, where their disruption or formation could be cooperative during state transitions. The upper Cl− is mainly coordinated by backbone amides in the TM1-hinge region, adjacent to K+ and Na+-coordinating residues. It is conceivable that K+ and Na+ binding could stabilize the hinge conformation for Cl− coordination, and vice versa. Furthermore, the upper Cl− is in range to interact with K+, suggesting cooperative binding. The lower Cl− coordinating residues are adjacent to K+-coordinating residues in the same TM6 hinge region. Thus, the physical proximity and interconnected linkage between Na+-, K+-, and Cl−-binding sites suggest a potential mechanism for ion coupling and cooperative binding.
This NKCC1 structure represents the first APC transporter structure containing a cytosolic regulatory domain. The alternating access of APC transporters typically involves pronounced movement of the core domain relative to the scaffold domain. Comparable conformational transitions in NKCC1 are expected to cause significant changes in the intracellular regions of the TMD at the interface with the CTD. In addition, some degree of flexibility between the CTD and TMD as observed in our structures could enable different relative orientations or engagement according to states. These features might facilitate CTD-TMD communication, regulating transport activity. The detailed mechanism of regulation by the CTD awaits future investigation.
METHODS
Expression and purification
NKCC1 from Danio rerio was cloned into a modified pFastBac vector with an N-terminal maltose binding protein (MBP) tag and 3C protease cleavage site. This construct was expressed in Sf9 insect cells (Expression Systems, #94–001S; no further authentications were carried out and no mycoplasma contamination tests were performed for this study) using the baculovirus system. Cells were infected at a density of 3.5–4 × 10⁶ cells per ml and culture flasks were shaken at 27 °C for 60 hours. Cell pellets were frozen down at −80 °C until further use. All protein purification steps were carried out at 4 °C unless otherwise noted. Cells were lysed by osmotic shock by incubating for 30 mins in a buffer containing 20 mM Tris-HCl, pH 8.0 with 1.5 μg/ml Leupeptin, 1.5 μg/ml pepstatin A, 1mM benzamidine, and 1:500 dilution of aprotinin. The sample was then centrifuged at 39,000g for 20 min. The supernatant was discarded and the pellets were solubilized using a glass Dounce tissue homogenizer in buffer A (20mM Tris-HCl, pH 8.0, 200mM NaCl, 200mM KCl) supplemented with 1% lauryl maltose neopentyl glycol (LMNG, Anatrace), 0.01% cholesteryl hemisuccinate (CHS, Anatrace), 1.5 μg/ml Leupeptin, 1.5 μg/ml pepstatin A, 1mM benzamidine, and 1:500 dilution of aprotinin. The sample was stirred for 2.5 hours and then centrifuged at 31,000g for 45 min. The insoluble fraction was discarded and the supernatant was incubated with prewashed amylose resin for 1 hour. The resin was carefully washed to remove contaminant protein. The NKCC1 protein was cleaved from MBP by incubating with 3C protease. The sample was further purified by gel filtration (Superose 6, GE Healthcare) in buffer A with 0.06% digitonin. The peak fraction was collected and concentrated for cryo-EM.
86Rb+ uptake assays
NKCC1 WT and mutants with an N-terminal 10x-His tag were transfected into HEK 293S cells (ATCC, #CRL-3022; no further authentications were carried out and no mycoplasma contamination tests were performed for this study) using a pSBbi-RP vector42 and Lipofectamine 3000 (Invitrogen) according to the manufacturer’s instructions. Stable cell lines were generated for all constructs by selecting with 2 μg/ml puromycin before carrying out further experiments. Cells were maintained in 293 Freestyle media (LifeTechnologies) supplemented with 10% FBS.
NKCC1 function was tested by measuring 86Rb+ uptake in HEK 293S cells grown to confluence in 6-well plates. 1.5 hours prior to experiments, growth media was replaced with a low chloride, hypotonic solution of 75 mM Na-gluconate, 0.5 mM MgCl2, 0.5 mM Na2SO4, 0.5 mM CaCl2 and 7.5 mM HEPES, pH 7.4 in order to activate NKCC1. 70 μM bumetanide was added to certain samples as appropriate. 86Rb+ uptake was allowed to proceed for 1 min in a solution of 150 mM Na-gluconate, 135 mM NaCl, 5mM RbCl (2 μCi/ml 86Rb+, PerkinElmer), 1 mM MgCl2, 1 mM Na2SO4, 1 mM CaCl2 and 15 mM HEPES, pH 7.4. Uptake was terminated by washing 3 times with an ice-cold solution of 110 mM MgCl2. Cells were resuspended and lysed in 1% SDS, and subjected to scintillation quantification. The biochemical behavior, expression level and membrane localization of each mutant and the WT were assessed (Extended Data Fig. 6b, c, d).
Fluorescent size exclusion chromatography
NKCC1 WT and mutants with a C-terminal EGFP tag were grown in 6-well plates until fully confluent. Cells were harvested and lysed for 2 hours at 4 °C in a solution of buffer A supplemented with 1% (wt/vol) lauryl maltose neopentyl glycol (LMNG, Anatrace), 0.01% cholesteryl hemisuccinate (CHS, Anatrace), 1.5 μg/ml Leupeptin, 1.5 μg/ml pepstatin A, 1mM benzamidine, and 1:500 dilution of aprotinin. Equal amounts of solubilized protein (based on OD280) were analyzed by gel filtration (Superdex 200 increase, GE Healthcare). Fluorescence signal was monitored using an excitation wavelength of 487 nm and emission wavelength of 507 nm.
Western blotting
Stable cell lines expressing NKCC1 were grown in 6-well plates until fully confluent, and then washed with PBS and harvested. Cells were then lysed for 2 hours at 4 °C in a solution of buffer A supplemented with 1% (wt/vol) lauryl maltose neopentyl glycol (LMNG, Anatrace), 0.01% cholesteryl hemisuccinate (CHS, Anatrace), 1.5 μg/ml Leupeptin, 1.5 μg/ml pepstatin A, 1mM benzamidine, and 1:500 dilution of aprotinin. The lysates were centrifuged at 15,000g for 1 hour at 4 °C and the supernatant measured for total protein concentration. Equal amounts of total protein were mixed with SDS loading buffer and loaded onto a Mini-PROTEAN Precast Gel (Biorad). After electrophoresis, transfer and blot, membranes were probed with a mouse anti-His primary antibody (QIAGEN), followed by a donkey anti-mouse secondary antibody (LI-COR). The membrane was then imaged using the Odyssey infrared imaging system (LI-COR).
Fluorescence imaging
Cells were seeded onto Lab-Tek II Chambered Coverglass (Nunc) 24 hours prior to imaging. 3D fluorescence imaging and deconvolution was performed on a DeltaVision OMX BLAZE system (Applied Precision-GE, Inc.) equipped with 3 emCCDs (Evolve, Photometrics Inc.) using an Olympus UPlanApo 100x (NA 1.40) oil-immersion objective. Images were acquired in emCCD-mode with a gain of 200. An OMX BLAZE v2 imaging system (GE Healthcare) was used to image cells. A 100X 1.42 numerical aperture U-PLANAPO objective was used, and emission photons captured by an Evolve 512 emCCD camera (Photometrics). Widefield epifluorescence excitation for deconvolution datasets was with InsightSSI illuminator (488nm) and standard emission filter sets (528/48). 3D images were taken with 200 nm per slice. Deconvolution was done using SoftWorx version 7.0.0. Images were background subtracted and adjusted brightness/contrast linearly by FIJI (http://fiji.sc).
EM sample preparation and data collection
For negative stain EM purified NKCC1 was diluted to 0.02 mg/mL in buffer containing 0.06% digitonin, and 2.5uL was applied to glow-discharged copper EM grids covered with a thin layer of continuous carbon film. Grids were stained with a solution of 1.5% (w/v) uranyl formate and imaged on a Tecnai T12 electron microscope (FEI) operated at 120 kV. Images were collected at a nominal magnification of 67,000x corresponding to a calibrated pixel size of 1.68 Å on a 4k × 4k CCD camera (UltraScan 4000, Gatan). Images were binned 2×2 prior to particle selection and further processing.
For cryo-EM, 3uL of full-length or N-terminal truncated NKCC1 purified in digitionin at a concentration of 7.6 mg/mL was applied to Quantifoil R2/1 holey carbon grids, and blotted for 2.0 seconds at 96% humidity on a Leica EM GP2 before being plunge frozen in liquid ethane cooled by liquid nitrogen. Grids of full-length NKCC1 were imaged on a Titan Krios operated at 300kV. Images were collected on a K2 Summit detector in super-resolution counting mode at a magnification of 130,000x corresponding to a physical pixel size of 1.06 Å. Data was collected using image shift to collect 5 images per hole. Grids of N-terminal truncated NKCC1 were imaged on a Titan Krios operated at 300kV. Images were collected on a K2 Summit detector in super-resolution counting mode at a magnification of 130,000x corresponding to a physical pixel size of 1.04 Å. Data was collected using image shift to collect 4 images per hole.
Cryo-EM data processing
Dose-fractionated super-resolution movies collected on the K2 Summit direct electron detector were binned over 2 × 2 pixels, and then subjected to motion correction using the program MotionCor243. A dose-weighted sum of all frames from each movie was used for all image processing steps except for defocus determination. Defocus values were calculated using the program CTFFIND444 using the summed images from all movie frames without dose weighting. Semi-automated particle picking was performed using a procedure implemented in Simplified Application Managing Utilities of EM Labs (SAMUEL)45. 2D classification of selected particle images was performed with ‘samclasscas.py’, which uses SPIDER operations to run ten cycles of correspondence analysis, k-means classification and multi-reference alignment, or by RELION 2D classification46. 2D class averages were utilized to generate initial 3D models by SPIDER 3D projection matching refinement using ‘samrefine.py’, starting from a cylindrical density mimicking the general shape and size of NKCC1.
3D classification and refinement were carried out in RELION-2.0 or RELION-3.0. Per-particle CTF parameter and beam-tilt refinement in RELION-3.047 were performed prior to a final run of ‘auto-refine’ to generate the final map of full-length NKCC1 TM domain. For multibody refinement in RELION-3.0, two soft masks encompassing the TM or soluble domain were employed. Following multibody refinement the program ‘relion3_flex_analyse’ was utilized to perform principal component analysis on the relative rotations and translations identified from multibody refinement48. All refinements followed the gold-standard procedure, in which two half datasets are refined independently. The overall resolutions were estimated based on the gold-standard Fourier shell correlation (FSC) = 0.143 criterion. Local resolution variations were estimated from the two half data maps using ResMap49. The amplitude information of the final maps was corrected by using ‘relion_postprocess’ in RELION or ‘bfactor.exe’50. The number of particles in each dataset and other details related to data processing are summarized in Extended Data Table 1.
Model building and refinement
The TM domain model was initially built into a 3.4 Å cryo-EM map of the N-terminal truncated NKCC1 TM region using an initial template from the server RaptorX51. The initial template was manually rebuilt in Coot52. The resulting model was subsequently subject to manual adjustment in Coot against the 2.9 Å focused map of the full-length NKCC1 TM region. The high quality of the maps allows unambiguous sequence register. The model of CTD was built against the 3.8 Å focused map of the full-length NKCC1 CDT region. A partial initial template was obtained from SWISS-MODEL53 based on the MaCCC CTD structure30, which was subject to manual rebuilding in Coot. The final CTD model contains all residues except an un-structured loop (856–925). The model for the whole molecule was generated by a rigid body fit of the TM and CTD models into a composite map of the TM and CTD regions. The connection between TM and CTD was built based on the composite map and a 4.2 Å map for the whole molecular. The models were refined using Phenix real space refine54 and the geometry of the models was evaluated by Molprobity55.
System setup for MD simulations
We performed MD simulations of single TM domain protomers in a hydrated lipid bilayer, as each protomer encompasses a single ion-translocation pathway, under several different conditions. These included conditions that (1) lacked bound ions, (2) contained Na+ and a K+ placed in sites suggested by experimental data, (3) contained bound cations as well as two chloride ions, positioned in sites indicated by simulations of the second condition, (4) contained bound chloride ions, as in the third condition, with Na+ also bound, (5) contained bound chloride ions, as in the third condition, with K+ also bound, (6) contained all four ions, as in the third condition, with the Na+ and K+ swapped into each other’s respective sites, (7) contained both cations but no bound chlorides, with Na+ and K+ swapped into each other’s respective sites, (8) contained only bound Na+, and (9) contained only bound K+.
Our simulations were based on two refinements of the cryo-EM model; the two structures were remarkably similar, with very minor differences. Briefly, the two refinements differed from each other in that the chloride ion within ‘site 1’ was positioned much closer to K+ in the latter model compared to in the former model. The position of the intracellular chloride also shifted slightly. We initiated conditions 2 and 3 from models derived from both the first and second refinements and observed similar behavior for each condition starting from either refinement. The remaining simulation conditions (1, as well as 4–9) all were initiated from the second and final refinement.
Prior to running MD simulations of NKCC1, we performed several steps of refinement and modeling of the cryo-EM structures. Prime (Schrödinger) was used to model in missing residue side chains, and neutral and methylamide groups were added to cap the protein termini. All titratable residues were left at their dominant protonation state at pH 7.0, except for Glu315 and Asp514, which exhibited pKas > 7.0 (PROPKA) in the second and final model. These residues are located on the extracellular face of the transporter, far from the ion-binding sites. We therefore protonated these residues in all simulations initiated from the final model. All histidine residues were represented with the hydrogen on the epsilon nitrogen. Simulations with no ions bound or with only one bound cation contained 150 mM K+, 150 mM Na+ and 300 mM Cl− to increase the probability of observing spontaneous ion binding in simulation. All other simulations were prepared with 150 mM Na+ and 150 mM Cl−. Each of the prepared systems was inserted into a pre-equilibrated palmitoyl oleoylphosphatidylcholine (POPC) bilayer using Dabble56. Details on the final system sizes and corresponding simulation lengths can be found in Extended Data Table 2.
MD simulation force field parameters
The CHARMM36m parameters were applied to protein, the CHARMM36 parameters to lipids and ions (Na+, K+ and Cl−), and the CHARMM36 TIP3P parameter set to water57,58.
MD simulation protocol
MD simulations were performed on GPUs with the CUDA-enabled version of PMEMD in AMBER16 59,60. Each simulation underwent a similar equilibration procedure. Following an initial minimization, each system underwent a heating using the Langevin thermostat from 0 K to 100 K in the NVT ensemble over 12.5 picoseconds (ps) with 10 kcal mol−1 Å−2 harmonic restraints on all non-hydrogen atoms in the protein, ligand and lipid. The heated then continued in the NPT ensemble with semi-isotropic coupling for 125 ps and a pressure of 1 bar to a final temperature of 310 K with 5.0 kcal mol−1 Å−2 harmonic restraints. Further equilibration was then carried out at 310 K with harmonic restraints applied to the protein, as well as to ions initially present within the translocation pathway, starting at 5.0 kcal mol−1 Å−2 and reduced in a stepwise fashion every 2 nanoseconds (ns) for 10 ns, followed by a 0.1 kcal mol−1 Å−2 reduction every 2 ns for 18 additional ns for a total of 28 ns of equilibration. Production simulations were run at 310K and 1 bar in the NPT ensemble using the Langevin thermostat and Monte Carlo barostat.
Each simulation used periodic boundaries and employed a time step of 4.0 fs using hydrogen mass repartioning61. All bond lengths to hydrogens were constrained by SHAKE62. Short-range electrostatic and van der Waals interactions were cut off at 9.0 Å, while long-range electrostatic interactions were computed using the particle mesh Ewald method. The FFT grid size was chosen such that the width of a single grid cell was approximately 1 Å.
Snapshots from each trajectory were saved every 200 ps during the production phase of each simulation and visualized using VMD63. Analysis was carried out using a combination of VMD, CPPTRAJ, and locally developed analysis tools.
In order to quantify the occupancy of bound ions in simulation, grid analysis in CPPTRAJ was used to determine the probability densities for sodium, potassium and chloride for each simulation condition64. A three-dimensional grid consisting of 100 × 100 × 100 voxels with a spacing of 0.5 Å in each direction was constructed centered at the origin of the system (center of the protein core). The analysis was performed on all frames, using the bincenter and normframe grid analysis options. Visualization of the resulting ion probability density was done in PyMol, with ion densities from representative simulations in Figures 4a (top panel), 4a (bottom panel), and 4c displayed at contour levels of 0.0004, 0.001 and 0.001, respectively, where a voxel with a contour level of .01 would contain an ion in at least 1% of all analyzed simulation frames.
To quantify the distance of ions from each ion-binding site, we manually selected, for each site, a set of protein atoms whose center represented the center of that site, updating these coordinates for every simulation frame (K+ site: carbonyl oxygens of Asn220 and Pro417; Na+ site: carbonyl oxygens of Leu219 and Trp222, and side-chain oxygens of Ser538 and Ser539; extracellular chloride-binding site: amide nitrogens of Gly223 and Met225, and side-chain oxygen of Tyr454; intracellular chloride-binding site: amide nitrogens of Gly421 and Leu423, and side-chain oxygen of Tyr611; transient, intracellular chloride-binding site: C-gamma atoms of side chains at positions Asn220, Asn427 and Arg216). We then identified the ion closest to each center of a selection of ions of a particular type. To determine ion stability within each site, we used cutoffs of 3 Å. For the swapped-cation conditions, the position of K+ was measured with respect to the center of the Na+ binding site whereas the position of Na+ was measured with respect to the center of the K+ binding site, as described above. Since more than one chloride could enter the translocation pore at once, we also checked whether the closest ion for one site was the same ion as for another site or for all three sites to prevent the double counting of ions. For ion stability measurements in Extended Data Fig. 8 all comparisons were performed on simulations started from the most recent model (described above).
Extended Data
Extended Data Figure 1 |. Biochemical characterization of NKCC1 and cryo-EM data processing workflow for N-terminal truncation NKCC1.
a, NKCC1 in size exclusion chromatography. Experiments were repeated 6 times independently with similar results. b, Representative negative-stain EM micrograph of purified NKCC1 in digitonin. Experiments were repeated 6 times independently with similar results. c, 2D class averages from negative-stained particles reveal the dimeric structure of NKCC1, with two soluble domains visible beneath the TM domain and detergent micelle. Experiments were repeated 6 times independently with similar results. d, Representative cryo-EM micrograph of N-terminal truncated NKCC1 particles purified in digitonin. e, 2D class averages of N-terminal truncated NKCC1. f, Classification and refinement workflow utilized to obtain final cryo-EM maps of N-terminal truncated NKCC1. Two processing strategies were followed in order to obtain a high-resolution map of the TM domain (left), or a composite map of the TM and soluble domains following Relion3 multibody refinement (right).
Extended Data Figure 2 |. Cryo-EM data processing workflow for full-length NKCC1.
a, Representative cryo-EM micrograph of full-length NKCC1 particles purified in digitonin. b, 2D class averages of full-length NKCC1. Several averages show high resolution features in the TM domain, however the soluble domain is fuzzy and disordered, indicative of conformational flexibility between these two domains. c, Classification and refinement workflow utilized to obtain final cryo-EM maps of full-length NKCC1. Two processing strategies were followed in order to obtain a high-resolution map of the TM domain (left), or a composite map of the TM and soluble domains following Relion3 multibody refinement (right).
Extended Data Figure 3 |. Cryo-EM 3D reconstruction analysis, statistics and representative density.
a, Angle distributions for particles contributing to the high-resolution map of the TM domain for full-length NKCC1. b, Fourier shell correlation (FSC) curves: gold-standard FSC curve between the two half maps with indicated resolution at FSC=0.143 (red); FSC curve between the atomic model of the TM domain and the final map with indicated resolution at FSC=0.5 (blue); FSC curve between half map 1 (orange) or half map 2 (green) and the atomic model refined against half map 1. c, Local resolution of the high-resolution TM domain map as determined with ResMap. d, Slice view of the angle distributions for particles contributing to the map of the soluble domain for full-length NKCC1 obtained from Relion3 multibody refinement. e, Fourier shell correlation (FSC) curves: gold-standard FSC curve between the two half maps with indicated resolution at FSC=0.143 (red); FSC curve between the atomic model of the soluble domain and the final map with indicated resolution at FSC=0.5 (blue); FSC curve between half map 1 (orange) or half map 2 (green) and the atomic model refined against half map 1. f, Local resolution of the soluble domain map as determined with ResMap. g, The cryo-EM density maps are of high quality throughout the TM domain and show clear side chain features in CTD. Densities for all TM helices, as well as helices and strands in CTD are shown as wire mesh (6 σ). The transporter is shown as sticks.
Extended Data Figure 4 |. Principal Component Analysis of domain movements from multibody refinement.
a, Contribution of individual eigenvectors to the total variance in rotation and translation between the TM and soluble domain. Eigenvectors 1–3 contribute more than 50% of the total variance in the rotations and translations between domains. b-d, Histograms of amplitude along eigenvector 1 (b), eigenvector 2 (c), and eigenvector 3 (c). All eigenvector amplitude histograms are monomodal, suggesting that the rotations/translations are continuous in nature. e-g, Representation of the extremes of rotation/translation between TM and soluble domains along eigenvector 1 (e), eigenvector 2 (f), and eigenvector 3 (g). For simplicity of visualization, the maps at either extreme of an individual eigenvector were aligned on the TM domains. Blue arrows indicate the direction of movement of the soluble domain relative to the TM domain.
Extended Data Figure 5 |. Structure of soluble domain.
a, A single subunit of the NKCC soluble domain in ribbon representation. The N- and C-terminal halves of the CTD that show a similar structure are coloured in green and orange, respectively. b, The dimer of the soluble domain. One subunit is shown as a surface and the other is shown as a ribbon. c, Close-up view of the TM and soluble domain interface. Two subunits are coloured in dark green and gold, respectively. The TM domain is shown as a surface representation and the soluble domain as a ribbon representation. The NTD and the C-terminal end of the protein are located at the interface. d, The intracellular surface of the TM domain. The surface is coloured according to electrostatic potential (red, −10 kT e−1; blue, +10 kT e−1).
Extended Data Figure 6 |. Uptake activities of interface mutants and characterizations of all NKCC1 mutants in this study.
a, Uptake activities of NKCC1 mutants at the TM and the cytosolic domain interface. 86Rb+ uptake of NKCC1 mutant was normalized to that of WT (mean± s.e.m., n=4 independent experiments except for WT, n=7 independent experiments and for WT with bumetanide, n=3 independent experiments). b, NKCC1 WT and mutants (also including those in Fig. 1e, 3e, 4f) in size exclusion chromatography. The GFP-fusion protein is monitored by fluorescence. Experiments were repeated 3 times independently with similar results. c, The expression level of NKCC1 WT and mutants as shown by Western blot. Experiments were repeated 3 times independently with similar results. For gel source data, see Supplementary Figure 2. d, The membrane localization of NKCC1 WT and mutants. The fluorescence images are shown for HEK293 cell expressing NKCC1-GFP fusion. Experiments were repeated 3 times independently with similar results.
Extended Data Figure 7 |. Molecular dynamics simulations.
a, Ion probability densities of ions within translocation pathway (top) and individual traces (bottom) for all simulations performed with K+, Na+, and Cl– initially present in the translocation pathway. b, Ion probability densities of ions within translocation pathway (top) and individual traces (bottom) for all simulations performed with only K+ and Na+ initially present in the translocation pathway. In the latter set of simulations, Cl– spontaneously explores regions that form stable chloride-binding sites. Probability density maps were calculated as described in Methods. The top four simulation traces represent the minimum distance of an ion of a particular type from the pre-determined centre of each binding site (see Methods). The bottom simulation trace shows the number of Cl− ions bound within any of the three chloride-binding sites at once.
Extended Data Figure 8 |. Ion stability in MD simulations.
a-d, Comparison of relative stabilities of ions across multiple simulation conditions. Here, stability refers to the amount of time an ion resides within 3 Å of the pre-determined centre of each binding site (see Methods). Each dot corresponds to a result from a single simulation. Closed circles indicate simulations with each cation placed in its predicted site; open circles indicate simulations with either cation swapped into the other cation’s predicted binding site. Blue circles correspond to measurements for Na+ and pink circles for K+. For a and b, we examined the relative stabilities of cations to determine whether the predicted Na+ and K+ binding sites exhibit a preference for their respective cations. a, For simulations started with all ions bound, Na+ resided longer in the Na+ site compared to K+ when K+ was initially placed within the Na+ site (‘Na+/K+/2Cl−’ vs. ‘Na+/K+ swapped, 2 Cl−’). The same trend appeared for simulations with just cations initially bound within the cavity (‘Na+/K+’ vs. ‘Na+/K+ swapped’). b, For simulations started with all ions bound, K+ resided for longer in the K+ site compared to Na+ when Na+ was initially placed within the K+ site (‘Na+/K+/2Cl−’ vs. ‘Na+/K+ swapped, 2 Cl−’). For simulations with just cations initially bound, K+ and Na+ appeared to leave after similar amounts of time, perhaps because, particularly in the absence of Cl−, the K+ site is quite accessible to the intracellular solvent, and ions of either type could dissociate rapidly from this area. c, K+ remained within its initial position much longer compared to Na+ in the presence of two Cl− ions. In simulations with Na+ and 2 Cl− ions bound, Na+ often immediately dissociated from its site, perhaps indicating that the Na+ site on its own has a weaker affinity for binding cations in this state compared to the K+ site, whose increased proximity to Cl− site 1 likely helps to stabilize K+ in the site. d, Chloride ions spontaneously visited and remained within 3 Å of the primary intracellular chloride site (site 2) for longer in the presence of both cations compared to in the presence of either cation alone. e, In one simulation, in which Na+ and K+ were initially placed in a swapped configuration with no Cl− ions bound, we observed escape of K+ (pink) followed by destabilization of the Na+ ion (blue) within the K+ site (123 ns) accompanied by Cl− binding. Na+ then proceeded to move down toward the intracellular side (220 ns) before rebinding for a 25-ns period within the proposed Na+-binding site.
Extended Data Table 1.
Cryo-EM data collection, refinement and validation statistics.
| Full-length NKCC1 | N-terminally truncated NKCC1 |
|||||
|---|---|---|---|---|---|---|
| Data collection and processing | ||||||
| Magnification | 130,000 | 130,000 | ||||
| Voltage (kV) | 300 | 300 | ||||
| Electron exposure (e−/Å2) | 53 | 53 | ||||
| Defocus range (μm) | 1.0–3.0 | 1.0–2.5 | ||||
| Pixel size (Å) | 1.06 | 1.04 | ||||
| Exposure time (seconds) | 8 | 10 | ||||
| Number of movies | 4,586 | 5,845 | ||||
| Initial particle images (no.) | 1,005,359 | 914,197 | ||||
| TM domain |
CTD | Composite TM+CTD |
Full Molecule |
TM domain | CTD | |
| PDB 6NPH EMDB 0470 | PDB 6NPJ EMDB 0471 | PDB 6NPL EMDB 0473 | EMDB 0475 | PDB 6NPK EMDB 0472 | EMDB 0474 | |
| Symmetry imposed | C2 | C1 | C1 | C2 | Cl | |
| Final particle images (no.) | 63,659 | 60,997 | 60,997 | 227,231 | 233,031 | |
| Map resolution (Å) FSC threshold |
2.9 0.143 |
3.8 0.143 |
4.2 0.143 |
3.6 0.143 |
4.2 0.143 |
|
| Map resolution range (Å) | 3.9–2.9 | 6.6–3.7 | 8.8–4.0 | 6.2–3.4 | 7.0–4.0 | |
| Refinement | ||||||
| Initial model used (PDB code) | Individual TM domain and CTD | |||||
| Model resolution (Å) FSC threshold |
3.1 0.5 |
3.8 0.5 |
3.8 0.5 |
|||
| Model resolution range (Å) | 233–2.9 | 233–3.8 | 233–2.9 | |||
| Map sharpening B factor (Å2) | −107 | −162 | −191 | −209 | −250 | |
| Model composition | ||||||
| Non-hydrogen atoms | 7504 | 6186 | 13774 | 7134 | ||
| Protein residues | 944 | 768 | 1722 | 944 | ||
| Ligands | 13 | -- | 13 | -- | ||
| B factors (Å2) | ||||||
| Protein | 64.27 | 39.82 | 31.72 | 57.11 | ||
| Ligand | 65.84 | -- | 22.94 | -- | ||
| R.m.s. deviations | ||||||
| Bond lengths (Å) | 0.008 | 0.008 | 0.006 | 0.004 | ||
| Bond angles (°) | 1.090 | 1.236 | 0.977 | 0.820 | ||
| Validation | ||||||
| MolProbity score | 2.26 | 2.47 | 2.62 | 2.21 | ||
| Clashscore | 5.09 | 6.43 | 9.03 | 3.89 | ||
| Poor rotamers (%) | 4.27 | 6.25 | 7.74 | 6.13 | ||
| Ramachandran plot | ||||||
| Favored (%) | 92.13 | 91.18 | 91.48 | 93.40 | ||
| Allowed (%) | 7.87 | 8.82 | 8.46 | 6.60 | ||
| Disallowed (%) | 0 | 0 | 0.06 | 0 | ||
Extended Data Table 2.
Conditions and durations of MD simulations.
| Simulation Condition | Initial System Dimensions (A) |
Number of Atoms |
Simulation Lengths (μs) |
|---|---|---|---|
| With model 1 (see Methods) | |||
| Na+/K+ bound | 99 × 93 × 100 | 91,082 | 2.02, 1.52, 2.02, 2.03, 0.31 |
| Na+/K+/Cl−/Cl− bound | 99 × 93 × 100 | 91,082 | 2.49, 2.18,2.07, 2.34, 2.38 |
| With model 2 (see Methods) | |||
| Na+/K+/Cl−/Cl− bound | 97 × 91 × 92 | 81,407 | 2.03, 2.03, 2.04, 2.02, 2.02, 2.01, 2.01, 2.00 |
| Na+/K+ bound | 97 × 91 × 92 | 81,407 | 2.00, 2.03,2.01, 2.01,2.02,2.03, 2.01,2.03 |
| Na+/Cl−/Cl− bound | 98 × 92 × 92 | 82,679 | 1.43, 1.50, 1.10, 1.48, 1.39 |
| K7+/Cl−/Cl− bound | 98 × 92 × 92 | 82,679 | 1.21, 1.23, 1.20 1.21, 1.01 |
| Na+/K+ swapped, Cl−/Cl− bound | 97 × 91 × 92 | 81,407 | 2.03, 2.01, 2.00, 2.02, 2.06 |
| Na+/K+ swapped | 99 × 93 × 92 | 84,032 | 2.04, 2.09, 2.00, 2.02, 2.03 |
| K+ bound | 98 × 92 × 92 | 82,639 | 1.81, 1.02, 1.51, 1.40, 1.34 |
| Na+ bound | 98 × 92 × 92 | 82,624 | 1.52, 1.51, 1.50, 1.01, 1.12 |
| No ions bound | 98 × 92 × 92 | 82,612 | 1.26, 1.28, 1.26, 1.47, 1.17 |
Supplementary Material
Acknowledgements.
We thank D. Bushnell and L. Montabana at Stanford-SLAC Cryo-EM facilities, Z. Li at HMS, C. Xu and K. Song at the UMass cryo-EM facility, and C. López and C. Yoshioka at the OHSU Multiscale Microscopy Core for help with EM data collection. This work was made possible by support from Stanford University and the Harold and Leila Y. Mathers Charitable Foundation to L.F., an NIH Kirschstein-NRSA fellowship and Medical Scientist Training Program funding to T.C., a Dean’s fellowship to J.Z., National Science Foundation Graduate Research Fellowships to N.R.L and A.W., and a Stanford Graduate Fellowship to A.W. We thank A. Brunger and M. Maduke for helpful comments.
Footnotes
Data availability
The three-dimensional cryo-EM density maps have been deposited into the Electron Microscopy Data Bank under accession numbers EMD-0470, EMD-0471, EMD-0472, EMD-0473, EMD-0474 and EMD-0475. The coordinates are deposited into the Protein Data Bank with accession numbers 6NPH, 6NPJ, 6NPK and 6NPL. All simulation starting models and trajectories are available upon request.
Authors declare no competing financial interests.
REFERENCES
- 1.Gamba G. Molecular physiology and pathophysiology of electroneutral cation-chloride cotransporters. Physiol. Rev 85, 423–493 (2005). [DOI] [PubMed] [Google Scholar]
- 2.Haas M & Forbush B 3rd. The Na-K-Cl cotransporter of secretory epithelia. Annu. Rev. Physiol 62, 515–534 (2000). [DOI] [PubMed] [Google Scholar]
- 3.Arroyo JP, Kahle KT & Gamba G. The SLC12 family of electroneutral cation-coupled chloride cotransporters. Mol. Aspects Med 34, 288–298 (2013). [DOI] [PubMed] [Google Scholar]
- 4.Russell JM Sodium-potassium-chloride cotransport. Physiol. Rev 80, 211–276 (2000). [DOI] [PubMed] [Google Scholar]
- 5.Kaila K, Price TJ, Payne JA, Puskarjov M & Voipio J. Cation-chloride cotransporters in neuronal development, plasticity and disease. Nat. Rev. Neurosci 15, 637–654 (2014). [DOI] [PMC free article] [PubMed] [Google Scholar]
- 6.Gagnon KB & Delpire E. Physiology of SLC12 transporters: lessons from inherited human genetic mutations and genetically engineered mouse knockouts. Am. J. Physiol. Cell Physiol 304, C693–714 (2013). [DOI] [PMC free article] [PubMed] [Google Scholar]
- 7.Duarte JD & Cooper-DeHoff RM Mechanisms for blood pressure lowering and metabolic effects of thiazide and thiazide-like diuretics. Expert Rev. Cardiovasc. Ther 8, 793–802 (2010). [DOI] [PMC free article] [PubMed] [Google Scholar]
- 8.Officers A, Coordinators for the, A. C. R. G. T. A. & Lipid-Lowering Treatment to Prevent Heart Attack, T. Major outcomes in high-risk hypertensive patients randomized to angiotensin-converting enzyme inhibitor or calcium channel blocker vs diuretic: The Antihypertensive and Lipid-Lowering Treatment to Prevent Heart Attack Trial (ALLHAT). JAMA 288, 2981–2997 (2002). [DOI] [PubMed] [Google Scholar]
- 9.Schrier RW Use of diuretics in heart failure and cirrhosis. Semin. Nephrol 31, 503–512 (2011). [DOI] [PubMed] [Google Scholar]
- 10.Markadieu N & Delpire E. Physiology and pathophysiology of SLC12A1/2 transporters. Pflug. Arch. Eur. J. Phy 466, 91–105 (2014). [DOI] [PMC free article] [PubMed] [Google Scholar]
- 11.Flemmer AW, Gimenez I, Dowd BF, Darman RB & Forbush B. Activation of the Na-K-Cl cotransporter NKCC1 detected with a phospho-specific antibody. J. Biol. Chem 277, 37551–37558 (2002). [DOI] [PubMed] [Google Scholar]
- 12.Hartmann AM & Nothwang HG Molecular and evolutionary insights into the structural organization of cation chloride cotransporters. Front. Cell. Neurosci 8, 470 (2014). [DOI] [PMC free article] [PubMed] [Google Scholar]
- 13.Payne JA Molecular operation of the cation chloride cotransporters: ion binding and inhibitor interaction. Curr. Top. Membr 70, 215–237 (2012). [DOI] [PubMed] [Google Scholar]
- 14.Gamba G. et al. Molecular cloning, primary structure, and characterization of two members of the mammalian electroneutral sodium-(potassium)-chloride cotransporter family expressed in kidney. J. Biol. Chem 269, 17713–17722 (1994). [PubMed] [Google Scholar]
- 15.Yamada J. et al. Cl- uptake promoting depolarizing GABA actions in immature rat neocortical neurones is mediated by NKCC1. J. Physiol 557, 829–841 (2004). [DOI] [PMC free article] [PubMed] [Google Scholar]
- 16.Abbas L & Whitfield TT Nkcc1 (Slc12a2) is required for the regulation of endolymph volume in the otic vesicle and swim bladder volume in the zebrafish larva. Development 136, 2837–2848 (2009). [DOI] [PMC free article] [PubMed] [Google Scholar]
- 17.Flagella M. et al. Mice lacking the basolateral Na-K-2Cl cotransporter have impaired epithelial chloride secretion and are profoundly deaf. J. Biol. Chem 274, 26946–26955 (1999). [DOI] [PubMed] [Google Scholar]
- 18.Somasekharan S, Tanis J & Forbush B. Loop diuretic and ion-binding residues revealed by scanning mutagenesis of transmembrane helix 3 (TM3) of Na-K-Cl cotransporter (NKCC1). J. Biol. Chem 287, 17308–17317 (2012). [DOI] [PMC free article] [PubMed] [Google Scholar]
- 19.Moore-Hoon ML & Turner RJ The structural unit of the secretory Na+-K+−2Cl- cotransporter (NKCC1) is a homodimer. Biochemistry 39, 3718–3724 (2000). [DOI] [PubMed] [Google Scholar]
- 20.Pedersen M, Carmosino M & Forbush B. Intramolecular and intermolecular fluorescence resonance energy transfer in fluorescent protein-tagged Na-K-Cl cotransporter (NKCC1): sensitivity to regulatory conformational change and cell volume. J. Biol. Chem 283, 2663–2674 (2008). [DOI] [PubMed] [Google Scholar]
- 21.Yamashita A, Singh SK, Kawate T, Jin Y & Gouaux E. Crystal structure of a bacterial homologue of Na+/Cl--dependent neurotransmitter transporters. Nature 437, 215–223 (2005). [DOI] [PubMed] [Google Scholar]
- 22.Ye ZY, Li DP, Byun HS, Li L & Pan HL NKCC1 upregulation disrupts chloride homeostasis in the hypothalamus and increases neuronal activity-sympathetic drive in hypertension. J. Neurosci 32, 8560–8568 (2012). [DOI] [PMC free article] [PubMed] [Google Scholar]
- 23.Gupta K. et al. The role of interfacial lipids in stabilizing membrane protein oligomers. Nature 541, 421–424 (2017). [DOI] [PMC free article] [PubMed] [Google Scholar]
- 24.Isenring P & Forbush B 3rd. Ion and bumetanide binding by the Na-K-Cl cotransporter. Importance of transmembrane domains. J. Biol. Chem 272, 24556–24562 (1997). [DOI] [PubMed] [Google Scholar]
- 25.Gagnon KB, England R & Delpire E. A single binding motif is required for SPAK activation of the Na-K-2Cl cotransporter. Cell. Physiol. Biochem 20, 131–142 (2007). [DOI] [PubMed] [Google Scholar]
- 26.Parvin MN, Gerelsaikhan T & Turner RJ Regions in the cytosolic C-terminus of the secretory Na(+)-K(+)-2Cl(−) cotransporter NKCC1 are required for its homodimerization. Biochemistry 46, 9630–9637 (2007). [DOI] [PubMed] [Google Scholar]
- 27.Nezu A, Parvin MN & Turner RJ A conserved hydrophobic tetrad near the C terminus of the secretory Na+-K+−2Cl- cotransporter (NKCC1) is required for its correct intracellular processing. J. Biol. Chem 284, 6869–6876 (2009). [DOI] [PMC free article] [PubMed] [Google Scholar]
- 28.Monette MY & Forbush B. Regulatory activation is accompanied by movement in the C terminus of the Na-K-Cl cotransporter (NKCC1). J. Biol. Chem 287, 2210–2220 (2012). [DOI] [PMC free article] [PubMed] [Google Scholar]
- 29.Rinehart J. et al. Sites of regulated phosphorylation that control K-Cl cotransporter activity. Cell 138, 525–536 (2009). [DOI] [PMC free article] [PubMed] [Google Scholar]
- 30.Warmuth S, Zimmermann I & Dutzler R. X-ray structure of the C-terminal domain of a prokaryotic cation-chloride cotransporter. Structure 17, 538–546 (2009). [DOI] [PubMed] [Google Scholar]
- 31.Parvin MN & Turner RJ Identification of key residues involved in the dimerization of the secretory Na(+)-K(+)-2Cl(−) cotransporter NKCC1. Biochemistry 50, 9857–9864 (2011). [DOI] [PMC free article] [PubMed] [Google Scholar]
- 32.Harding MM Metal-ligand geometry relevant to proteins and in proteins: sodium and potassium. Acta Crystallogr. D Biol. Crystallogr 58, 872–874 (2002). [DOI] [PubMed] [Google Scholar]
- 33.Krishnamurthy H, Piscitelli CL & Gouaux E. Unlocking the molecular secrets of sodium-coupled transporters. Nature 459, 347–355 (2009). [DOI] [PMC free article] [PubMed] [Google Scholar]
- 34.Faham S. et al. The crystal structure of a sodium galactose transporter reveals mechanistic insights into Na+/sugar symport. Science 321, 810–814 (2008). [DOI] [PMC free article] [PubMed] [Google Scholar]
- 35.Weyand S. et al. Structure and molecular mechanism of a nucleobase-cation-symport-1 family transporter. Science 322, 709–713 (2008). [DOI] [PMC free article] [PubMed] [Google Scholar]
- 36.Wahlgren WY et al. Substrate-bound outward-open structure of a Na(+)-coupled sialic acid symporter reveals a new Na(+) site. Nat. Commun 9, 1753 (2018). [DOI] [PMC free article] [PubMed] [Google Scholar]
- 37.Perez C, Koshy C, Yildiz O & Ziegler C. Alternating-access mechanism in conformationally asymmetric trimers of the betaine transporter BetP. Nature 490, 126–130 (2012). [DOI] [PubMed] [Google Scholar]
- 38.Dutzler R, Campbell EB & MacKinnon R. Gating the selectivity filter in ClC chloride channels. Science 300, 108–112 (2003). [DOI] [PubMed] [Google Scholar]
- 39.Knoers NV Gitelman syndrome. Adv. Chronic Kidney Dis 13, 148–154 (2006). [DOI] [PubMed] [Google Scholar]
- 40.Wang L, Dong C, Xi YG & Su X. Thiazide-sensitive Na+-Cl- cotransporter: genetic polymorphisms and human diseases. Acta Biochim. Biophys. Sin 47, 325–334 (2015). [DOI] [PubMed] [Google Scholar]
- 41.Alguel Y, Cameron AD, Diallinas G & Byrne B. Transporter oligomerization: form and function. Biochem. Soc. Trans 44, 1737–1744 (2016). [DOI] [PMC free article] [PubMed] [Google Scholar]
- 42.Kowarz E, Loscher D & Marschalek R. Optimized Sleeping Beauty transposons rapidly generate stable transgenic cell lines. Biotechnol. J 10, 647–653 (2015). [DOI] [PubMed] [Google Scholar]
- 43.Zheng SQ et al. MotionCor2: anisotropic correction of beam-induced motion for improved cryo-electron microscopy. Nat. Methods 14, 331–332 (2017). [DOI] [PMC free article] [PubMed] [Google Scholar]
- 44.Rohou A & Grigorieff N. CTFFIND4: Fast and accurate defocus estimation from electron micrographs. J. Struct. Biol 192, 216–221 (2015). [DOI] [PMC free article] [PubMed] [Google Scholar]
- 45.Ru H. et al. Molecular Mechanism of V(D)J Recombination from Synaptic RAG1-RAG2 Complex Structures. Cell 163, 1138–1152 (2015). [DOI] [PMC free article] [PubMed] [Google Scholar]
- 46.Scheres SH RELION: implementation of a Bayesian approach to cryo-EM structure determination. J. Struct. Biol 180, 519–530 (2012). [DOI] [PMC free article] [PubMed] [Google Scholar]
- 47.Zivanov J. et al. New tools for automated high-resolution cryo-EM structure determination in RELION-3. Elife 7 (2018). [DOI] [PMC free article] [PubMed] [Google Scholar]
- 48.Nakane T, Kimanius D, Lindahl E & Scheres SH Characterisation of molecular motions in cryo-EM single-particle data by multi-body refinement in RELION. Elife 7 (2018). [DOI] [PMC free article] [PubMed] [Google Scholar]
- 49.Swint-Kruse L & Brown CS Resmap: automated representation of macromolecular interfaces as two-dimensional networks. Bioinformatics 21, 3327–3328 (2005). [DOI] [PubMed] [Google Scholar]
- 50.Lyumkis D, Brilot AF, Theobald DL & Grigorieff N. Likelihood-based classification of cryo-EM images using FREALIGN. J. Struc. Biol 183, 377–388 (2013). [DOI] [PMC free article] [PubMed] [Google Scholar]
- 51.Källberg M. et al. Template-based protein structure modeling using the RaptorX web server. Nat. Protoc 7, 1511 (2012). [DOI] [PMC free article] [PubMed] [Google Scholar]
- 52.Emsley P, Lohkamp B, Scott WG & Cowtan K. Features and development of Coot. Acta Crystallogr. D Biol. Crystallogr 66, 486–501 (2010). [DOI] [PMC free article] [PubMed] [Google Scholar]
- 53.Waterhouse A. et al. SWISS-MODEL: homology modelling of protein structures and complexes. Nucleic Acids Res. 46, W296–W303 (2018). [DOI] [PMC free article] [PubMed] [Google Scholar]
- 54.Adams PD et al. PHENIX: a comprehensive Python-based system for macromolecular structure solution. Acta Crystallogr. D Biol. Crystallogr 66, 213–221 (2010). [DOI] [PMC free article] [PubMed] [Google Scholar]
- 55.Chen VB et al. MolProbity: all-atom structure validation for macromolecular crystallography. Acta Crystallogr. D Biol. Crystallogr 66, 12–21 (2010). [DOI] [PMC free article] [PubMed] [Google Scholar]
- 56.Betz RM Dabble. 10.5281/zenodo.836914 (2018). [DOI]
- 57.Huang J. et al. CHARMM36m: an improved force field for folded and intrinsically disordered proteins. Nat. Methods 14, 71–73 (2017). [DOI] [PMC free article] [PubMed] [Google Scholar]
- 58.Klauda JB et al. Update of the CHARMM All-Atom Additive Force Field for Lipids: Validation on Six Lipid Types. J. Phys. Chem. B 114, 7830–7843 (2010). [DOI] [PMC free article] [PubMed] [Google Scholar]
- 59.Salomon-Ferrer R, Gotz AW, Poole D, Le Grand S & Walker RC Routine Microsecond Molecular Dynamics Simulations with AMBER on GPUs. 2. Explicit Solvent Particle Mesh Ewald. J. Chem. Theory Comput 9, 3878–3888 (2013). [DOI] [PubMed] [Google Scholar]
- 60.AMBER 2017. (University of California, San Francisco).
- 61.Hopkins CW, Le Grand S, Walker RC & Roitberg AE Long-Time-Step Molecular Dynamics through Hydrogen Mass Repartitioning. J. Chem. Theory Comput 11, 1864–1874 (2015). [DOI] [PubMed] [Google Scholar]
- 62.Ryckaert J, Ciccotti G, Berendsen HJ Numerical integration of the cartesian equations of motion of a system with constraints: molecular dynamics of n-alkanes. J. Comput. Phys 23, 327–341 (1977). [Google Scholar]
- 63.Humphrey W, Dalke A & Schulten K. VMD: Visual molecular dynamics. J. Mol. Graph. Model 14, 33–38 (1996). [DOI] [PubMed] [Google Scholar]
- 64.Roe DR & Cheatham TE 3rd. PTRAJ and CPPTRAJ: Software for Processing and Analysis of Molecular Dynamics Trajectory Data. J. Chem. Theory Comput 9, 3084–3095 (2013). [DOI] [PubMed] [Google Scholar]
Associated Data
This section collects any data citations, data availability statements, or supplementary materials included in this article.


