Abstract
At least two members of the Toll-like receptor (TLR) family, TLR7 and TLR9, can recognize self-RNA or DNA, respectively. Despite the structural and functional similarities between these receptors, their contribution to autoimmune diseases such as systemic lupus erythematosus (SLE) can be quite different. For example, TLR7 and TLR9 have opposing effects in mouse models of SLE; disease is exacerbated in TLR9-deficient mice but attenuated in TLR7-deficient mice1. However, mechanisms of negative regulation that differentiate between TLR7 and TLR9 have not been described. Here we report a new function for the TLR trafficking chaperone Unc93b1 that specifically limits signaling of TLR7, but not TLR9, and prevents TLR7-dependent autoimmunity in mice. We find that mutations in Unc93b1 leading to enhanced TLR7 signaling also disrupt binding to Syntenin-1, a protein implicated in exosome biogenesis. Both Unc93b1 and TLR7 are detectable in exosomes, suggesting that Unc93b1 recruitment of Syntenin-1 facilitates sorting of TLR7 into intralumenal vesicles of multivesicular bodies which terminates signaling. Syntenin-1 binding requires phosphorylation of Unc93b1, providing a mechanism for dynamic regulation of TLR7 activation and signaling. Thus, Unc93b1 not only enables proper trafficking of nucleic acid-sensing TLRs but also sets the activation threshold of potentially self-reactive TLR7.
Recognition of nucleic acids enables detection of diverse pathogens by a limited number of innate immune receptors but also exposes the host to potential autoimmunity2,3. Compartmentalized activation of nucleic acid-sensing TLRs in endosomes enables discrimination between microbial- and self-derived ligands2–8. Multiple mechanisms cooperate to establish this compartmentalization3, yet the molecular pathways that control the expression, trafficking, and signaling of these potentially self-reactive TLRs are still being defined. Moreover, mouse models have suggested distinct regulatory mechanisms control TLR7 and TLR9 activation and/or signaling in the context of autoimmunity1,3,9–12.
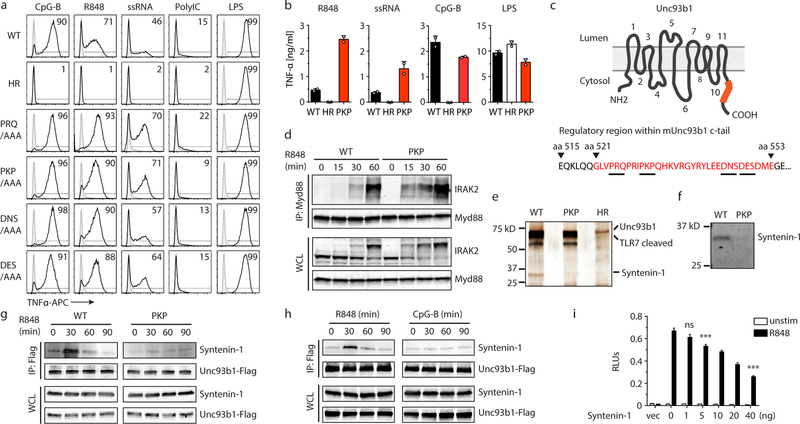
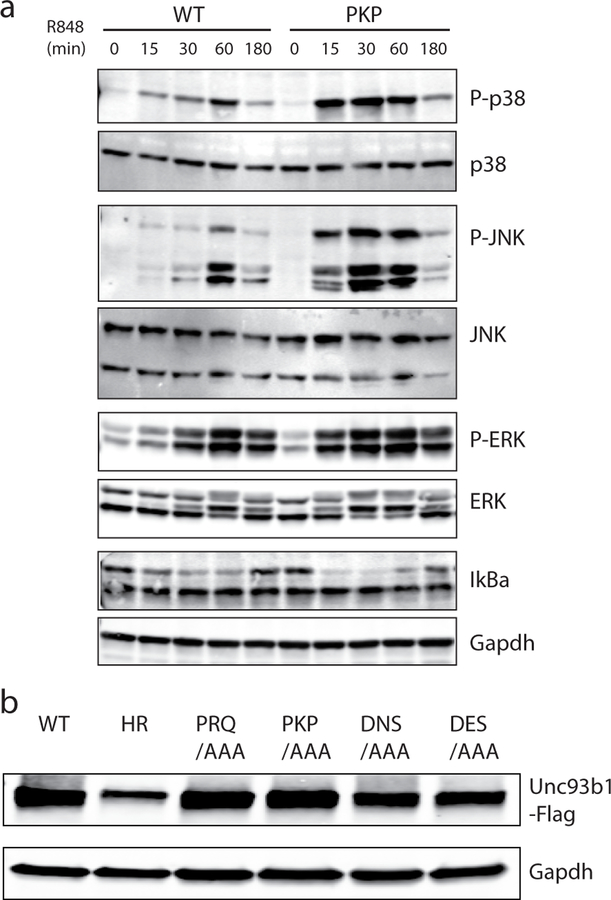
To uncover such mechanisms, we investigated Unc93b1, a trafficking chaperone that is required for TLRs to exit the ER and traffic to endosomes13–15. The continued association of Unc93b1 with TLRs after leaving the ER15 suggested to us that this protein may mediate additional regulatory steps, so we performed a scanning-alanine mutagenesis screen of Unc93b1 in RAW macrophages stimulated with ligands for TLRs. The screen identified several mutations PRQ(524–526)/AAA, PKP(530–532)/AAA, DNS(545–547)/AAA and DES(548–550)/AAA that enhanced TLR7 responses relative to cells expressing wildtype Unc93b1, without affecting TLR3 or TLR9 responses (Fig. 1a,b). Non-functional Unc93b1H412R served as negative control16. These mutations were all within a 33 aa region in the Unc93b1 C-terminal tail (residues 521 to 553) (Fig. 1c), suggesting that the phenotypes associated with these mutants may be linked through a common mechanism. Unc93b1PKP/AAA (hereafter referred to as Unc93b1PKP) cells displayed enhanced activation of MAPKs (p38, JNK and ERK) as well as stronger degradation of IκBα (Extended Data Fig. 1a). Moreover, assembly of the Myddosome complex, the most proximal signaling step downstream of TLR7 activation, was increased in mutant cells (Fig. 1d). This enhanced signaling was not due to differences in the expression or stability of the Unc93b1 mutants, as protein levels were similar among the RAW macrophage lines (Extended Data Fig. 1b).
Fig. 1: Syntenin-1 binds to the C-terminal tail of Unc93b1 and restricts TLR7 signaling.
(a) Intracellular cytokine staining of TNFα in macrophage lines expressing the indicated Unc93b1 alleles and stimulated with CpG-B (100 nM), R848 (10 ng/ml), ssRNA40 (2.5 µg/ml), PolyIC (20 µg/ml), or LPS (10 ng/ml). Shaded histograms are unstimulated controls. HR: Unc93b1H412R. (b) TNFα production, measured by ELISA, from the indicated RAW macrophage lines after stimulation for 8h with R848 (10 ng/ml), ssRNA40 (1 µg/ml), CpG-B (25 nM), or LPS (50 ng/ml). Data are mean ± s.d., n=2 biological replicates. PKP: Unc93b1PKP/AAA. (c) Topology of Unc93b1 with the C-terminal regulatory region indicated in orange. (d) Immunoprecipitation (IP) of MyD88 from RAW macrophage lines expressing the indicated Unc93b1-Flag alleles and stimulated with R848 (500 ng/ml) followed by immunoblot for IRAK2. Input levels of Myd88 and IRAK2 in whole cell lysates (WCL) are also shown. (e) Silver stained SDS-PAGE gel of purified Unc93b1-Flag complexes from phagosomes of RAW macrophages expressing the indicated Unc93b1-Flag alleles. The 32kD protein corresponding to Syntenin-1 is indicated. (f) Purified Unc93b1-Flag complexes described in (e) were immunoblotted for Syntenin-1. (g) Syntenin-1 binding to Unc93b1 was measured by Flag IP followed by immunoblot for Syntenin-1 from the indicated RAW macrophage lines stimulated with R848 (0.5 μg/ml). (h) Interaction between Syntenin-1 and Unc93b1 was measured as described in (g) from Unc93b1WT RAW macrophages stimulated with R848 (0.5 μg/ml) or CpG-B (0.5 μM). (i) NFκB activation in HEK293T cells transiently expressing TLR7 and increasing amounts of Syntenin-1 was measured using a dual luciferase reporter assay. Cells were stimulated with R848 (50 ng/ml) for 16h prior to harvest. RLUs: relative luciferase units, normalized to Renilla expression (n=3 biological replicates). One-way ANOVA, ***p<0.0001. All data are representative of at least three independent experiments.
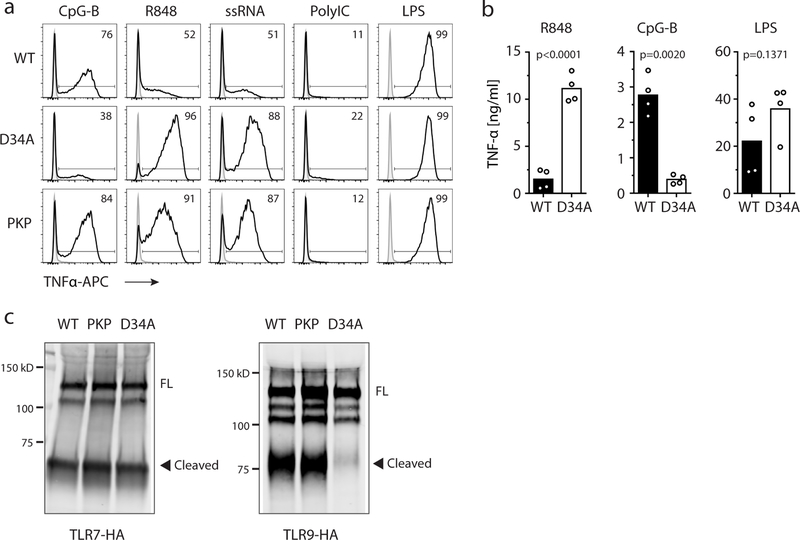
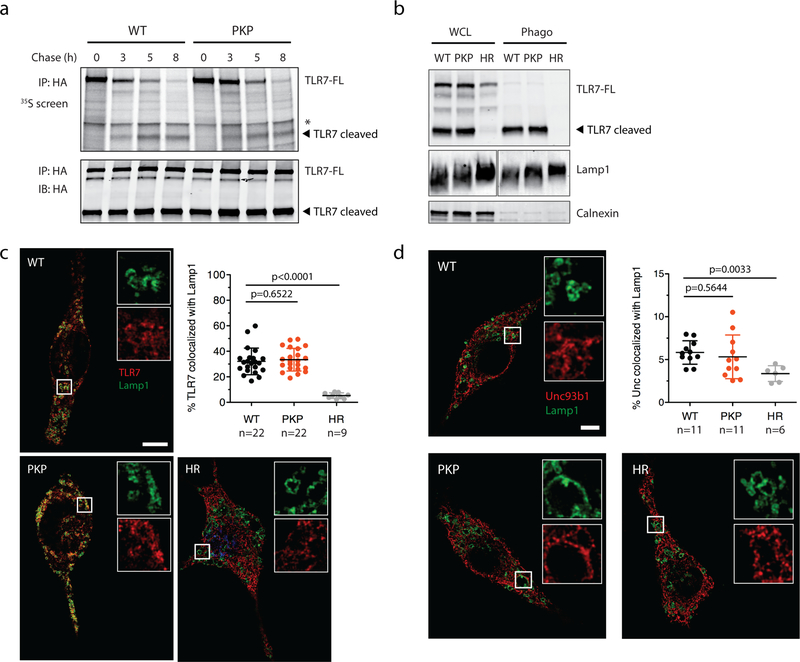
A previously described mutation (D34A) near the N-terminus of Unc93b1 enhances TLR7 signaling by increasing TLR7 export from the ER at the expense of TLR917,18. However, unlike Unc93b1D34A, trafficking of both TLR7 and TLR9 appeared normal in Unc93b1PKP-expressing cells, as shown by normal amounts of cleaved endosomal receptor (Extended Data Fig. 2a–c). Pulse/chase analysis of TLR7 showed that ectodomain cleavage of TLR7 occurred with normal kinetics in Unc93b1PKP cells (Extended Data Fig. 3a), and TLR7 levels were similar in phagosomes isolated from Unc93b1WT- and Unc93b1PKP cells (Extended Data Fig. 3b), suggesting that TLR7 trafficking to endosomes is generally equivalent. We also considered the possibility that Unc93b1PKP alters TLR7 sub-cellular localization, thereby enhancing accessibility to ligand. However, colocalization between TLR7 and the late endosomal marker Lamp1 was similar in cells expressing Unc93b1WT and Unc93b1PKP but much reduced in cells expressing non-functional Unc93b1H412R (Extended Data Fig. 3c). Also, Unc93b1PKP itself colocalized normally with Lamp1 (Extended Data Fig. 3d). Altogether, these results suggest that the C-terminal tail of Unc93b1 specifically regulates TLR7 activation through a novel mechanism.
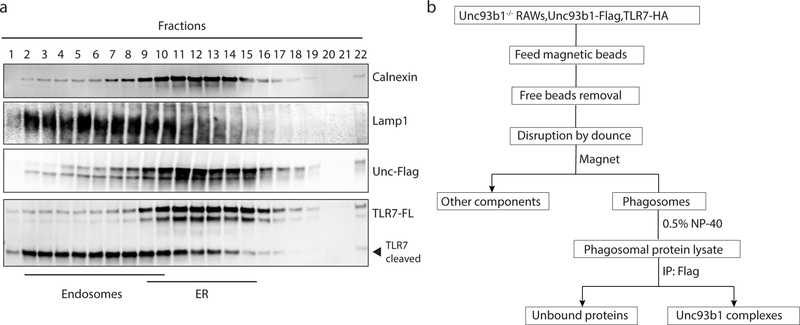
To test whether Unc93b1 interferes with TLR7 signaling through association with an unknown negative regulator, we searched for proteins that interact with Unc93b1WT but not Unc93b1PKP. One challenging aspect of this approach is the relatively small fraction (<5%) of Unc93b1 in endosomes relative to the ER (Extended Data Figs. 3d and 4a). To overcome this obstacle, we enriched for the endosomal pool of Unc93b1 by first isolating phagosomes from RAW cells followed by purification of Unc93b1 protein complexes via anti-Flag antibodies (see scheme in Extended Data Fig. 4b). This approach revealed an approximately 32kDa band present in Unc93b1WT samples that was reduced in Unc93b1PKP samples (Fig. 1e). We used tandem mass spectrometry to identify this band as Syntenin-1 (also known as syndecan binding protein, SDCBP), which we confirmed by immunoblot, using an anti-Syntenin-1 monoclonal antibody (Fig. 1f).
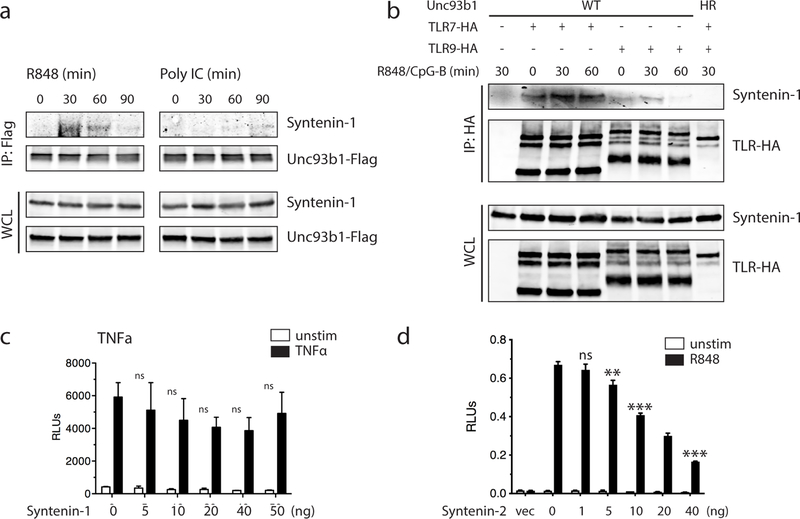
Syntenin-1 is a PDZ domain-containing adaptor protein that can influence trafficking of transmembrane proteins19 but has also been reported to regulate assembly of signaling complexes, including signaling downstream of TLRs20. Upon stimulation of TLR7, the association of Syntenin-1 with Unc93b1WT was rapidly and transiently increased, whereas the interaction with Unc93b1PKP did not increase (Fig. 1g). In line with Unc93b1PKP having no effect on TLR9 or TLR3 signaling, there was no increased association between Unc93b1 and Syntenin-1 after stimulation with CpG-B or PolyI:C, respectively (Fig. 1h and Extended Data Fig. 5a). Likewise, Syntenin-1 coimmunoprecipitated with TLR7 but not with TLR9 (Extended Data Fig. 5b). A previous study reported that overexpression of Syntenin-1 can inhibit TLR4 and IL-1 receptor (IL-1R) signaling by interfering with the interaction between IRAK-1 and TRAF620. We observed that overexpression of Syntenin-1 also inhibited TLR7 signaling (Fig. 1i), whereas TNFR signaling was not as affected (Extended Data Fig. 5c). Similar results were obtained with the closely related Syntenin-2 protein (Extended Data Fig. 5d). However, we could not reproduce the reported interaction between Syntenin-1 and IRAK-1 or TRAF6 (data not shown).
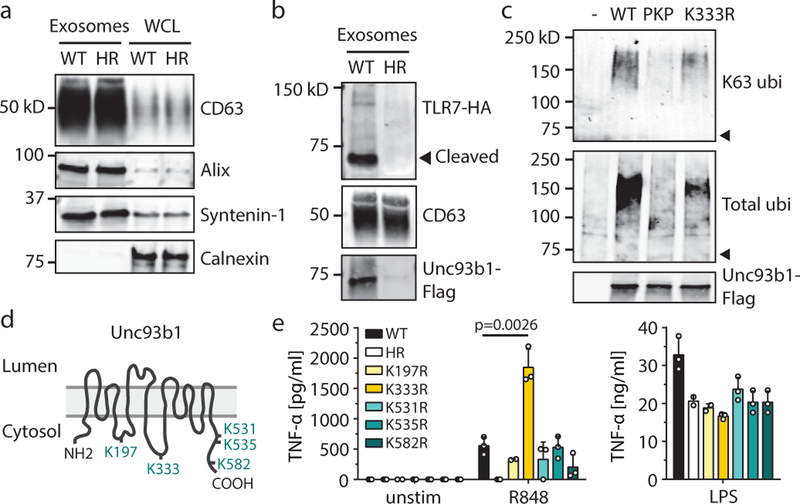
Syntenin-1 has also been implicated in the ESCRT-mediated uptake of specific transmembrane receptors into intralumenal vesicles (ILVs) of MVBs21,22. This process can terminate receptor signaling23, so we considered whether this mechanism could explain how Unc93b1 dampens TLR7 signaling. To probe ILV contents for TLR7 and Unc93b1, we purified exosomes from the supernatants of RAW cells. Exosome preparations were enriched for classic ILV markers, such as CD63, Alix, and Syntenin-124, and lacked markers of other organelles (Fig. 2a). TLR7 and Unc93b1 were present in exosomes from Unc93b1WT cells, but absent in exosomes isolated from Unc93b1H412R-expressing cells (Fig. 2b). These results indicate that TLR7 is loaded into ILVs and that this loading requires functional Unc93b1.
Fig. 2: Unc93b1-TLR7 complexes are sorted into intralumenal vesicles of multivesicular bodies.
(a) Exosome preparations are enriched for the exosome markers CD63, Alix, and Syntenin-1, and devoid of the ER marker Calnexin. Whole cell lysates (WCL) or lysates of exosomes from Unc93b1WT and Unc93b1HR-expressing RAW macrophages were probed with antibodies against the indicated proteins. Equivalent amounts of total protein were loaded per lane. (b) Sorting of TLR7 into exosomes of RAW macrophages requires Unc93b1. Immunoblot for TLR7-HA and Unc93b1-Flag of exosome preparations from Unc93b1WT and Unc93b1HR-expressing RAW macrophages. Samples were normalized to CD63 levels to ensure loading of similar exosome equivalents. (c) Unc93b1-Flag was immunoprecipitated from lysates of the indicated RAW macrophage lines and total or K63-linked ubiquitylation was measured by immunoblot. Arrowheads indicate the mobility of unmodified Unc93b1. (d) Schematic showing the relative positions of lysines analyzed in (c,e). (e) TNFα production, measured by ELISA, from the indicated RAW macrophage lines after stimulation for 8h with R848 (10 ng/ml), or LPS (10 ng/ml). Bars show mean of n=3 (n=2 for K197R and HR) biological replicates, representative of two independent experiments (p-value determined by unpaired two-tailed Student’s t-test). All other data are representative of at least three independent experiments.
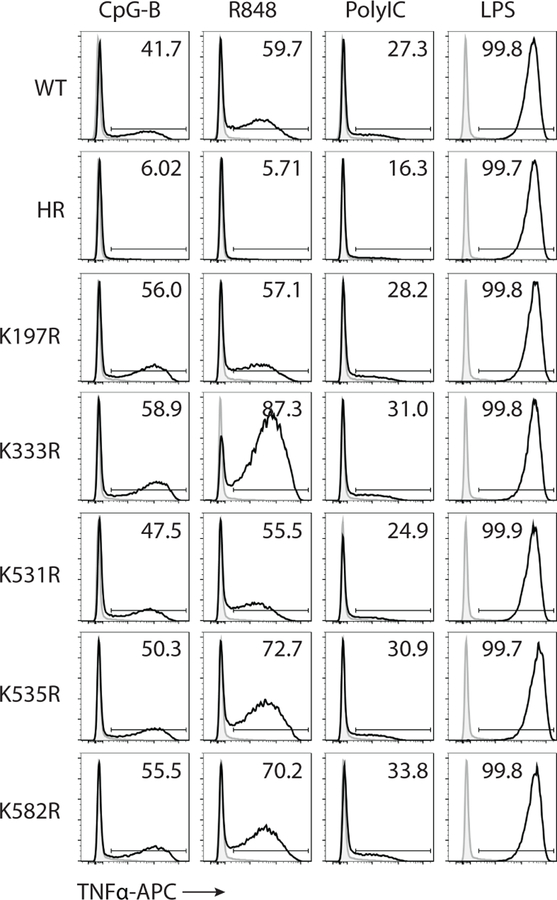
K63-linked ubiquitylation often marks cargo for sorting into ILVs25; accordingly, immunoprecipitation of Unc93b1 from RAW cells followed by immunoblotting for ubiquitin revealed K63 ubiquitylation (Fig. 2c). Ubiquitylation of Unc93b1PKP was substantially reduced, consistent with ubiquitylation and Syntenin-1 recruitment both being required for sorting into ILVs. We individually mutated five cytosolic lysine residues to arginine (Fig. 2d) and identified Lys333 as necessary for much, but not all, of the ubiquitylation of Unc93b1 (Fig. 2c). The reduced ubiquitylation of Unc93b1K333R correlated with enhanced TLR7 signaling without affecting TLR9 and TLR3, similar to the phenotype observed in Unc93b1PKP cells (Fig. 2e and Extended Data Fig. 6). Thus, Unc93b1 mutations that impact known aspects of cargo selection and sorting into ILVs lead to selective enhancement of TLR7 signaling.
Based on these results, we propose a model in which Unc93b1 recruits machinery that sorts Unc93b1-TLR7 complexes into ILVs and dampens TLR7 signaling. Sorting of TLR7 into ILVs terminates signaling by sequestering receptors away from downstream signaling components but may also lead to degradation of receptors. We could not detect changes in TLR7 protein levels in exosomes or whole cell lysates of Unc93b1PKP cells (data not shown) and suspect that steady-state turnover of TLR7 into ILVs masks the relatively small pool of activated receptors that are sorted in a Syntenin-mediated fashion post-stimulation. Indeed, the number of TLR molecules that engage ligand and become activated has previously been shown to be quite small26, and it is known that even small increases in TLR7 levels are sufficient to impact self versus non-self discrimination9,12.
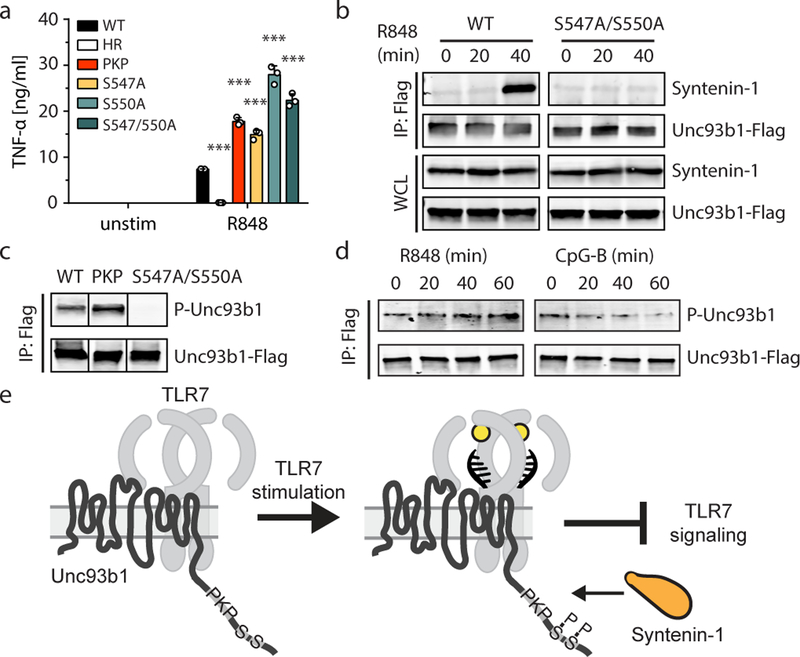
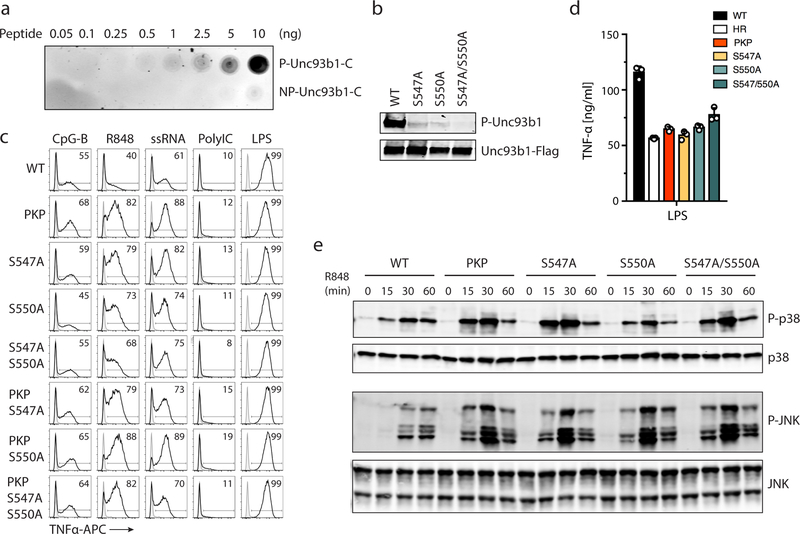
To investigate the basis of Syntenin-1 recruitment to Unc93b1, we focused on additional posttranslational modifications within the Unc93b1 C-terminal tail. Global phosphoproteomic analyses have identified Ser547 and Ser550 as potential Unc93b1 phosphorylation sites27, and alanine mutations in our original screen that included these serines (Unc93b1DNS/AAA and Unc93b1DES/AAA) lead to enhanced TLR7 responses (Fig. 1a). Single mutations of Ser547 (Unc93b1S547A), Ser550 (Unc93b1S550A), or both serines (Unc93b1S547A/S550A) were sufficient to enhance TLR7 responses to levels comparable to Unc93b1PKP without affecting other TLRs (Fig. 3a and Extended Data Fig. 7c–e). Using phospho-specific Unc93b1 antibodies raised against Ser547 and Ser550 (Extended Data Fig. 7a), we confirmed that Unc93b1 is indeed phosphorylated at these residues in RAW cells; mutation of either serine reduced detection by the phospho-specific antibody, while mutation of both serines completely abrogated detection (Extended Data Fig. 7b). Combining the Unc93b1PKP mutation with Unc93b1S547A, Unc93b1S550A, or Unc93b1S547A/S550A did not further enhance TLR7 responses (Extended Data Fig. 7c), suggesting that each mutation acts by disrupting the same mechanism. Indeed, Syntenin-1 recruitment to Unc93b1 after R848 stimulation was impaired in Unc93b1S547A/S550A-expressing cells (Fig. 3b). To determine if the failure of Unc93b1PKP to recruit Syntenin-1 results from absent phosphorylation, we examined phosphorylation of Ser547 and Ser550 in Unc93b1PKP-expressing cells. Phosphorylation levels were equivalent to Unc93b1WT cells (Fig. 3c), ruling out a failure of Unc93b1PKP to engage with the respective kinase(s). Furthermore, Unc93b1 phosphorylation increased upon TLR7 stimulation with similar kinetics as Syntenin-1 recruitment (Fig. 3d). This increase was specific to TLR7 and did not occur after TLR9 stimulation (Fig. 3d). These results support a model in which Syntenin-1 binding to Unc93b1 requires specific residues within the C-terminal tail as well as phosphorylation of Ser547 and Ser550 (Fig. 3e). While some Syntenin-1 is associated with Unc93b1 in unstimulated cells (consistent with the basal levels of Unc93b1 phosphorylation in resting cells), the interaction is further increased upon TLR7 signaling. Thus, the mechanism we describe appears not only to influence the initial threshold of TLR7 activation but also operates as a negative feedback loop to shut down TLR7 signaling by sorting TLR7/Unc93b1 complexes into ILVs. Defining the signals leading to this increased recruitment, including the identities of the kinases and phosphatases regulating phosphorylation of Unc93b1, will be an important aspect of future work.
Fig. 3: Serine phosphorylation in the C-terminal tail of Unc93b1 regulates Syntenin-1 recruitment.
(a) TNFα production, measured by ELISA, from the indicated RAW macrophage lines after stimulation for 8h with R848 (20 ng/ml). Bars show mean ± s.d., n=3 biological replicates, p=0.0002 for PKP, p<0.0001 for all other mutants compared to WT (unpaired two-tailed Student’s t-test). (b) Syntenin-1 binding to Unc93b1WT or Unc93b1S547A/S550A in RAW macrophages stimulated with R848 (0.5 μg/ml) was measured by Unc93b1-Flag immunoprecipitation followed by immunoblot for Syntenin-1. (c) Unc93b1-Flag was immunoprecipitated from lysates of the indicated RAW macrophage lines and phosphorylation of Ser547 and Ser550 was measured by immunoblot with phospho-specific Unc93b1 antibodies. Each blot was performed on the same membrane but cropped to present relevant lanes. (d) RAW macrophages were stimulated with R848 (0.5 μg/ml) or CpG-B (0.5 µM) and Unc93b1 phosphorylation was measured by immunoblot after Unc93b1-Flag immunoprecipitation. (e) A model of Syntenin-1 recruitment to Unc93b1. All data are representative of at least three independent experiments.
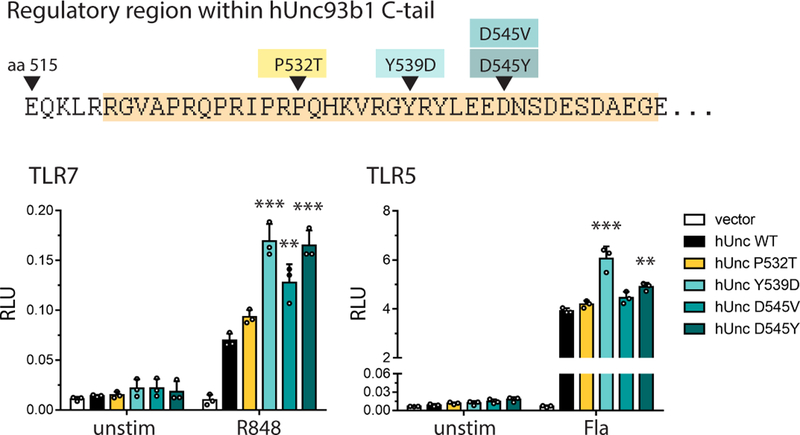
To determine if Unc93b1/Syntenin-1 regulation of TLR7 could be relevant in humans, we searched publicly available human genomic data for single nucleotide polymorphisms (SNPs) within the Unc93b1 C-terminal tail, which is highly conserved between mouse and human. Four very rare (Minor allele frequencies of 0.04% or lower, according to the 1000 Genomes project) coding variants within this region have been reported: P532T, Y539D, D545V, and D545Y. Three of the variants (Unc93b1Y539D, Unc93b1D545V, and Unc93b1D545Y) increased TLR7 responses relative to Unc93b1WT in human HEK293T cells, although Unc93b1Y539D, and to a lesser extent Unc93b1D545Y, also slightly increased TLR5 responses (Extended Data Fig. 8). These alleles are too rare to be linked to autoimmune disorders via genome-wide association studies, but the results suggest that the regulatory mechanism we describe here can influence TLR7 activation thresholds in humans and may impact the likelihood of certain autoimmune diseases.
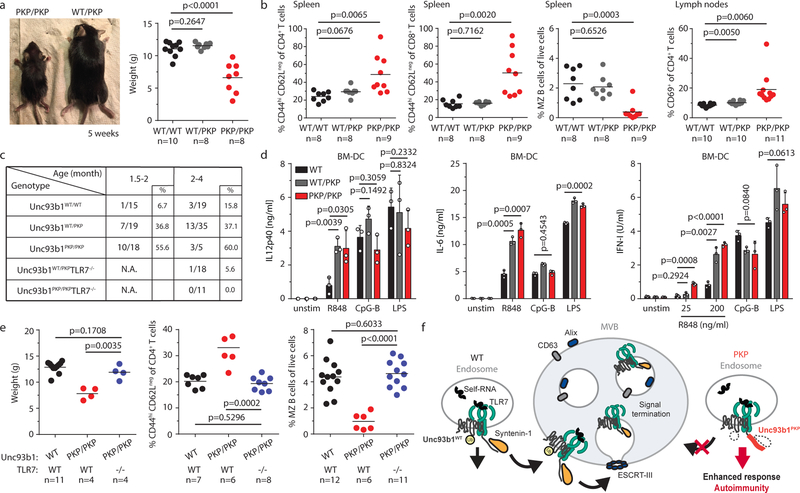
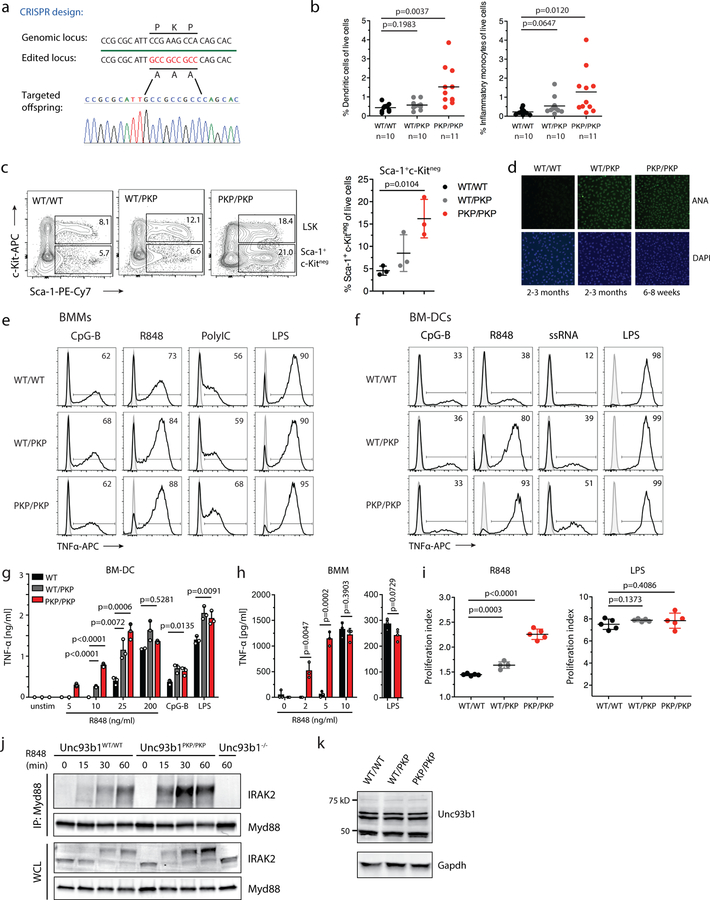
Finally, we sought to test the importance of Unc93b1/Syntenin-1 regulation of TLR7 for self versus non-self discrimination in vivo. We reasoned that analysis of Syntenin-1 deficient mice could be complicated for multiple reasons. First, Syntenin-1 has been implicated in the regulation of multiple transmembrane proteins via its role in MVB biogenesis21,22. While Syntenin-1 deficient mice show pleiotropic effects on the immune system and the microbiota28, Syntenin-2 likely compensates for Syntenin-1 deficiency. Indeed, our attempts to generate cells lacking both Syntenin-1 and Syntenin-2 suggest that the mutant cells experience severe fitness defects (data not shown). To sidestep these issues, we introduced the Unc93b1PKP mutation into the germline of mice using Cas9 genome editing (Extended Data Fig. 9a). This mutation disrupts interaction between Syntenin-1 and Unc93b1 but should leave other Syntenin-1 functions unaffected. Unc93b1PKP/PKP mice were born below the expected Mendelian frequency and were severely runted (Fig. 4a). These mice exhibited hallmarks of systemic inflammation and autoimmunity previously described in TLR7 overexpressing mice9,12,17, including increased frequencies of activated T cells, loss of marginal zone (MZ) B cells, increased frequencies of MHChi dendritic cells and inflammatory monocytes in secondary lymphoid organs, and evidence of emergency granulopoesis (Fig. 4b and Extended Data Fig. 9b,c). Unc93b1PKP/PKP mice developed anti-nuclear antibodies (ANA) very early in life (Fig. 4c and Extended Data Fig. 9d). Unc93b1WT/PKP mice also showed signs of immune dysregulation but not to the same extent as Unc93b1PKP/PKP mice (Fig. 4b–d and Extended Data Fig. 9b–g).
Fig. 4: Unc93b1PKP knock-in mice develop TLR7-driven systemic inflammation and autoimmunity.
(a) Gross appearance and weights of Unc93b1PKP/PKP mice compared to littermate controls. (b) Flow cytometric analysis of the indicated immune cell populations in spleen or lymph nodes in Unc93b1WT/WT, Unc93b1PKP/WT, and Unc93b1PKP/PKP mice at 6–8 weeks of age. Data points were pooled from four independent experiments. (c) Tabulated results showing the number and percentage of the indicated mice with anti-nuclear antibodies in their sera as measured by staining of Hep-2 slides. (d) Cells from Unc93b1PKP/WT and Unc93b1PKP/PKP mice show enhanced TLR7 responses. IL-12p40, IL-6, and IFN-I production, measured by ELISA, CBA, or bioassay, by bone marrow-derived dendritic cells (BM-DCs) derived from the indicated mice after stimulation for 8h with R848 (25 ng/ml or as indicated), CpG-B (150 nM), or LPS (50 ng/ml). Bars show mean ± s.d., n=3 biological replicates, representative of three independent experiments. (e) TLR7 deficiency rescues disease in Unc93b1PKP/PKP mice. Weights and frequencies of the indicated cell populations from 6-week-old mice with indicated genotypes are shown. Data were pooled together from three independent experiments. (f) Proposed model of Syntenin-1-mediated restriction of TLR7 signaling. Upon activation of TLR7, Syntenin-1 binding to Unc93b1 may facilitate sorting of the TLR7/Unc93b1 complex into intraluminal vesicles (ILVs) of multivesicular bodies (MVBs), which terminates TLR7 signaling. Disruption of Syntenin-1 binding (e.g., in Unc93b1PKP expressing cells) prevents the inducible sorting of TLR7/Unc93b1 into MVBs, leading to unrestrained signaling and TLR7-driven autoimmunity. Additional mechanisms responsible for the steady-state turnover of TLR7 and/or Unc93b1 are not depicted. All p-values determined by unpaired two-tailed Student’s t-test.
Bone marrow-derived dendritic cells, macrophages, and B cells from Unc93b1WT/PKP and Unc93b1PKP/PKP mice mounted stronger responses to TLR7 ligands compared to Unc93b1WT/WT cells, while responses to TLR9 and TLR4 ligands were equivalent (Fig. 4d and Extended Data Fig. 9e–i). In line with the enhanced cytokine production, macrophages from Unc93b1PKP/PKP mice showed stronger assembly of the Myddosome complex downstream of TLR7 activation (Extended Data Fig. 9j). These enhanced TLR7 responses were not due to differences in Unc93b1 expression, as Unc93b1 protein levels in BMMs were similar across all genotypes. (Extended Data Fig. 9k). Consistent with TLR7-driven disease, lack of TLR7 completely rescued disease in Unc93b1PKP/PKP mice; all parameters measured were equivalent between Unc93b1PKP/PKPTlr7−/− and Unc93b1WT/WT mice (Fig. 4c,e).
Altogether, our findings identify a new regulatory mechanism of Unc93b1 that specifically limits TLR7 signaling and prevents TLR7-driven autoimmunity. We propose a model whereby the C-terminal tail of Unc93b1 binds the adaptor protein Syntenin-1, which facilitates sorting of recently-activated TLR7 into ILVs of MVBs for protein turnover and/or sequestration and limits signaling in response to self RNA (Fig. 4f). It is likely that additional mechanisms can contribute to turnover of endosomal TLRs. In fact, in an accompanying paper, we demonstrate that TLR9 and TLR3, unlike TLR7, are released from Unc93b1 within endosomes29, which rules out the involvement of Unc93b1 in directly regulating degradation of these TLRs. This release mechanism may explain why Unc93b1 mutations that disrupt Syntenin-1 binding, as well as Unc93b1 ubiquitylation or phosphorylation, do not impact TLR9 or TLR3 signaling, which is particularly interesting when considering the differential roles played by TLR7 and TLR9 in mouse models of SLE1. Even more intriguing is the possibility that Syntenin-1 recruitment to Unc93b1 can be dynamically controlled through phosphorylation. Identifying the players involved in this regulation should reveal critical determinants that influence self versus non-self discrimination and the development of autoimmunity.
Methods
Antibodies and Reagents
The following antibodies were used for immunoblots and immunoprecipitations: anti-HA as purified antibody or matrix (3F10, Roche), anti-FLAG as purified antibody or matrix (M2, Sigma-Aldrich), anti-mLamp-1 (AF4320, R&D Systems), anti-Calnexin (ADI-SPA-860, Enzo Life Sciences), anti-Gapdh (GT239, GeneTex), anti-Myd88 (AF3109, R&D Systems), anti-IRAK2 (Cell Signaling), anti-Phospho-p38 (Cell Signaling), anti-p38 (Cell Signaling), anti-Phospho-SAPK/JNK (81E11, Cell Signaling), anti-SAPK/JNK (56G8, Cell Siganling), anti-Phospho-p44/42 (ERK1/2) (D13.14.4E, Cell Signaling), anti-p44/42 (ERK1/2) (137F5, Cell Siganling), anti-IκBα (Cell Signaling), anti-Syntenin-1 (2C12, Novusbio), anti-Unc93b1 (PA5–20510, Thermo Scientific), anti-ubiquitin (P4D1, Santa Cruz), anti-K63-linked ubiquitin (human polyclonal, kind gift from Michael Rape), goat anti-mouse IgG-AlexaFluor680 (Invitrogen), goat anti-mouse IgG-AlexaFluor680 (Invitrogen), rabbit anti-goat IgG-AlexaFluor680 (Invitrogen), goat anti-human IRDye 680RD (Licor), goat anti-mouse IRDye 800CW (Licor), donkey anti-rabbit IRDye 680RD (Licor), goat anti-rat IRDye 800CW (Licor). Antibodies for immunofluorescence were: rat anti-HA (3F10, Roche), rabbit anti-Lamp1 (ab24170, Abcam), goat anti-rat IgG-AlexaFluor488 (Jackson Immunoresearch), goat anti-rabbit IgG-AlexaFluor647 (Jackson Immunoresearch). Cells were mounted in Vectashield Hard Set Mounting Medium for Fluorescence (Vector Laboratories). For ELISA: anti-mouse TNFα purified (1F3F3D4, eBioscience), anti-mouse TNFα-biotin (XT3/XT22, eBioscience), Streptavidin-HRP (BD Pharmingen). Antibodies and reagents used for flow cytometry were: anti-TNFα (MP6-XT22, eBioscience), purified anti-CD16/32 Fc Block (2.4G2), CD3ε (145–2C11, BioLegend), CD4 (GK1.5, BioLegend), CD8 (53–6.7, BioLegend), CD44 (IM7, eBioscience), CD62L (MEL-14, eBioscience), CD69 (H1.2F3, eBioscience), CD1d (1B1, eBioscience), B220 (RA3–6B2, Invitrogen), CD19 (6D5, BioLegend), IgD (11–26c.2a, BioLegend), IgM (eB121–15F9, eBioscience), CD21 (eBio8D9, eBioscience), CD23 (B3B4, eBioscience), CD138 (281–2, BioLegend), CD11b (M1/70, BioLegend), Ly6G (1A8, TONBO biosciences), Ly6C (HK1.4, BioLegend), F4/80 (CI:A3–1, AbD serotec), MHCII (M5/114.15.2, eBioscience), CD86 (GL1, eBioscience), CD11c (N418, BioLegend), CD117 (c-Kit) (2B8, eBioscience), Sca-1 (D7, eBioscience). For ANA detection: anti-mouse IgG-AlexaFluor 488 (Jackson Immunoresearch), anti-mouse IgM-FITC (Invitrogen).
The antibody against phosphorylated Unc93b1 was generated by Invitrogen against synthesized phospho-peptide (YLEEDN(pS)DE(pS)DMEGEQ) using their “Rabbit, 90-Day immunization” protocol. Antibody in sera was enriched with immobilized phospho-peptide, followed by negative absorption with unphosphorylated peptide.
CpG-B (ODN1668: TCCATGACGTTCCTGATGCT, all phosphorothioate linkages) was synthesized by Integrated DNA Technologies. R848, PolyIC HMW, ssRNA40/LyoVec, and LPS were purchased from InvivoGen. Human IL-1b was from Invitrogen. NP-40 (Igepal CA-630) was from Sigma-Aldrich. Lipofectamine-LTX reagent (Invitrogen) and OptiMEM-I (Invitrogen) were used for transfection of plasmid DNA. ProMag 1 Series-COOH Surfactant free magnetic beads (#25029) for phagosome preparations were purchased from Polysciences. For luciferase assays: Renilla substrate: Coelenterazine native (Biotum), Firefly substrate: Luciferin (Biosynth), Passive Lysis Buffer, 5x (Promega).
Animals
Mice were housed under specific-pathogen-free conditions at the University of California, Berkeley. All mouse experiments were performed in accordance with the guidelines of the Animal Care and Use Committee at UC Berkeley. Unless noted mice were analyzed at 5–8 weeks of age. C57BL/6J and TLR7−/− mice (on the C57BL/6J background) were from the Jackson Laboratory. Unc93b1PKP mice were generated using Cas9 genome editing. The guide RNA used was: TGCTGTGGCTTCGGAATGCGCGG. The single stranded oligo template contained 60bp homology arms on both sides and four phosphothioate linkages at the ends (one at the 5’ and three at the 3’ end of the oligo). Briefly, female C57BL/6J mice at 4 weeks of age were superovulated and mated overnight with C57BL/6J male mice (>8 weeks old). Zygotes were harvested from superovulated females and were placed in KSOM medium (Millipore) before use. CRISPR/Cas9 mixture was prepared in final concentration of cas9 mRNA (100ng/ul), sgRNA (50ng/ul) and single stranded oligo (100ng/ul). The CRISPR/Cas9 mixture was microinjected into 80 zygotes using a micromanipulator (Narishige) and microscope (Nikon). After microinjection, 67 embryos were transferred to three CD1 recipients via oviduct transfer. Offspring was genotyped by sequencing for the correct targeted allele and further bred to ensure germline transmission.
Unc93b1 library design and plasmid constructs
The Unc93b1 mutagenesis library has been generated by Invitrogen. Briefly, the mouse Unc93b1 gene was optimized for the codon bias of Mus musculus and regions of very high (>80%) and very low (<30%) GC content have been avoided. The codon-optimized mouse Unc93b1 gene was c-terminally tagged with 3xFLAG (DYKDHDGDYKDHDIDYKDDDDK) and subjected to a triple-alanine scanning mutagenesis spanning sequences corresponding to tail and loop regions of the protein. The individual mutant constructs were cloned into a custom-made MSCV-based retroviral vector carrying an IRES-driven PuromycinR-T2A-mCherry double-selection. The library was provided as 204 individual plasmids.
Each Unc93b1 mutant was stably expressed in a RAW macrophage cell line in which both endogenous Unc93b1 alleles were disrupted by Cas9 genome editing. As expected, deletion of endogenous Unc93b1 led to lack of responses to nucleic acids and failure of TLR7 to traffic to endosomes (Data not shown). To evaluate TLR function in cells expressing each mutant, we stimulated each line with ligands for TLR3, TLR7, and TLR9 (Unc93b1-dependent TLRs) and TLR4 (an Unc93b1-independent TLR) and measured TNFα production.
For additional site-directed mutagenesis, AccuPrime Pfx DNA polymerase (Invitrogen) was used following the QuickChange II Site-directed Mutagenesis protocol from Agilent Technologies. The following MSCV-based retroviral vectors were used to express TLR7 and TLR9 in cell lines: MSCV2.2 (IRES-GFP), MSCV-Thy1.1 (IRES-Thy1.1), or MIGR2 (IRES-hCD2). TLR7 and TLR9 were fused to HA (YPYDVPDYA) at the C-terminal end. TLR7 sequence was synthesized after codon optimization by Invitrogen’s GeneArt Gene Synthesis service, as previously described15.
Cells and tissue culture conditions
HEK293T (from ATCC) and GP2–293 packaging cell lines (Clontech) were cultured in DMEM complete media supplemented with 10% (vol/vol) FCS, L-glutamine, penicillin-streptomycin, sodium pyruvate, and HEPES (pH 7.2–7.5) (Gibco). RAW264 macrophage cell lines (ATCC) were cultured in RPMI 1640 (same supplements as above). BMMs were differentiated for seven days in RPMI complete media (same supplements as above plus 0.00034% (vol/vol) beta-mercaptoethanol) and supplemented with 10% (vol/vol) M-CSF containing supernatant from 3T3-CSF cells. BM-DC were differentiated for seven days in RPMI complete media (same supplements as above plus 0.00034% (vol/vol) beta-mercaptoethanol) and supplemented with 2% (vol/vol) GM-CSF containing supernatant from J558L cells.
To generate HEK293T Unc93b1−/− cells, guide RNAs were designed and synthesized as gBlocks as previously described30 and then were subcloned into pUC19 (guide RNA: CTCACCTACGGCGTCTACC). Humanized Cas9–2xNLS-GFP was a gift from the Doudna laboratory, University of California, Berkeley, CA. HEK293T cells were transfected using Lipofectamine LTX with equal amounts of the guide RNA plasmid and Cas9 plasmid. Seven days post transfection cells were plated in a limiting-dilution to obtain single cells. Correct targeting was verified by PCR analysis and loss of response to TLR9 and TLR7 stimulation in an NF-κB luciferase assay. Unc93b1−/− RAW macrophages were generated with the Cas9(D10A)-GFP nickase (guide RNAs: 1) GGCGCTTGCGGCGGTAGTAGCGG, 2) CGGAGTGGTCAAGAACGTGCTGG, 3) TTCGGAATGCGCGGCTGCCGCGG, 4) AGTCCGCGGCTACCGCTACCTGG). Macrophages were transfected with Cas9(D10A) and all four guide RNAs using Lipofectamine LTX and Plus reagent and single cell-sorted on Cas9-GFP two days later. Correct targeting was verified by loss of response to TLR7 stimulation and sequencing of the targeted region after TOPO cloning. Myd88 was knocked out in Unc93b1−/− RAW macrophages stably expressing TLR7-HA and either Unc93b1WT or Unc93b1PKP. Cas9 transfection and screening of cells was performed as before, except for using Cas9–2xNLS-GFP (guide RNA: GGTTCAAGAACAGCGATAGG).
Retroviral transduction
Retroviral transduction of RAW macrophages was performed as previously described15. For macrophages expressing the Unc93b1 mutant library, transduced cells were selected with puromycin starting 48h after transduction and the efficiency of drug selection was verified by equal mCherry expression of target cells. When necessary, target cells were sorted on a Becton Dickinson Aria Fusion Sorter to match Unc93b1 expression levels using the bicistronic fluorescent reporter. For retroviral transduction of bone marrow derived macrophages, bone marrow was harvested and cultured in M-CSF-containing RPMI for two days. Progenitor cells were transduced with viral supernatant (produced as above) on two successive days by spinfection for 90 min at 32°C. 48h after the second transduction cells were put on Puromycin selection and cultured in M-CSF-containing RPMI media until harvested on day 8.
Pulse-chase
Cells were seeded into 6 cm dishes the day before. After washing in PBS, cells were starved for 1 h in cysteine/methionine-free media (Corning) containing 10% dialyzed serum (dialyzed in PBS for two days using a 10 kD SnakeSkin), then pulsed with 0.25 mCi/ml 35S-cysteine/methionine (EasyTag Express Protei Labeling Mix, Perkin-Elmer). After a 45-min pulse, cells were washed and cultured in 5 ml chase media containing 0.45 mg/ml L-cysteine and L-methionine or harvested as the zero time point. Time points were harvested as follows: cells were washed twice in 2 ml PBS, then scraped in PBS and cell pellets were subjected to HA immunoprecipitation.
Cell fractionation by sucrose density-centrifugation
Cells in four confluent 15 cm dishes were washed in ice-cold PBS, scraped in 10 ml sucrose homogenization buffer (SHB: 250 μM sucrose, 3 mM imidazole pH 7.4) and pelleted by centrifugation. Cells were resuspended in 2 ml SHB plus protease inhibitor cocktail with EDTA (Roche) and 1mM PMSF and disrupted by 25 strokes in a steel dounce homogenizer. The disrupted cells were centrifuged for 10min at 1000g to remove nuclei. Supernatants were loaded onto continuous sucrose gradients (percent iodixanol: 0, 10, 20, 30) and ultracentrifuged in an SW41 rotor at 25800 rpm for 2 h (Optima L-90K Ultracentrifuge, Beckman Coulter). 22 fractions of 420 µl were collected from top to bottom. 100 µl of each fraction were denatured in SDS buffer for western blot analysis. For immunoprecipitations, three fractions corresponding to ER or endosomes were combined and lysed for 1h after addition of protease inhibitor cocktail and NP-40 to a final concentration of 1%. Coimmunoprecipitation with anti-HA matrix was performed as described below.
Exosome purification
Exosomes were purified as previously described31. Briefly, RAW macrophages were grown in 4 × 15 cm dishes, and 24 h before exosome harvest the cell culture medium was replaced with exosome-depleted medium (RPMI 1640 + 10% FCS + supplements ultra-centrifuged overnight at 100,000 g). The next day cell supernatants were harvested, pooled (80 ml total), and subjected to sequential centrifugation steps at 4°C: 1) 10 min at 300 g to remove live cells; 2) 20 min at 2,000 g to remove dead cells; 3) 30 min at 10,000 g to remove debris; and 4) 70 min at 100,000 g to pellet exosomes. Spins 3 and 4 were performed in an Optima L-90K Ultracentrifuge (Beckman Coulter) using an SW41 swinging-bucket rotor and 12 ml sample tubes. Exosomes were washed in PBS and centrifuged for another 60 min at 100,000 g. Final exosome pellets were lysed in 50–70 µl PBS + 1% NP-40 + Roche complete protease inhibitor cocktail for 30 min and then denatured in SDS loading buffer at room temperature for 1 h. For comparison of exosome protein contents to whole cell lysates, some cells from the initial culture plates were lysed in NP-40 buffer (50 mM Tris [pH 7.4], 150 mM NaCl, 1% NP-40, 5 mM EDTA, supplemented with Roche complete protease inhibitor cocktail) for 1 h at 4°C, centrifuged at maximum speed for 30 min at 4°C, and then denatured in SDS loading buffer at room temperature for 1 h. 20 µl of cell and exosome lysates were kept for protein quantification with the Micro BCA Protein Assay Kit (Thermo Fisher). Between 5–10 µg of total protein was loaded per lane for western blot analysis.
Luciferase assays
Activation of NF-κB in HEK293T cells was performed as previously described6. Briefly, transfections were performed in OptiMEM-I (Invitrogen) with LTX transfection reagent (Invitrogen) according to manufacturer’s guidelines. Cells were stimulated with CpG-B (200 nM 1 µM), R848 (100–200 ng/ml), or human IL-1b (20 ng/ml) after 24 h and lysed by passive lysis after an additional 12–16 h. Luciferase activity was measured on an LMaxII-384 luminometer (Molecular Devices).
Immunoprecipitation, western blot, and dot blot
Cells were lysed in NP-40 buffer (50 mM Tris [pH 7.4], 150 mM NaCl, 0.5% NP-40, 5 mM EDTA, supplemented with 1mM PMSF, Roche complete protease inhibitor cocktail and PhosSTOP tablets). For ubiquitin blots, 40mM N-Ethylmaleimide (Sigma) was added to the lysis buffer. After incubation at 4°C for 1 h, lysates were cleared of insoluble material by centrifugation. For immunoprecipitations, lysates were incubated with anti-HA matrix or anti-FLAG matrix (both pre-blocked with 1% BSA-PBS) for at least 2 h, and washed four times in lysis buffer. Precipitated proteins were eluted in lysis buffer containing 200 ng/ml HA or 3xFLAG peptide, or denatured in SDS loading buffer at room temperature for 1 h. Proteins were separated by SDS-PAGE (Bio-Rad TGX precast gels) and transferred to Immobilon PVDF membranes (Millipore) in a Trans-Blot Turbo transfer system (Bio-Rad). Membranes were blocked with Odyssey blocking buffer, probed with the indicated antibodies and developed using the Licor Odyssey Blot Imager. For dot blot: diluted peptides were dropwise added to nitrocellulose blotting membranes (GE Healthware). Membranes were dried at room temperature, blocked and probed using the Licor Odyssey blot system.
Cell lysis and co-immunoprecipitations for Myddosome analyses were performed in the following buffer: 50 mM Tris-HCl pH 7.4, 150 mM NaCl, 10% glycerol, 1% NP-40 and supplemented with EDTA-free complete protease inhibitor cocktail (Roche), PhosSTOP (Roche) and 1 mM PMSF. Lysates were incubated overnight with anti-Myd88 antibody at 4°C, and then Protein G agarose (pre-blocked with 1% BSA-PBS) was added for additional 2 h. Beads were washed four times in lysis buffer, incubated in SDS loading buffer at room temperature for 1 h, separated by SDS-PAGE, and probed with the indicated antibodies.
Tissue harvest
Spleens and lymph nodes were digested with collagenase XI and DNase I for 30 min and single cell suspensions were generated by mechanical disruption. Red blood cells were lysed in ACK Lysing Buffer (Gibco).
Flow cytometry
Cells were seeded into non-treated tissue culture 24-well plates or round-bottom 96-well plates. The next day cells were stimulated with the indicated TLR ligands. To measure TNFα production, BrefeldinA (BD GolgiPlug, BD Biosciences) was added to cells 30 min after stimulation, and cells were collected after an additional 5.5 h. Dead cells were excluded using a fixable live/dead stain (Violet fluorescent reactive dye, Invitrogen). Cells were stained for intracellular TNFα with a Fixation & Permeabilization kit according to manufacturer’s instructions (eBioscience).
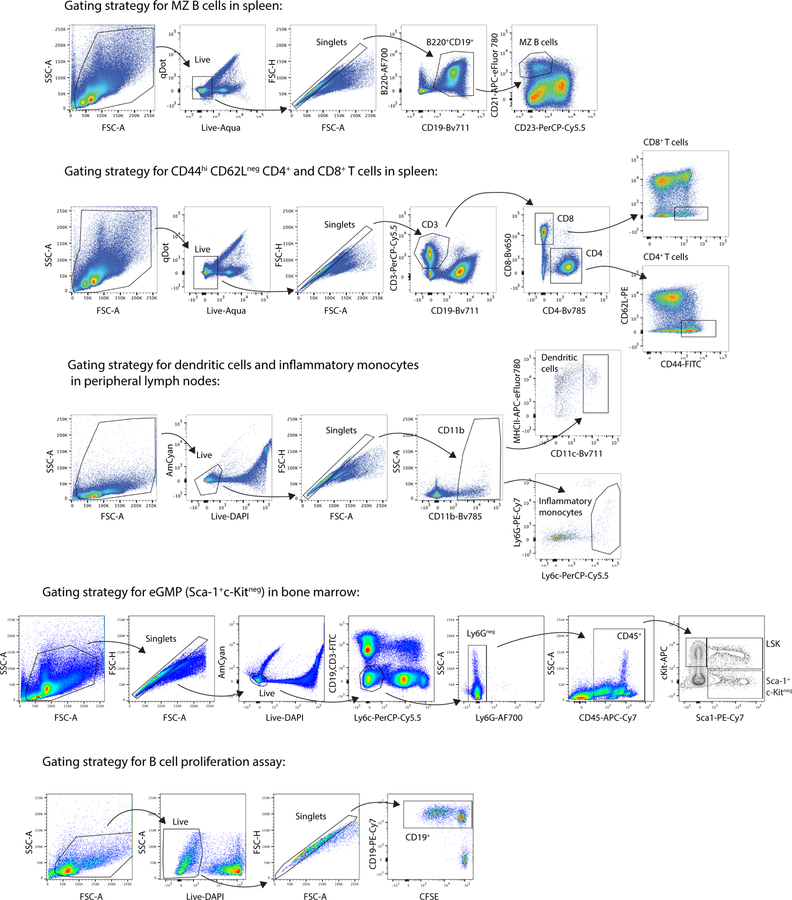
For flow cytometry on mouse cells, dead cells were excluded using a fixable live/dead stain (Aqua fluorescent reactive dye, Invitrogen) or DAPI and all stains were carried out in PBS containing 1% BSA (w/v) and 0.1% Azide (w/v) including anti-CD16/32 blocking antibody. Cells were stained for 20 min at 4°C with surface antibodies. Data were acquired on a LSRFortessa or X20 analyzer (BD Biosciences). See Extended Data Fig 10 for gating strategies.
Enzyme-linked immunosorbent assay (ELISA) and Cytometric bead array (CBA)
Cells were seeded at 105 cells/well into tissue culture-treated flat-bottom 96-well plates. The next day cells were stimulated with the indicated TLR ligands. For TNFα ELISAs, NUNC Maxisorp plates were coated with anti-TNFα at 1.5 µg/ml overnight at 4°C. Plates were then blocked with PBS + 1% BSA (w/v) at 37°C for 1 h before cell supernatants diluted in PBS + 1% BSA (w/v) were added and incubated at room temperature for 2 h. Secondary anti-TNFα-biotin was used at 1 µg/ml followed by Streptavidin-HRP. Plates were developed with 1 mg/mL OPD in Citrate Buffer (PBS with 0.05 M NaH2PO4 and 0.02 M Citric acid, pH 5.0) with HCl acid stop.
For CBA, cell supernatants were collected as above and analyzed using the Mouse Inflammation Kit (BD Biosciences) according to the manufacturer’s instructions.
Type I interferon production by BM-DCs
BM-DCs were seeded at 105 cells/well into tissue culture-treated flat-bottom 96-well plates. The next day cells were stimulated with the indicated TLR ligands for 16 h. The following day, supernatants were transferred onto L-292 ISRE-luciferase reporter cells to determine the amount of released type I IFN. Recombinant mouse IFN-β (pbl interferon source) was used for the standard curve. Reporter cells were incubated in BM-DC supernatants for 8 h, lysed by passive lysis (Promega) and luciferase activity was measured on an LMaxII-384 luminometer (Molecular Devices).
B cell proliferation assay
Spleens were digested with collagenase 8 (Sigma) and DNase-I for 45 min and red blood cells were lysed using ACK buffer (Gibco). Splenocytes were labeled with 12.5ug/ml CFSE (Invitrogen) for 10 min at 37°C and immediately underlayed with 3 ml FCS to spin out CSFE. Cells were taken up in media (RPMI/10%FCS/L-glutamine/Pen-Strep/HEPES/Sodium pyruvate/β-mercaptoethanol), counted, and seeded at 200,000 cells per well in round-bottom 96-well plates. Cells were incubated in media with various concentrations of CpG-B, R848, or LPS for 72 h. Flow cytometry was used to analyze stimulated cells. Live, singlet cells were pre-gated on CD19+ and cell proliferation was determined by the geometric mean fluorescence intensity (gMFI) of CFSE. For the quantification, a proliferation index was determined by dividing the gMFI CSFE of the unstimulated control by the gMFI CSFE of the stimulated sample (CSFEUnstim:CFSESample) and plotted along the ligand titration.
ANA staining
Mouse sera were diluted 1:80 in 1% BSA-PBS and applied to MBL Bion Hep-2 antigen substrate IFA test system for 1 h at room temperature. Slides were washed 3 times with PBS and incubated for 30 min with a mixture of fluorophore-conjugated secondary antibodies against anti-mouse IgG and IgM. Slides were washed 3 times and incubated with DAPI for 5 minutes. After rinsing once with PBS, slides were mounted in VectaShield Hard Set, and imaged on a Zeiss AxioZoom Z.1 slide scanner.
Microscopy
Cells were plated onto coverslips and allowed to settle overnight. Coverslips were washed with PBS, fixed with 4% PFA-PBS for 15 min, and permeabilized with 0.5% saponin-PBS for 5 min. To quench PFA autofluorescence coverslips were treated with sodium borohydride/0.1% saponin-PBS for 10 min. After washing 3x with PBS, cells were blocked in 1% BSA/0.1% saponin-PBS for 1 h. Slides were stained in blocking buffer with anti-HA and anti-Lamp1 (see antibodies above), washed with PBS and incubated for 45 min with secondary antibodies. Cells were washed 3x in PBS and mounted in VectaShield Hard Set. Cells were imaged on a Zeiss Elyra PS.1 with a 100x/1.46 oil immersion objective in Immersol 518F 30°C (Zeiss). Z-Sections were acquired, with three grid rotations at each Z-position. The resulting dataset was SIM processed and Channel Aligned using Zeiss default settings in Zen. The completed super-resolution Z-Series was visualized and analyzed using Fiji32. To compare the degree of colocalization of two proteins a single section from the middle of the Z-Series was selected and analyzed using a customized pipeline for object-based colocalization in Cell Profiler33. Briefly, primary objects (TLR7 vs Lamp1, or Unc93b1 vs Lamp1) were identified and related to each other to determine the degree of overlap between objects. Data are expressed as % of object 1 colocalized with object 2. To avoid any aberrant results due to activation of TLR7 in cells ectopically expressing TLR7 and Unc93b1PKP (e.g., from RNA released from dead cells in the well), we analyzed localization in cells lacking Myd88.
Phagosome isolation and protein complex purification
Cells in a confluent 15cm dish were incubated with ∼108 1 μm magnetic beads (Polysciences) for 4 h. After rigorous washing in PBS, cells were scraped into 10 ml sucrose homogenization buffer (SHB: 250 μM sucrose, 3 mM imidazole, pH 7.4) and pelleted by centrifugation. Cells were resuspended in 2 ml SHB plus protease inhibitor cocktail with EDTA (Roche) and 1mM PMSF and disrupted by 25 strokes in a steel dounce homogenizer. The disrupted cells were gently rocked for 10 min on ice to free endosomes. Beads were collected with a magnet (Dynal) and washed 4x with SHB plus protease inhibitor. After the final wash, phagosome preparations were denatured in 2x SDS buffer at room temperature for 1 h and analyzed by western blot.
For protein complex purification, phagosome preparations were lysed in NP-40 buffer (50 mM Tris, pH 7.4, 150 mM NaCl, 0.5% NP-40, 5 mM EDTA, supplemented with 1 mM PMSF, complete protease inhibitor cocktail and PhosSTOP tablets (Roche) on ice for 1 h. Magnetic beads were removed by magnet and insoluble components were precipitated by 15,000 g spin for 20 min. Lysate was incubated with anti-FLAG matrix for 3 h, followed by four washes in lysis buffer. Proteins were eluted in NP-40 buffer containing 200 ng/ml 3xFLAG peptide, and were further applied to western blot, silver stain or Trypsin in-solution digest for mass spectrometry.
Mass Spectrometry
Proteins were simultaneously extracted from a gel slice and digested with trypsin, and the resulting peptides were dried and resuspended in buffer A (5% acetonitrile/ 0.02% heptaflurobutyric acid (HBFA)). A nano LC column that consisted of 10 cm of Polaris c18 5 μm packing material (Varian) was packed in a 100 μm inner diameter glass capillary with an emitter tip. After sample loading and washed extensively with buffer A, the column was then directly coupled to an electrospray ionization source mounted on a Thermo-Fisher LTQ XL linear ion trap mass spectrometer. An Agilent 1200 HPLC equipped with a split line so as to deliver a flow rate of 300 nl/min was used for chromatography. Peptides were eluted using a 90 min. gradient from buffer A to 60% Buffer B (80% acetonitrile/ 0.02% HBFA).
Protein identification and quantification were done with IntegratedProteomics Pipeline (IP2, Integrated Proteomics Applications, Inc. San Diego, CA) using ProLuCID/Sequest, DTASelect2 and Census. Tandem mass spectra were extracted from raw files using RawExtractor and were searched against the mouse protein database (obtained from UNIPROT) plus sequences of common contaminants, concatenated to a decoy database in which the sequence for each entry in the original database was reversed. LTQ data was searched with 3000.0 milli-amu precursor tolerance and the fragment ions were restricted to a 600.0 ppm tolerance. All searches were parallelized and searched on the VJC proteomics cluster. Search space included all fully tryptic peptide candidates with no missed cleavage restrictions. Carbamidomethylation (+57.02146) of cysteine was considered a static modification. We required 1 peptide per protein and both tryptic termini for each peptide identification. The ProLuCID search results were assembled and filtered using the DTASelect program with a peptide false discovery rate (FDR) of 0.001 for single peptides and a peptide FDR of 0.005 for additional peptides for the same protein. Under such filtering conditions, the estimated false discovery rate was zero for the datasets used.
Quantification and Statistical Analysis
Statistical parameters, including the exact value of n and statistical significance, are reported in the Figures and Figure Legends, whereby n refers to the number of repeats within the same experiment. Representative images have been repeated at least three times, unless otherwise stated in the figure legends. Data is judged to be statistically significant when p < 0.05 by Student’s t-test. To compare the means of several independent groups, a one-way ANOVA followed by a Tukey’s posttest was used. To compare means of different groups across a dose response, a two-way ANOVA followed by a Bonferroni posttest was used. In figures, asterisks denote statistical significance (*, p < 0.05; **, p < 0.01; ***, p < 0.001). Statistical analysis was performed in GraphPad PRISM 7 (Graph Pad Software Inc.).
Extended Data
Extended Data Fig. 1: A C-terminal region in Unc93b1 regulates TLR7 responses.
(a) Unc93b1PKP-expressing macrophages show enhanced TLR7 signaling. Immunoblot of P-p38, P-JNK, P-ERK, and IκBα of RAW macrophages stimulated with R848 (50 ng/ml) for indicated times. Representative of two independent experiments. (b) Unc93b1-Flag expression levels, as measured by Flag immunoblot, of Unc93b1-deficient RAW macrophages retrovirally transduced to express the indicated Unc93b1 alleles. These same cell lines are used for experiments shown in Fig. 1a. All data are representative of three independent experiments, unless otherwise noted.
Extended Data Fig. 2: Unc93b1PKP does not alter TLR9 responses, unlike Unc93b1D34A.
(a) Representative flow cytometry analysis showing percent TNFα positive cells, measured by intracellular cytokine staining, of indicated RAW macrophage lines after stimulation with CpG-B (25 nM), R848 (10 ng/ml), ssRNA40 (1 µg/ml), PolyIC (20 µg/ml), or LPS (10 ng/ml). Shaded histograms show unstimulated controls. (b) TNFα production, measured by ELISA, from the indicated RAW macrophage lines after stimulation for 8h with R848 (10 ng/ml), CpG-B (25 nM), or LPS (50 ng/ml). Bars show mean of n=4 biological replicates pooled from two independent experiments (unpaired two-tailed Student’s t-test). (c) TLR7 and TLR9 trafficking are normal in Unc93b1PKP but not in Unc93b1D34A RAW lines. Immunoblot of TLR7-HA and TLR9-HA from lysates of indicated RAW macrophage lines; FL: full-length. All data are representative of three independent experiments.
Extended Data Fig. 3: Unc93b1PKP does not alter TLR7 trafficking or localization.
(a) Unc93b1PKP does not alter TLR7 export rates. Pulse-chase analysis of TLR7 in Unc93b1WT and Unc93b1PKP-expressing RAW macrophages. Cell lysate was HA immunoprecipitated and subjected to radiolabeled screen and immunoblot. The full-length (FL) and cleaved forms of TLR7 are indicated. An asterisk denotes a nonspecific band. Representative of two independent experiments. (b) Unc93b1PKP does not affect TLR7 trafficking to endosomes. Levels of TLR7, Lamp1, and Calnexin in whole cell lysates (WCL) or lysates of purified phagosomes from the indicated RAW macrophage lines were measured by immunoblot. Representative of three independent experiments. (c) Colocalization of TLR7-HA and Lamp1 in RAW macrophages expressing the indicated Unc93b1-Flag alleles on a Myd88−/− background using superresolution structured illumination microscopy. Shown are representative Unc93b1WT, Unc93b1PKP and Unc93b1H412R cells: TLR7 (red) and Lamp1 (green). Boxed areas are magnified. The plot shows quantification of the percentage of total TLR7 within Lamp1+ endosomes with each dot representing an individual cell. Data are pooled from two independent experiments. Scale bars: 10 µm. Bars show mean ± s.d. (unpaired two-tailed Student’s t-test). P-values are indicated. (d) The subcellular localization of Unc93b1PKP is not altered relative to Unc93b1WT. Colocalization of Unc93b1-Flag (red) and Lamp1 (green) was measured using superresolution structured illumination microscopy in Unc93b1-deficient RAW macrophages complemented with Unc93b1WT, Unc93b1PKP, or Unc93b1H412R. A representative cell is shown for each Unc93b1 allele. Boxed areas are magnified. The plot shows quantification of the percentage of total Unc93b1 within Lamp1+ endosomes with each dot representing an individual cell. Data acquired in a single experiment. Scale bars: 10µm. Bars show mean ± s.d. (unpaired two-tailed Student’s t-test). P-values are indicated.
Extended Data Fig. 4: Mass spectrometry analysis of Unc93b1 complexes.
(a) A small fraction of Unc93b1 resides in endosomes compared to the endoplasmic reticulum (ER). Subcellular fractionation of TLR7-HA, Unc93b1-Flag expressing RAW macrophages was performed by density-gradient centrifugation. The distribution of Calnexin (ER), Lamp1 (late endosomes and lysosomes), Unc93b1-Flag, and TLR7-HA across fractions was measured by immunoblot. Representative of three independent experiments. (b) Workflow for isolation of phagosomes from RAW macrophages and purification of Unc93b1-Flag complexes from phagosome lysates.
Extended Data Fig. 5: Syntenin-1 and Syntenin-2 inhibit TLR7 signaling.
(a) Syntenin-1 is selectively recruited to Unc93b1 upon TLR7 stimulation, but not TLR3 stimulation. Syntenin-1 binding to Unc93b1 was measured by Flag immunoprecipitation followed by immunoblot for Syntenin-1 from RAW macrophage lines stimulated with R848 (0.5 μg/ml) or PolyIC (10 µg/ml) for the indicated times. Levels of Syntenin-1 and Unc93b1-Flag in cell lysates are also shown. (b) Syntenin-1 associates selectively with the TLR7-Unc93b1 complex, but not with TLR9. Syntenin-1 binding to TLR7-HA or TLR9-HA was measured by HA immunoprecipitation followed by immunoblot for Syntenin-1 from indicated RAW macrophage lines stimulated with R848 (0.5 μg/ml) or CpG-B (0.5 µM) for the indicated times. Levels of Syntenin-1 and TLR7/9-HA in cell lysates are also shown. (c) NF-κB activation in HEK293T cells transiently expressing Syntenin-1 and stimulated with TNFα (10 ng/ml). (d) NF-κB activation in HEK293T cells transiently expressing TLR7 and increasing amounts of Syntenin-2. Cells were stimulated with R848 (50 ng/ml) for 16h prior to harvest. Data in c,d were measured using a dual luciferase reporter assay, normalized to Renilla expression and expressed as relative luciferase units (RLU). Bars show mean ± s.d., n=3 biological replicates, one-way ANOVA followed by a Tukey’s post test (95% confidence interval): *p < 0.05, **p < 0.01, ***p < 0.001. All data are representative of at least three independent experiments.
Extended Data Fig. 6: Unc93b1K333R confers enhanced TLR7 signaling without affecting TLR9 and TLR3.
Flow cytometry analysis showing percent TNFα positive cells, measured by intracellular cytokine staining, of Unc93b1-deficient RAW macrophages expressing the indicated alleles after stimulation with CpG (25 nM), R848 (8 ng/ml), PolyIC (20 µg/ml), or LPS (10 ng/ml). Shaded histograms show unstimulated controls. Data are representative of three independent experiments.
Extended Data Fig. 7: Serine phosphorylation in the C-terminal tail of Unc93b1 restricts TLR7 signaling.
(a,b) Validation of the anti-phospho-Unc93b1 polyclonal Unc93b1 antibody. (a) Immunoblots demonstrating the specificity of the phospho-specific antibodies generated against Ser547 and Ser550 in the Unc93b1 C-tail. Varying quantities of synthesized peptides corresponding to the Unc93b1 C-terminal regulatory region with (P-Unc93b1-C) and without (NP-Unc93b1-C) phosphorylated Ser547 and Ser550 were dropped onto membrane and probed with rabbit phospho-specific, affinity-purified polyclonal anti-Unc93b1 IgG. Representative of two independent experiments. (b) Phospho-specific polyclonal antibodies detect both phosphorylated Ser547 and Ser550. Unc93b1 was isolated from Unc93b1-deficient RAW macrophages expressing Unc93b1S547A, Unc93b1S550A, or Unc93b1S547A/S550A by Flag immunoprecipitation followed by immunoblot with phospho-specific polyclonal antibodies. Representative of at least three independent experiments. (c) Intracellular cytokine staining of TNFα in macrophage lines expressing the indicated Unc93b1 alleles and stimulated with CpG (10 nM), R848 (10 ng/ml) ssRNA40 (1 µg/ml), PolyIC (20 µg/ml), or LPS (10 ng/ml). Gray histograms are unstimulated controls. (d) TNFα production, measured by ELISA, from the indicated RAW macrophage lines after stimulation for 8 h with LPS (50 ng/ml). Bars show mean ± s.d., n=3 biological replicates. A representative of three independent experiments is shown. (e) Levels of phospho-p38 and phospho-JNK, as measured by immunoblot, in lysates of the indicated RAW macrophage cells stimulated with R848 (50 ng/ml). Representative of two independent experiments.
Extended Data Fig. 8: Genetic variation in the human Unc93b1 C-terminal regulatory region increases TLR7 responses.
NFκB activation in HEK293T cells transiently expressing TLR7 or TLR5 and the indicated human Unc93b1 alleles was measured using a dual luciferase reporter assay. Cells were stimulated with R848 (10 ng/ml) or Flagellin (2 ng/ml) for 16h prior to harvest. Data are normalized to Renilla expression and expressed as relative luciferase units (RLUs). Bars show mean ± s.d., n=3 biological replicates; one-way ANOVA followed by a Tukey’s posttest (95% confidence interval): *p < 0.05, **p < 0.01, ***p < 0.001. Representative of three independent experiments.
Extended Data Fig. 9: Unc93b1PKP knock-in mice develop systemic inflammation.
(a) CRISPR/Cas9 strategy to generate Unc93b1PKP knock-in mice. Green line indicates the guide sequence. Red bases indicate the edited codons. A representative sequencing trace of genomic DNA from an edited founder mouse is shown. (b) Flow cytometry analysis of the indicated immune cell populations in 6–8 weeks old Unc93b1WT/WT, Unc93b1PKP/WT, and Unc93b1PKP/PKP mice. Frequencies of dendritic cells (CD11b+CD11c+MHCIIhigh) and inflammatory monocytes (CD11b+Ly6c+Ly6Gneg) in lymph nodes are shown. Data points were pooled from four independent experiments. P-values determined by unpaired two-tailed Student’s t-test are listed. (c) Unc93b1PKP/PKP mice exhibit signs of emergency granulopoesis in their bone marrow compartment. Flow cytometry analysis of bone marrow from 6–8 week old Unc93b1WT/WT, Unc93b1PKP/WT, and Unc93b1PKP/PKP mice. Gates representing LSK (CD45+CD3εnegCD19negLy6cnegLy6GnegSca-1highc-Kithigh) and Sca-1highc-Kitneg cells (CD45+CD3εnegCD19negLy6cnegLy6GnegSca-1highc-Kitneg) are indicated and compiled frequencies of Sca-1highc-Kitneg cells are shown on the right. Bars show mean ± s.d., n=3 biological replicates (p-value by unpaired two-tailed Student’s t-test). (d) Representative staining, corresponding to compiled results shown in Fig. 4c, of anti-nuclear antibodies (ANA) using sera from the indicated mouse ages and genotypes. (e,f) Flow cytometry analysis showing percent TNFα positive cells, measured by intracellular cytokine staining, of BMMs and BM-DCs derived from the indicated mice after stimulation with CpG-B (150 nM), R848 (10 ng/ml), ssRNA40 (1 µg/ml), PolyIC (10 µg/ml), or LPS (10 ng/ml). Shaded histograms are unstimulated controls. (g) TNFα production by BM-DCs derived from the indicated mice after stimulation for 8h with R848, CpG-B (150 nM), or LPS (50 ng/ml). (h) TNFα production by BMMs from the indicated mice after stimulation for 8h with CpG-B (500 nM), LPS (50 ng/ml), or increasing concentrations of R848. Data in g,h are mean ± s.d., n=3 biological replicates (p-values determined by unpaired two-tailed Student’s t-test). (i) B cells from Unc93b1PKP/PKP mice show enhanced proliferation in response to TLR7 stimulation. Proliferation of CFSE-labeled B cells after 3 days stimulation with R848 (8 ng/ml) or LPS (1.6µg/ml) was measured by FACS, pre-gating on live CD19+ cells and quantifying the geometric mean fluorescent intensity (gMFI) of CSFE. The proliferation index is defined as gMFI CSFEUnstim: gMFI CFSESample. Bars are mean ± s.d., n=5 mice per group pooled together from three independent experiments (p-values determined by unpaired two-tailed Student’s t-test). (j) Immunoprecipitation of Myd88 from bone marrow-derived macrophages from the indicated mice after stimulation with R848 (500 ng/ml), followed by immunoblot for IRAK2. Input levels of Myd88 and IRAK2 in whole cell lysates (WCL) are also shown. (k) Unc93b1 protein levels in BMMs from indicated mouse genotypes, measured by immunoblot with polyclonal antibodies against endogenous Unc93b1. All data are representative of three independent experiments, unless otherwise noted.
Extended Data Fig. 10: Gating strategies.
Representative gating strategies for marginal zone (MZ) B cells, activated T cells, dendritic cells, inflammatory monocytes, emergency granulopoesis in bone marrow, and B cell proliferation in splenocyte cultures are shown. These strategies were used for the data presented in Fig. 4 and Extended Data Fig. 9.
Supplementary Material
Acknowledgements
We thank Russell Vance and members of the Barton and Vance Labs for helpful discussions and critical reading of the manuscript, Angus Yiu-fai Lee and the Gene Targeting Facilty of the Cancer Research Center at UC Berkeley for generating the Unc93b1PKP/PKP knock-in mice, Lori Kohlstaedt and the Vincent J. Coates Proteomics/Mass Spectrometry Laboratory at UC Berkeley for identification of Unc93b1 interacting proteins, Hector Nolla and Alma Valeros for assistance with cell sorting at the Flow Cytometry Facility of the Cancer Research Laboratory at UC Berkeley, and Steven Ruzin and Denise Schichnes for assistance with microscopy on the Zeiss Elyra PS.1 at the Biological Imaging Center at UC Berkeley. This work was supported by the NIH (AI072429, AI105184 and AI063302 to G.M.B.) and by the Lupus Research Institute (Distinguished Innovator Award to G.M.B.). O.M. was supported by an Erwin Schrödinger (J 3415-B22) and CRI Irvington postdoctoral fellowship. B.L. was supported by the UC Berkeley Tang Distinguished Scholars Program. Research reported in this publication was supported in part by the NIH S10 program under award number 1S10OD018136–01 and by the NIH S10 Instrumentation Grant S10RR025622.
Footnotes
Data availability: The data that support the findings of this study are either included within the manuscript or are available from the corresponding author on reasonable request. Source Data for Figs. 1–4 and Extended Data Figs. 1–9 are included in the online version of the paper. Gel source data can be found in Supplementary Fig. 1.
Supplementary Information is linked to the online version of the paper at www.nature.com/nature.
The authors declare no competing financial interest.
Readers are welcome to comment on the online version of the paper.
References
- 1.Christensen SR et al. Toll-like receptor 7 and TLR9 dictate autoantibody specificity and have opposing inflammatory and regulatory roles in a murine model of lupus. Immunity 25, 417–428, doi: 10.1016/j.immuni.2006.07.013 (2006). [DOI] [PubMed] [Google Scholar]
- 2.Kagan JC & Barton GM Emerging principles governing signal transduction by pattern-recognition receptors. Cold Spring Harb Perspect Biol 7, a016253, doi: 10.1101/cshperspect.a016253 (2014). [DOI] [PMC free article] [PubMed] [Google Scholar]
- 3.Majer O, Liu B & Barton GM Nucleic acid-sensing TLRs: trafficking and regulation. Curr Opin Immunol 44, 26–33, doi: 10.1016/j.coi.2016.10.003 (2017). [DOI] [PMC free article] [PubMed] [Google Scholar]
- 4.Barton GM, Kagan JC & Medzhitov R Intracellular localization of Toll-like receptor 9 prevents recognition of self DNA but facilitates access to viral DNA. Nat Immunol 7, 49–56, doi: 10.1038/ni1280 (2006). [DOI] [PubMed] [Google Scholar]
- 5.Ewald SE et al. Nucleic acid recognition by Toll-like receptors is coupled to stepwise processing by cathepsins and asparagine endopeptidase. J Exp Med 208, 643–651, doi: 10.1084/jem.20100682 (2011). [DOI] [PMC free article] [PubMed] [Google Scholar]
- 6.Ewald SE et al. The ectodomain of Toll-like receptor 9 is cleaved to generate a functional receptor. Nature 456, 658–662, doi: 10.1038/nature07405 (2008). [DOI] [PMC free article] [PubMed] [Google Scholar]
- 7.Mouchess ML et al. Transmembrane mutations in Toll-like receptor 9 bypass the requirement for ectodomain proteolysis and induce fatal inflammation. Immunity 35, 721–732, doi: 10.1016/j.immuni.2011.10.009 (2011). [DOI] [PMC free article] [PubMed] [Google Scholar]
- 8.Park B et al. Proteolytic cleavage in an endolysosomal compartment is required for activation of Toll-like receptor 9. Nat Immunol 9, 1407–1414, doi: 10.1038/ni.1669 (2008). [DOI] [PMC free article] [PubMed] [Google Scholar]
- 9.Deane JA et al. Control of toll-like receptor 7 expression is essential to restrict autoimmunity and dendritic cell proliferation. Immunity 27, 801–810, doi: 10.1016/j.immuni.2007.09.009 (2007). [DOI] [PMC free article] [PubMed] [Google Scholar]
- 10.Pisitkun P et al. Autoreactive B cell responses to RNA-related antigens due to TLR7 gene duplication. Science 312, 1669–1672, doi: 10.1126/science.1124978 (2006). [DOI] [PubMed] [Google Scholar]
- 11.Roberts AW et al. Tissue-Resident Macrophages Are Locally Programmed for Silent Clearance of Apoptotic Cells. Immunity 47, 913–927 e916, doi: 10.1016/j.immuni.2017.10.006 (2017). [DOI] [PMC free article] [PubMed] [Google Scholar]
- 12.Subramanian S et al. A Tlr7 translocation accelerates systemic autoimmunity in murine lupus. Proc Natl Acad Sci U S A 103, 9970–9975, doi: 10.1073/pnas.0603912103 (2006). [DOI] [PMC free article] [PubMed] [Google Scholar]
- 13.Brinkmann MM et al. The interaction between the ER membrane protein UNC93B and TLR3, 7, and 9 is crucial for TLR signaling. J Cell Biol 177, 265–275, doi: 10.1083/jcb.200612056 (2007). [DOI] [PMC free article] [PubMed] [Google Scholar]
- 14.Kim YM, Brinkmann MM, Paquet ME & Ploegh HL UNC93B1 delivers nucleotide-sensing toll-like receptors to endolysosomes. Nature 452, 234–238, doi: 10.1038/nature06726 (2008). [DOI] [PubMed] [Google Scholar]
- 15.Lee BL et al. UNC93B1 mediates differential trafficking of endosomal TLRs. Elife 2, e00291, doi: 10.7554/eLife.00291 (2013). [DOI] [PMC free article] [PubMed] [Google Scholar]
- 16.Tabeta K et al. The Unc93b1 mutation 3d disrupts exogenous antigen presentation and signaling via Toll-like receptors 3, 7 and 9. Nat Immunol 7, 156–164, doi: 10.1038/ni1297 (2006). [DOI] [PubMed] [Google Scholar]
- 17.Fukui R et al. Unc93B1 restricts systemic lethal inflammation by orchestrating Toll-like receptor 7 and 9 trafficking. Immunity 35, 69–81, doi: 10.1016/j.immuni.2011.05.010 (2011). [DOI] [PubMed] [Google Scholar]
- 18.Fukui R et al. Unc93B1 biases Toll-like receptor responses to nucleic acid in dendritic cells toward DNA- but against RNA-sensing. J Exp Med 206, 1339–1350, doi: 10.1084/jem.20082316 (2009). [DOI] [PMC free article] [PubMed] [Google Scholar]
- 19.Kegelman TP et al. Targeting tumor invasion: the roles of MDA-9/Syntenin. Expert Opin Ther Targets 19, 97–112, doi: 10.1517/14728222.2014.959495 (2015). [DOI] [PMC free article] [PubMed] [Google Scholar]
- 20.Chen F et al. Syntenin negatively regulates TRAF6-mediated IL-1R/TLR4 signaling. Cell Signal 20, 666–674, doi: 10.1016/j.cellsig.2007.12.002 (2008). [DOI] [PubMed] [Google Scholar]
- 21.Baietti MF et al. Syndecan-syntenin-ALIX regulates the biogenesis of exosomes. Nat Cell Biol 14, 677–685, doi: 10.1038/ncb2502 (2012). [DOI] [PubMed] [Google Scholar]
- 22.Grassel L et al. The CD63-Syntenin-1 Complex Controls Post-Endocytic Trafficking of Oncogenic Human Papillomaviruses. Sci Rep 6, 32337, doi: 10.1038/srep32337 (2016). [DOI] [PMC free article] [PubMed] [Google Scholar]
- 23.Sorkin A & von Zastrow M Endocytosis and signalling: intertwining molecular networks. Nat Rev Mol Cell Biol 10, 609–622, doi: 10.1038/nrm2748 (2009). [DOI] [PMC free article] [PubMed] [Google Scholar]
- 24.Jeppesen DK et al. Reassessment of Exosome Composition. Cell 177, 428–445 e418, doi: 10.1016/j.cell.2019.02.029 (2019). [DOI] [PMC free article] [PubMed] [Google Scholar]
- 25.Raiborg C & Stenmark H The ESCRT machinery in endosomal sorting of ubiquitylated membrane proteins. Nature 458, 445–452, doi: 10.1038/nature07961 (2009). [DOI] [PubMed] [Google Scholar]
- 26.Latty SL et al. Activation of Toll-like receptors nucleates assembly of the MyDDosome signaling hub. Elife 7, doi: 10.7554/eLife.31377 (2018). [DOI] [PMC free article] [PubMed] [Google Scholar]
- 27.https://www.phosphosite.org/proteinAction.action?id=14824.
- 28.Tamura K et al. Increased production of intestinal immunoglobulins in Syntenin-1-deficient mice. Immunobiology 220, 597–604, doi: 10.1016/j.imbio.2014.12.003 (2015). [DOI] [PubMed] [Google Scholar]
- 29.Majer O et al. Release from Unc93b1 reinforces the compartmentalized activation of select Toll-like receptors Submitted. [DOI] [PMC free article] [PubMed] [Google Scholar]
- 30.Mali P et al. RNA-guided human genome engineering via Cas9. Science 339, 823–826, doi: 10.1126/science.1232033 (2013). [DOI] [PMC free article] [PubMed] [Google Scholar]
- 31.Thery C, Amigorena S, Raposo G & Clayton A Isolation and characterization of exosomes from cell culture supernatants and biological fluids. Curr Protoc Cell Biol Chapter 3, Unit 3 22, doi: 10.1002/0471143030.cb0322s30 (2006). [DOI] [PubMed] [Google Scholar]
- 32.Schindelin J et al. Fiji: an open-source platform for biological-image analysis. Nat Methods 9, 676–682, doi: 10.1038/nmeth.2019 (2012). [DOI] [PMC free article] [PubMed] [Google Scholar]
- 33.Carpenter AE et al. CellProfiler: image analysis software for identifying and quantifying cell phenotypes. Genome Biol 7, R100, doi: 10.1186/gb-2006-7-10-r100 (2006). [DOI] [PMC free article] [PubMed] [Google Scholar]
Associated Data
This section collects any data citations, data availability statements, or supplementary materials included in this article.


